Preface The scope of metallobiochemistry has greatly expanded in recent years as ever more powerful techniques have been brought to bear on the constituent elements that define and characterize the subject. Metallobiochemistry, Part A, Volume 158 of Methods in Enzymology, focused on progress in those areas in which early on there were major impediments to growth and development. Without the tools to measure metals with sufficient accuracy, precision, and sensitivity this scientific discipline could not have existed. In addition, unless it were possible to distinguish between the metals present in a biological sample that belonged there (because nature intended them to be) from those that merely appeared by accident (adventitious contamination), such metal analyses would have been meaningless. Technology overcame these hurdles, and Part A detailed the state of trace element analysis and the various approaches employed by the metallobiochemist to avoid artifacts and achieve the inorganic equivalent of microbiological sterility. It is a summary of the critical methods that have helped place the subject on a solid foundation. Metallobiochemistry, Part B, Volume 205 of this series, is devoted to metallothionein and related molecules. It is unusual for a Methods in Enzymology volume to feature a single molecule, but the surge of interest in metallothionein and its structural and possibly functional relationship to DNA-binding proteins suggested that such a volume would be timely and useful. It also seemed appropriate to stress that not all metal-containing biological molecules are metalloenzymes or electron-transport proteins. Parts C and D, Volumes 226 and 227, respectively, return to the theme of methods that have contributed to and are emerging as important factors in the advancement of the field. These methods embody concepts that had their origin about the time of the almost forgotten Sumner-Willst~itter controversy of the 1920s. Proteins, it was claimed, could hardly serve as specific biological catalysts if they were little more than nondescript colloids. Metal ions would prove to be the real actors on the enzymatic stage. Authority prevailed until the crystallization of urease seemingly dispatched the metal dogma to oblivion. Despite the extended protests of interest-vested diehards, protein chemistry became inextricably associated with enzymology and metals fell out of fashion. (Ironically, urease turned out to be a nickel enzyme.) Biochemists who had witnessed this metal-induced brouhaha were understandably reluctant to resurrect the idea that metals might have something to do with biological catalysis. Anyone wishing to make the case would have to have persistence along with persuasive and unassailix
X
PREFACE
able analytical data. Only through scrupulous attention to detail was it possible in those neonatal days of metallobiochemistry to gain the acceptance that allowed the field to grow and flourish. Despite its shortcomings the metal-cum-colloid view of catalysis did have one rather appealing feature: the metal would have unique properties among all the atoms of the protein and perhaps these could be exploited to gain important information. The metal could serve as a beacon to guide the investigator searching for an active site. It could also be a signal, either of the detailed steps of catalysis or of any other biological function with which the metal might be associated. Emission spectroscopy proved the significance of a metal-derived signal in principle, but was rather inconsiderate of the protein. Hence, attention shifted along with wavelength to absorption spectroscopy whereby it became possible to view the functional heart of a metalloenzyme directly. This window on the world of metallobiochemistry revealed unprecedented spectral features clearly indicative of an unusual coordination environment and likely characteristic of a catalytic site. Not all metals lend themselves to absorption spectroscopic investigation. Zinc, one of nature's most recurrent participants, is notoriously shy in this regard. Other metals are more expressive and revealing when viewed by alternative techniques. In these two volumes (226 and 227) we have assembled a broad representation of the physical and spectroscopic methods now available that can be useful for examining metals in biological systems and for probing their environments in metalloproteins and metalloenzymes. These approaches, while by no means all-inclusive, exemplify the wide variety of tools and the level of sophistication currently being applied to extract both the nuances and the general principles of metallobiochemistry pertinent to these systems. We are extremely grateful to our contributors for their willingness to participate in this endeavor. They have made a concerted effort to describe techniques in ways that would be most beneficial to the reader. The chapters differ from the more typical ones in this series in that they identify principles underlying a particular method, the kinds of questions that can be addressed, and the ways to interpret results. Step-by-step instructions were not practical in most cases, and generally the objective has been to provide a sense of what can be accomplished. It required more description than anticipated for most of the topics, and this necessitated two volumes instead of one. We appreciate the understanding of our colleagues at Academic Press and we thank them again as well as all the contributors for making this such a pleasant experience. JAMES F. RIORDAN BERT L. VALLEE
[1]
2D NMR OF PARAMAGNETICMETALLOPROTEINS
1
[1] T w o - D i m e n s i o n a l N u c l e a r M a g n e t i c R e s o n a n c e of Paramagnetic Metalloproteins
By ANT6NIO V. XAVIER, DAVID L. TURNER, and HELENA SANTOS Introduction Depending on the interactions between nuclear spins and unpaired electrons, the parameters of the nuclear magnetic resonance (NMR) spectra of paramagnetic molecules may be drastically different from those of diamagnetic onesl-5: the relaxation times, T~ and T2, may be shortened, and the chemical shifts, 8, can be changed. For nuclei that are more than a few bonds away from the paramagnetic center, their interaction with the unpaired electron is purely dipolar and depends on geometrical functions (including Curie relaxationS-7); thus, they provide important structural information. Although the relaxation induced by the unpaired electron can be such that the signals from resonating nuclei are so broad as to be undetectable by NMR, the paramagnetically induced shifts generally result in an increase in spectral resolution. Because the correlation time for the unpaired electron relaxation, zs, is the dominant parameter contributing to the relaxation of magnetic nuclei in a paramagnetic macromolecule, the application of NMR in the study of these molecules is limited to those cases in which zs is not too long. Several examples of the successful use of one-dimensional (ID) NMR in the study of paramagnetic molecules are available, 4 as well as examples of structural studies in which paramagnetic centers naturally present, extrinsically added, or introduced by isomorphous replacement of spectroscopically unsuitable ones are used to obtain geometrical information 8-I° or just to improve resolution and to assist in spectral assignments. i R. A. Dwek, R. J. P. Williams, and A. V. Xavier, in " M e t a l Ions in Biological S y s t e m s " (H. Sigel, ed.), p. 61. Dekker, N e w York, 1974. 2 G. N. L a Mar, in "Biological Applications of Magnetic R e s o n a n c e " (R. G. Shulman, ed.), p. 305. A c a d e m i c Press, N e w York, 1979. 3 j. D. Satterlee, Annu. Rep. N M R Spectrosc. 17, 79 (1986). 4 I. Bertini and C. Luchinat, " N M R of Paramagnetic Molecules in Biological S y s t e m s . " B e n j a m i n / C u m m i n g s , N e w York, 1986. 5 I. Bertini, L. Banci, and C. Luchinat, this series, Vol. 177, p. 246. 6 M. Gueron, J. Magn. Reson. 19, 58 (1975). 7 A. J. Vega and D. Fiat, Mol. Phys. 31, 347 (1976). 8 C. D. Barry, A. C. T. North, J. A. Glasel, R. J. P. Williams, and A. V. Xavier, Nature (London) 232, 236 (1971).
METHODS IN ENZYMOLOGY,VOL. 227
Copyright © 1993by AcademicPress, Inc. All rights of reproduction in any form reserved.
2
PROBES OF METAL ION ENVIRONMENTS
[1]
The advent of two-dimensional (2D) NMR techniques, which has greatly enhanced the range of potential applications of NMR spectroscopy to the study of macromolecules, 11 posed a further constraint in possible applications to the study of paramagnetic molecules. In fact, the 2D NMR technique can reveal scalar and dipolar (or chemical exchange) interactions, through the observation of connectivity signals (cross-peaks) between different nuclei (or the same nuclei but in different chemical environments) that develop during specially designed mixing and evolution periods. Because the frequency of labeling decays with the relaxation rate of the interacting nuclei, there is a stringent time scale for the useful application of 2D NMR to the study of paramagnetic molecules. Thus, specific conditions must be used in order to optimize the acquisition of the information required. The application of 2D NMR to paramagnetic proteins has grown exponentially, lagging just a few years behind the growth of applications to diamagnetic systems. For example, in 1986 Wuthrich 11 provided the first comprehensive account of 2D methods in protein NMR, Satterlee 3 mentioned that this technique should have application for paramagnetic systems in the future, and Bertini and LuchinaP mentioned just one example of a 2D NMR study of paramagnetic proteins. 12 The nuclear Overhauser effect spectroscopy (NOESY) 13 sequence was first applied to paramagnetic proteins in order to detect chemical exchange between two paramagnetic forms 12 (see Fig. 1) and between a diamagnetic and paramagnetic form [called exchange correlated spectroscopy (EXCTSY)14], making it possible to assign resonances in the paramagnetic (oxidized) spectrum from independently assigned resonances in the diamagnetic (reduced) one. Of course, those experiments also provided information about nuclear Overhauser effects (NOEs), but the technique was not widely used for paramagnetic proteins until 1988.15 Similarly, correlation spectroscopy ( C O S Y ) 16 w a s used to detect scalar couplings between aromatic protons 17 and between a-CH and NH
9 I. D. Campbell, C. M. Dobson, R. J. Williams, and A. V. Xavier, Annu. N. Y. Acad. Sci. 222, 163 (1973). ~0R. A. Dwek, " N M R in Biochemistry." Oxford Univ. Press (Clarendon), Oxford, 1973. H K. Wuthrich, " N M R of Proteins and Nucleic Acids." Wiley, New York, 1986. 12 H. Santos, D. L. Turner, A. V. Xavier, and J. LeGall, J. Magn. Reson. 59, 177 (1984). 13 j. Jeener, B. H. Meier, P. Bachmann, and R. R. Ernst, J. Chem. Phys. 71, 4546 (1979). 14 j. Boyd, G. R. Moore, and G. Williams, J. Magn. Reson. 58, 511 (1984). 15 S. J. McLachlan, G. N. La Mar, and K.-B. Lee, Biochim. Biophys. Acta 957, 430 (1988). 16 W. P. Aue, E. Bartholdi, and R. R. Ernst, J. Chem. Phys. 64, 2229 (1976). ~7G. Williams, G. R. Moore, R. Porteous, M. N. Robinson, N. Soffe, and R. J. P. Williams, J. Mol. Biol. 183, 409 (1985). 18 A. J. Wand, H. Roder, and S. W. Englander, Biochemistry 25, 1107 (1986),
[1]
2D NMR oF PARAMAGNETICMETALLOPROTE1NS
3
-15
(~ M~s
-20
0
o
-25
D!0rn
pprn. . . .
2'5
. . . .
20 '
. . . .
15 '
FIG. 1. NOESY spectra of partially oxidized Desulfooibrio oulgaris cytochrome c 3 showing cross-peaks resulting from intermolecular electron transfer. The sample was a 2 mM solution in 2H20 at 298 K. The spectrum was recorded on a Bruker (Karlsruhe, Germany) AMX500 (500 MHz) spectrometer using a mixing time of 25 msec with the transmitter frequency set at the position of the residual water line, which was suppressed by presaturation for 2 sec. Pure absorption peaks were obtained using time proportional phase incrementation (TPPI) with 2048 points in t2 and 512 increments in tl. The data were zero-filled to 2048 × 1024 points, and a window function for Lorentzian to Gaussian line shape transformation was applied in t2 and a cosine-square function in t~ prior to the 2D Fourier Transform (FT). A peak connecting resonances from molecules in which two and three hemes are oxidized is labeled with its specific assignment (c.f. Ref. 72).
protons ~8 far from the paramagnetic centers and later to assign protons close to an oxidized heme. 19 A variety of related methods including double quantum filter ( D Q F ) - C O S Y 2°,21 and 2D total correlation spectroscopy (TOCSY) 22 (see Fig. 2) were in use by 1990. 23-27 19 H. Santos and D. L. Turner, FEBS Lett. 226, 179 (1987). 2o M. W. Edwards and A. Bax, J. Am. Chem. Soc. 108, 918 (1986). 21 N. Muller, R. R. Ernst, and K. Wuthrich, J. Am. Chem. Soc. 108, 6487 0986). 22 L. Braunschweiler and R. R. Ernst, J. Magn. Reson. 53, 521 (1983). 23 y . Yamamoto, A. Osawa, Y. Inoue, R. Chuj6, and T. Suzuki, FEBS Lett. 247, 263 (1989). 24 y . Feng, H. Roder, and S. W. Englander, Biophys. J. 57, 15 (1990). 25 S. D. Emerson and G. N. La Mar, Biochemistry 29, 1545 (1990).
4
PROBES OF METAL ION ENVIRONMENTS
[1]
11
10 I
!
"I .I
14
15
ppm
ppm
1'5
I'0
5
(~
FIG. 2. TOCSY spectrum of Methylophilus methylotrophus ferricytochrome c", 2 mM in 2H20 at 300 K. A 50 msec mixing time was used with a power level of 10 kHz and WALTZ modulation for spin locking. An exponential window function was used in t 2, and the remaining conditions for data recording and processing were the same as those given in the legend to Fig. 1. The complete spin systems of one of the axial histidine ligands (H) and one of the heme propionates (P) are indicated by boxes (c.f. Ref. 73).
Heteronuclear COSY was applied to paramagnetic systems earlier than homonuclear proton experiments. Correlation of 1~C and IH shifts of groups far from the paramagnetic center was used with 13C enrichment in 1983, z8 but correlations between 1H and 13C in natural abundance were used to assign methyl groups of an oxidized heme as early as 1986z9(Fig. 3). Any technique that can be applied to a diamagnetic protein can (and will) be used to study paramagnetic proteins. Indeed, large sections of the polypeptide chain that are remote from the paramagnetic center are 26 S. 27 L. 28 T. 29 H.
C. Busse, S. J. Moench, and J. D. Satterlee, Biophys. J. 58, 45 (1990). P. Yu, G. N. La Mar, and K. Rajarathnam, J. Am. Chem. Soc. 112, 9527 (1990). M. Chan and J. Markley, Biochemistry 22, 5996 (1983). Santos and D. L. Turner, FEBS Lett. 194~ 73 (1986).
[1]
2 D N M R OF PARAMAGNETIC METALLOPROTEINS
5
t.
PROTON
~
°'~ e-~
o~
I
i
~ o W
E
E
o I 0
o
£ ~C n" W U_
I
oi
e.~
~z
.~'!~ °
i
~ ~i; -~
i
.9
.~. ~ ' ~
6
PROBES OF METAL ION ENVIRONMENTS
[1]
essentially indistinguishable from their equivalents in diamagnetic systems. We therefore concentrate on nuclei with large dipolar or Fermi contact shifts and/or relaxed by paramagnetic metal ions. For most purposes the nuclei outside a sphere or approximately 0.75 nm from the paramagnetic center can be considered as "diamagnetic." Before considering the information that may be obtained from two(three- or four-) dimensional experiments, it should be stressed that the same information can always be obtained from a series of one-dimensional experiments. These may be selective analogs of the 2D experiments or, in the case of the NOE, the development of a equilibrium with a resonance which is selectively and continuously saturated. Of course, this one-dimensional NOE experiment produces a larger effect than the dynamic process of relaxation of the complete spin system which occurs in NOESY, which is a dynamic NOE experiment. The effective sensitivity (signal-to-noise ratio, S/N) per unit time of a two-dimensional experiment may be expressed as 3°
which depends on the effective decay rate, T*2, and the length, 7"2, of the free induction decay sampled in each sequence as well as the decay rate, T#2, during the evolution period, which is incremented up to a maximum length 7"1. One-dimensional experiments only depend on the first term in the equation, as can be seen by letting 7"1 tend to zero, so they are less affected by more rapid relaxation. However, each selective one-dimensional experiment probes the interactions of a single nucleus, whereas a two-dimensional experiment provides information about all possible interactions simultaneously. It is therefore a balance between the second term of the equation and the number of interactions to be observed that governs the choice of approach. These may not be the only considerations because it is often convenient to have cross-peaks from known interactions present to provide a reference for the same sample and spectrometer conditions. It is clear, however, that if the interactions of a single resonance are sought, then a onedimensional experiment will be far more efficient.26,3° Experimental Considerations Having decided that the system under investigation is sufficiently complex to warrant the use of 2D methods, we may now consider which 3o D. L. Turner, J. Magn. Reson. 61, 28 (1985).
[1]
2D NMR OF PARAMAGNETICMETALLOPROTEINS
7
methods are the most useful. The simplest experiment for detecting scalar (J) couplings between nuclei is COSY, which may be applied to homonuclear or heteronuclear systems. The main advantage of COSY is that the magnetization transfer is effected almost instantaneously by a radio frequency pulse so that there is no loss of signal through relaxation. The main disadvantage is that the cross-peaks comprise several components of opposite phase which will cancel each other out if the intrinsic line width is large with respect to the coupling constant. A second complication, which is shared by most other 2D experiments, is that the spectrum correlates the frequency (with respect to the transmitter or reference frequency) of a resonance in F 2 with another in F~, together with the negative of its F~ frequency. If the spectral width in the second dimension (FI) is the same as that in F2, then the positive and negative frequency patterns will overlap. This may be resolved by canceling one set of signals by phase cycling (usually the positive Fl frequencies, called N-type selection), which is undesirable because information is being eliminated, or by separating the two patterns and then recombining them so that they are superimposed. The latter approach will also generate "pure phase" signals, that is, signals with simple absorption, or dispersion cross sections in both dimensions. A number of methods can be used to achieve this: States, 3~ TPPI, 32 and hypercomplex 33 procedures are most common. They share the same principles but differ in the routing of data such that various artifacts may appear in different places with respect to the true COSY spectrum. Most groups use absolute value spectra because of the cancellation of pure absorption cross-peaks that occurs when the lines a r e b r o a d . 27'34-36 This is unwise because all of the intensity at the center of the cross-peak comes form the dispersion mode (the absorption mode gives a zero signal on cross sections through the center, regardless of linewidth), so that the absolute value spectrum will degrade the signalto-noise ratio first by mixing the independent noise traces from the absorption and dispersion components and, second, by rendering it purely positive. The best procedure for broad lines is to use a matched filter, sin(TrJt) exp(-t/Tz), and to phase the cross-peaks correctly to be purely dispersive. This has the additional advantage of producing pure absorption and therefore narrow peaks on the diagonal. If the spectrum is poorly 31 D. J. States, R. A. Haberkorn, and D. J. Ruben, J. Magn. Reson. 48, 286 (1982). 32 D. Marion and K. Wuthrich, Biochem. Biophys. Res. Commun. 113, 967 (1983). 33 L. Muller and R. R. Ernst, Mol. Phys. 38, 963 (1979). 34 I. Bertini, F. Copozzi, C. Luchinat, and P. Turano, J. Magn. Reson. 95, 244 (1991). 35 j. D. Satterlee, D. J. Russell, and J. E. Erman, Biochemistry 30, 9072 (1991). 36 K. A. Keating, J. S. de Ropp, G. N. La Mar, A. L. Balch, F.-Y. Shiau, and K. M. Smith, lnorg. Chem. 30, 3258 (1991).
8
PROBES OF METAL ION ENVIRONMENTS
[1]
digitized, there may be some advantages in examining an absolute value plot of the spectrum as well. However, many pulse sequences for "magnitude" or "absolute value" COSY employ N- or P-type peak selection, and these should never be used because they lead to loss of half of the signal. Narrow diagonal peaks allow cross-peaks to be observed between resonances with small separations. This is the principal purpose of the double quantum filter in D Q F - C O S Y , together with the elimination of singlets that may arise from the solvent or from impurities. The elimination of singlets is not usually very important, but the narrow diagonal is achieved at the cost of one-half of the cross-peak intensity. A pure dispersion COSY is therefore preferable. The same applies to the " I S E C R - C O S Y ''37 experiment, which incorporates refocusing delays of the order of I / Z / f o r the purpose of bringing the components of the crosspeaks into the same phase: the signal is reduced by a further approximately 50 msec of relaxation for very little gain. Extended mixing periods can be useful, however, to find resonances that belong to the same spin system (a set of coupled nuclei within a single side-chain or prosthetic group) but do not couple directly with each other. Experiments of this type include relayed C O S Y 38 and T O C S Y . 22'39 The first involves a number of COSY-type magnetization transfer steps with refocusing delays that can be optimized for a particular series of coupling constants. The TOCSY experiment uses a somewhat different principle insofar as the radio frequency field is applied continuously during the mixing period and creates a series of cross-peaks to other nuclei of the same spin system that have all their components of the same phase. The transfer of magnetization between nuclei requires times of the order of 1/2J and is an oscillatory process, so some cross-peaks of the spin system may be weak for a single mixing time. In principle, a full set of crosspeaks between, for example, an amide proton and the shifts of all the protons in a particular residue may be observed, which may well allow a primary assignment to be made directly. There is a potential disadvantage in that correlations caused by cross-relaxation (NOEs) may then also occur, and these are of opposite sign to the cross-peaks generated by J coupling. Two protons may be coupled and also cross-relax, so that the cross-peak between them may be partially canceled. When short mixing times (9) required to form the E- P complex of the Cd-substituted enzyme prevents determination of the crystal structure of the E. P complex for the Cd enzyme. The structure of the covalent E - P complex formed at neutral pH by the Cd enzyme has been determined. 38 CdB appears to be coordinated to the ester oxygen of the E - P complex, yet no J coupling to 113Cd is observed on the solution 31p signal (Fig. 7D). Thus, the interpretation of the absence of 31p-113Cd coupling as indicating no coordination to phosphate may have to be treated with caution. Unusual P-O-I13Cd bonds formed in proteins may reduce coupling, or coordination with the ester oxygen of a covalently bound phosphate may not give rise to resolvable coupling. Conformational flux in a protein, perhaps not present in a crystal structure, may be an additional factor affecting the observation of 31p-o-I13Cd coupling. A 30 Hz 31p-o-113Cd coupling has also been observed on the 31p NMR signal of the inhibitor L-phenylalanine phosphoramidate phenyl ester bound to 113Cd-carboxypeptidase A, showing that the phosphate oxygen of the inhibitor coordinates the 113Cd ion at the active center. 36 Further work with phosphate-binding metalloenzymes will be needed to clarify the conclusions that can be made from the presence or absence of 31p-113Cd coupling.
[3]
L A N T H A N I D E SHIFT REAGENTS
43
Solid-State 113CdNuclear Magnetic Resonance of 113CdProteins Solid-state NMR spectra of mCd bound at protein binding sites, especially the comparison of a H3Cd static powder spectrum and the envelope of spinning side bands obtained by magic angle spinning (MAS), provide information about the ~13Cd chemical shift tensor. 13'15 This information can, in comparison to solid-state spectra of model l~3Cd compounds, lead to conclusions about the nature of the "3Cd complex not provided by the isotropic line from high-resolution solution NMR. The major hurdle has been the preparation of appropriate solid-state samples of n3Cd-substituted proteins. It was first thought that lyophilized powder samples would provide a ready means of accessing the solid-state spectra of most H3Cd proteins. Unfortunately, it has been shown that lyophilization to the point of significant dehydration of the protein leads to heterogeneity of the l~3Cd spectrum, apparently owing to heterogeneity in the precise conformation of the protein. This conformational heterogeneity is transferred to heterogeneity of the N3Cd complex such that multiple overlapping spectra of slightly different chemical shift determine the line shape. ~aThis was shown by the facts that MAS spectra failed to generate narrow l laCd lines and that controlled rehydration of the lyophilized protein powder with DzO resulted in narrowing of the MAS lines and the generation of a more typical solid-state mCd profile. Studies of this kind have been carried out on parvalbumin in which ll3Cd2+ was substituted for the single Ca 2+ and on concanavalin A in which "3Cd was substituted at both the Ca z+ and Mn 2+ binding sites (Fig. 8). Acknowledgment Original work on "3Cd NMR of metalloproteins carried out in the author's laboratory was supported by National Institutes of Health Grant DK09070.
[3] L a n t h a n i d e Shift R e a g e n t s
By CARLOS F. G. C. GERALDES Introduction The first report by Hinckley I more than 20 years ago of the use of lanthanide complexes to simplify unresolved proton resonances in IowI C. C. H i n c k l e y , J. Am. Chem. Soc. 91, 5160 (1969).
METHODS IN ENZYMOLOGY, VOL. 227
Copyright © 1993 by Academic Press, Inc. All rights of reproduction in any form reserved.
44
PROBES OF METAL ION ENVIRONMENTS
[3]
field nuclear magnetic resonance (NMR) spectra marked the start of the application of the lanthanide-induced shift (LIS) method to a variety of NMR problems. One year later, Morallee e t al. 2 showed that the line broadenings induced by the gadolinium(III)-lysozyme complex in the proton resonances of fl-methyl-N-acetylglucosamine could be analyzed in terms of the absolute distance between the Gd(III) ion and various sugar protons. These observations stimulated much interest and activity in the use oflanthanides as NMR shift and relaxation reagents, in applications ranging from qualitative spectral simplification, proof of molecular stereochemistry, and quantitative analysis of dynamic solution structures to the most recent applications in NMR spectroscopy of perfused cells, organs, and intact animals and magnetic resonance imaging (MRI). All the applications are based on basic properties of the lanthanide cations, such as their Lewis acid behavior in the formation of complexes of high coordination numbers and their unpaired f electrons. When a Lewis base interacts with a lanthanide cation, any NMR-active nucleus within that base is influenced by the presence of the unpaired felectrons, leading to paramagnetic relaxation or broadening of that resonance and, in some cases, a shift to a different NMR frequency. If the interaction between the Lewis acid cation and the base is purely electrostatic, paramagnetic cations that have an anisotropic distribution o f f electrons originate a lanthanide-induced NMR dipolar (or pseudocontact) shift, which is the type of LIS useful in obtaining structural information. Gd(III) has 7 unpaired electrons distributed isotropically in its 4 f shell and, therefore, cannot produce a NMR dipolar shift. If, however, the Lewis acid-base interaction is partially covalent, a small amount of unpaired electron spin density can reach the molecular framework of the base and result in a second type of LIS, the contact (or scalar) shift. The goal of this chapter is to describe LIS methodologies and their application to study proteins in solution. The qualitative uses of lanthanides to simplify complex NMR spectra are not mentioned because highfield magnets and two- and three-dimensional methods have eliminated the need for LIS measurements for this purpose. The use of lanthanides as shift and relaxation reagents in organic solutions has been reviewed extensively, 3-9 as well as well as their applications as NMR structural 2 K. G. Morallee, E. Nieboer, F. J. C. Rossotti, R. J. P. Williams, and A. V. Xavier, Chem. Commun., 1132 (1970). 3 j. K. M. Saunders and D. H. Williams, Nature (London) 2411, 285 (1972). 4 j. Reuben, Prog. Nucl. Magn. Reson. Spectrosc. 9, 1 (1973). 5 W. de W. Horrocks, Jr., " N M R of Paramagnetic Molecules." Academic Press, New York, 1973. 6 R. E. Sievers (ed.), "NMR Shift Reagents." Academic Press, New York, 1973.
[3]
LANTHANIDE SHIFT REAGENTS
45
probes in aqueous solutions, particularly for biological systems including peptides and proteins. ~0-16The use of lanthanide shift reagents in conjunction with alkali metal NMR in biological systems is described in [4] of this volume. Lanthanide Ions as Structural Probes The use of metal ions as extrinsic structural probes, either by their specific binding to biochemical molecules that do not naturally contain metal ions or by substitution of those metal ions naturally present by others of similar chemical reactivity but possessing improved physical properties, has proved to be a versatile research tool. The trivalent lanthanide ions, which constitute a family with interesting electronic and magnetic properties and fairly similar chemical properties, constitute a set of potentially powerful probes. H They should, however, be used with caution, as various problems may arise. ~°'H'~5 First, the various lanthanide complexes of a particular ligand should be isostructural. Any variation in structure would jeopardize strategies for structure determination that involve, for example, the simultaneous analysis of paramagnetic shift or relaxation data obtained for complexes in which the central lanthanide ions are different [such as ytterbium(Ill) and Gd(III)]. For the cases where the question of isostructurality in solution has been examined in detail, contradictory conclusions have been reached. 17-19
7 M. R. Wilcott III and R. E. Davis, Science 19tl, 850 (1975). 8 j. Reuben and G. Elgavish, in "Handbook of Physics and Chemistry of Rare Earths" (K. A. Gschneider and L. Eyring, eds.), North Holland, New York, 1979. 9 T. C. Morrill (ed.), "Lanthanide Shift Reagents in Stereochemical Analysis." VCH Publ., New York, 1986. 10 R. A. Dwek, " N M R in Biochemistry." Oxford Univ. Press (Clarendon), Oxford, 1973. it E. Nieboer, Struct. Bonding (Berlin) 22, 1 (1975). 12 C. M. Dobson and B. A. Levine, " N e w Techniques in Biophysics and Cell Biology," Wiley, New York, 1976. ~3 L. Lee and B. D. Sykes, "Methods for Determining Metal-Ion Environments in Proteins: Structure and Function of Metalloproteins." Elsevier, North Holland, New York, 1980. 14 F. Inagaki and T. Miyazawa, Prog. Nucl. Magn. Reson. Spectrosc. 14, 67 (1981). 15 R. E. Lenkinski, in "Biological Magnetic Resonance" (L. J. Berliner and J. Reuben, eds.), Vol. 6, Chap. 1. Plenum, New York, 1984. 16 j. C. G. Biinzli and G. R. Choppin (eds.), "Lanthanide Probes in Life, Chemical and Earth Sciences." Elsevier, Amsterdam, 1989. 17 B. A. Levine and R. J. P. Williams, Proc. R. Soc. London A 345, 5 (1975). 18 A. D. Sherry and E. Pascual, J. Am. Chem. Soc. 99, 5871 (1977). 19 j. Reuben and G. A. Elgavish, J. Am. Chem. Soc. 100, 3617 (1978).
46
PROBES OF METAL ION ENVIRONMENTS
[3]
Second, the various lanthanide ions and their complexes should have very similar chemical properties. Although their coordination numbers are high (most commonly 8 and 9), their radii exhibit the well-known lanthanide ion contraction. Consequently, there is variation along the series of hydration numbers of the lanthanide aqueous ions and coordination numbers, as well as in the thermodynamic and kinetic properties of their complexes. 11,15.20 Third, the replacement of the naturally occurring ion by the probe should be isomorphic. The fact that the ionic radii of the lanthanides are very similar to the ionic radius of Ca 2+ (0.99 ,~) has led to many studies in which the former have been used as isomorphic replacements for Ca 2+. 11.21 However, only in a few cases, like thermolysin, has perfect isomorphous replacement actually been shown to occur. 22 Fourth, the replacement of the naturally occurring ion by the probe in a biological macromolecule (e.g., a metalloenzyme) should also be functional. In this respect, besides structural similarities, kinetic and equilibrium complexation similarities are also very important. 11 Lanthanide ions have been demonstrated to be good substitutes for Ca 2+ in a-amylase and in the trypsinogen to trypsin conversion, and for Mg 2÷ in isoleucyltRNA synthetase [L-isoleucine: t-RNA ligase (AMP)] and adenylylated glutamine synthetase (L-glutamate: ammonia ligate)." However, lanthanides act as competitive inhibitors for the Ca 2+ enzymes staphylococcal nuclease and concanavalin A, and for the Mg 2+ enzymes pyruvate kinase and yeast inorganic pyrophosphatase.l~ The extra charge and affinity for higher coordination numbers of lanthanides relative to divalent cations (e.g., Mg 2+ and Ca 2+) could cause them to distort the metal ion coordination polyhedron enough to destroy the catalytic ability of an enzyme. Lanthanide ions also have faster rates of inner sphere substitution than Mg 2+. Systematic studies of the functional replacement of lanthanides for Ca 2+ in a number of physiological processes have shown that the differences between their responses are as important as their similarities. 11,23,24 In spite of these limitations, lanthanide ions afford extensive applications as spectroscopic probes of the structure of biochemical macromolecules, such as proteins and nucleic acids. 11'25 Lanthanide ions can be used as (1) heavy atom isomorphous replacement probes for electron microscopy and in X-ray studies22,26; (2) luminescence probes of the 20 G. R. Choppin, Pure Appl. Chem. 27, 23 (1971). 21 R. B. Martin and F. S. Richardson, Q. Rev. Biophys. 12, 181 (1979). 22 p. W. Colman, L. H. Weaver, and B. W. Mathews, Biochemistry 13, 1719 (1974). 23 K. J. Ellis, lnorg. Perspect. Biol. Med. 1, 101 (1977). 24 C. H. Evans, Trends Biol. Sci., 445 (1983). 25 C. F. Meares and T. G. Wenzel, Acc. Chem. Res. 17, 202 (1984). 26 G. Nagahashi, W. W. Thompson, and R. T. Leonard, Science 183, 670 (1974).
[3]
LANTHANIDE SHIFT REAGENTS
47
structure of proteins and nucleic acids, namely, with europium(III) and terbium(III), owing to the enhanced fluorescence of Tb 3+ when bound to certain calcium- or iron-containing proteins (by factors of 104-105) 1~,16,21,27; (3) absorption spectroscopy and circular dichroism probes, as a consequence of the high sensitivity of certain f - f transitions to lanthanide chelation by the macromolecule¢6'28; (4) electron spin resonance (ESR) spectroscopy probes, as the Gd(III) ion can be easily observed in solution at room temperatureS6'29; (5) nuclear spin relaxation enhancement probes, particularly using the Gd(III) ion (proton relaxation enhancement studies and relaxometry studies are well documented)l°'11'3°'31; and (6) chemical shift probes for NMR spectroscopy, for example, with paramagnetic ions such as Eu(III) or Yb(III). The latter is the main subject of this chapter. Paramagnetic cationic shift reagents, such as Dy(PPP)27- [dysprosium (III)-bis-tripolyphosphate], can be used together with 43Ca2+ NMR to resolve resonances of Ca z+ ions weakly and tightly bound to proteins, such as a-lactalbumin, intestinal Ca2+-binding protein (ICaBP), or calmodulin, by adding the shift reagent to a solution containing the protein with excess Ca2+. 32-34 The diamagnetic lanthanides lanthanum(Ill) and lutetium(Ill) (La 3+ and Lu 3+) have also been used in competition binding studies of Ca2+-binding proteins. 32 For example, Ca2+/La 3+ competition has been investigated in Ca 2+ saturated ICaBP, together with 43Ca NMR, and CdZ+/Lu 3+ competition was studied in Cd2+-saturated parvalbumin together with 133Cd N M R . 33'35 Basic Theory of Nuclear Magnetic Resonance Effects of Paramagnetic Lanthanide Ions
Effects of Chemical Exchange Let us consider in this discussion exchange between two sites only that occurs on formation of 1 : 1 complexes, that is, chemical exchange between the ligand in a free state and in a metal complex: 27 W. de W. Horrocks and D. R. Sudnick, Acc. Chem. Res. 14, 384 (1981). 28 D. M. Dooley and J. H. Dawson, Coord. Chem. Rev. 60, 1 (1984). 29 G. H. Reed, R. D. Hershberg, and G. H. de Haas, in " N M R in Biochemistry" (S. J. Opella and P. Lu, eds.), p. 357. Dekker, New York, 1979. 3o D. R. Burton, S. Fors6n, G. Karlstr6m, and R. A. Dwek, Prog. Nucl. Magn. Reson. Spectrosc. 13, 1 (1979). 31 S. H. Koenig and R. D. Brown III, Prog. Nucl. Magn. Reson. Spectrosc. 22, 487 (1990). 32 H. J. Vogel and S. Fors6n, in "Biological Magnetic Resonance" (L. J. Berliner and J. Reuben, eds.), Vol. 7, Chap. 4. Plenum, New York, 1987. 33 H. J. Vogel and W. H. Braunlin, J. Magn. Reson. 62, 42 (1985). 34 H. J. Vogel, T. Andersson, W. Braunlin, T. Drakenberg, and S. Fors6n, Biochem. Biophys. Res. Commun. 122, 1350 (1984). 35 T. Drakenberg, M. Sward, A. Cav6, and J. Parello, Biochem. J. 227, 711 (1985).
48
PROBES OF METAL ION ENVIRONMENTS
[3]
M + L . k°n " ML ko~
(1)
where M, L, and ML represent the ligand, the metal ion, and the complex, respectively, and ko. and koff are the rates of formation and dissociation of the complex. Let us also consider a ligand nucleus exchanging between the two sites with different lifetimes rM and ~'L, different fractional populations PM and PL, different chemical shifts 8M and 8L [in parts per million (ppm)] or toM and toL (in hertz), and different relaxation times TiM, T2M, and Tin, TEL, respectively. The effects of chemical exchange on the observed NMR parameters depend on the exchange conditions relative to the two limits defined by the NMR chemical shift time scale, 2zr(toM - t o L ) . 36-39 In the fast exchange limit 2rr(tou - toL)~'M~ 1, a population-averaged chemical shift, 8obs, is given by ~obs = PM~M + PLt~L
(2)
Under the dilute species approximation (PL >> PM) and neglecting outersphere effects, the observed spin-lattice relaxation rate 1/T~obs, can be a p p r o x i m a t e d by 37'39 1/Tlobs
=
I / T l L + PM/(T1M + '/'M)
(3)
or 1/TIP = PM/(TIM + "/'M)
(4)
where 1/Tlp = 1/Tlobs - I/T1L is the paramagnetic contribution to the spin-lattice relaxation time. For cations that produce negligible shifts [e.g., Gd(III)], the observed paramagnetic contribution to the spin-spin relaxation rate obeys a similar equation, 1/T2p = PM/(T2M + z M)
(5)
where 1/T2p = 1/T2obs- 1/T2L If 7"M > TIM , T2M , Eqs. (4) and (5) reduce to 1~Tip ~ pM/I-M 36 T. J. Swift and R. E. Connick, J. Chem. Phys. 37, 307 (1962). 37 Z. Luz and S. Meiboom, J. Chem. Phys. 40, 2686 (1964). 38 j. Reuben and D. Fiat, J. Chem. Phys. 51, 4918 (1969). 39 j. S. Leigh, Jr., J. Magn. Reson. 4, 308 (1971).
(6)
[31
LANTHANIDE SHIFT REAGENTS
49
for i equals 1, 2, and all the resonances of the complex will have equal paramagnetic relaxation parameters governed by 1/ru. In the case of the lanthanides which induce shifts, 1/T2obs = PL/T2L + PM/T2M + PM(1 -- pM)2'rM[2'n'(OJM -- OJL)] 2
(7)
where the third term results from the chemical shift difference. In the slow exchange limit, 2"n'(toM -- (.OL)7 M >~> 1, the flee and complexed sites yield separate resonances with intensities proportional to P L and P M , respectively. The relaxation rates at each site are then given by l/Tiobs L = 1/TiL + 1 / r L 1/Tiobs M = 1~TiM + 1 / r M
(8) (9)
f o r / = 1,2.
Chemical Shifts The chemical shift of the lanthanide complex (lanthanide-induced shift, LIS) is given by the sum of three contributions4°-43: A M = Acf + A d + A c
(10)
where Acf is the diamagnetic complex formation shift, Ad is the dipolar shift, and Ac is the contact shift. The value of Acf, which arises from electrostatic interactions or metal ion-induced ligand conformational changes, is usually estimated from the effects of La(III) and Lu(III) binding to the ligand and are assumed to be constant through the lanthanide series. The dipolar or pseudocontact shift, Ad , results from a through-space interaction between the electron and the nuclear magnetic dipoles. Twelve of the fourteen available trivalent lanthanide cations have at least one unpaired electron, and eleven of these [excluding Gd(III)] form complexes with magnetic susceptibility anisotropy resulting from ligand field effects, which remove the spherical symmetry around the metal ion. Thus, the value of the dipolar magnetic field induced by the anisotropic electron magnetic moment is not averaged to zero by the fast rotational tumbling of the complex in solution, and therefore a dipolar shift arises, given by 1
Ad = 4--~r3 F(O, cb)
(ll)
4o R. M. Golding and M. P. Halton, Aust. J. Chem. 25, 2577 (1972). 41 B. Bleaney, J. Magn. Reson. 8, 91 (1972). 42 j. Reuben and G. A. Elgavish, in "Handbook of the Physics and Chemistry of Rare Earths" (K. A. Gschneider, Jr., and L. Eyring, eds.), North Holland, New York, 1979. 43 I. Bertini and C. Luchinat, " N M R of Paramagnetic Molecules in Biological Systems." Benjamin Cummings, Menlo Park, California, 1986.
50
PROBES OF METAL ION ENVIRONMENTS
[3]
where r is the distance from the paramagnetic center to the observed nucleus and F is the angular factor: F = (Xzz - X)(3 cos 2 0 - 1) + (X~x - Xyy) Sin2 0 COS 2~b
(12)
In Eq. (12), X~ (as = x x , yy, zz) are the principal components of the magnetic susceptibility tensor, ~, of the complex, with average value = Xxx + Xyy + Xzz)/3, whereas 0 and ~bare the nucleus polar coordinates. When Xxx = Xyy (axial symmetry), - 5X) t"3 cos 2 0 - 1 ) Ad-- (Xzz 4---~r
(13)
Thus, the dipolar shift could be calculated from ~ tensor components, which are given by the van Vleck equation. 43 In the case of the lanthanide(III) cations, the ~ tensor of the ground electronic state characterized by the quantum number J, is, to first approximation, isotropic, X~ = gj2fl2j(j + 1 ) / 3 K T , where the constants gj, fl, K, and T have the usual meanings, and thus causes no dipolar shift. The anisotropy of :~, which results from the ligand electrostatic field, has been shown by Bleaney41 in the case of a singly populated ground state J to be given by Xaa = _[gj2fl2j(j + 1)(2J - 1)(2J + 3)/30(KT)2]Da
(14)
: <JIl llJ> (r2)(A 2 - A ° ) <JIl llJ> ( r 2 ) ( - A ~ - A °) Dz -- <J/[o ll (2A °)
(15a) (15b) (15c)
where
Dy
:
are the ligand field parameters, ( r 2) is the average value of r 2 for the 4 f electrons, (Jl[~llJ) is a numerical coefficient characteristic of the lanthanide, and A ° and A22 are two crystal field coefficients. Therefore, Ad is • dependent on T-2: Ad =_[gjZfl2j(j + l ) ( 2 J - 1 ) ( 2 J + 3)/60(KT)2]r-3F'
(16)
where F ' = Dz(3 cos 2 0
--
I)
at- ( O x -
Dr)sin 2 0 cos 2 ~b
(17)
Terms of the electrostatic potential higher than second order have negligible contributions. 44 44 B. R. McGarvey,
J. Magn. Reson. 33, 445 (1979).
[3]
51
LANTHANIDE SHIFT REAGENTS TABLE I THEORETICAL DIPOLAR (Cj) AND CONTACT ((Sz)) VALUES
Lanthanide
Cja
( Sz ) b
Cerium (Ce) Praseodymium (Pr) Neodymium (Nd)
-6.3 - 11.0 -4.2 -0.7 4.0 0.0 -86 - 100 -39 33 53 22
-0.98 -2.97 -4.49 0.06 10.68 31.50 31.82 28.55 22.63 15.37 8.21 2.59
Samarium (Sm) Europium (Eu) Gadolinium (Gd) Terbium (Tb) Dysprosium (Dy) Holmium (Ho) Erbium (EL) Thulium (Tm) Ytterbium (Yb)
Reprinted with permission from Ref. 41. b Reprinted with permission from Ref. 40.
The dipolar shift can be rewritten as Ad =
Cj[fl2(r2)2A°(3 c o s 2 0 - 1) + f12(r2)2A2 s i n 2 0 c o s 2cb]/60(KT)r 3 (18)
where Cj = g j 2 ( j + 1)(2J -
1)(2J + 3)
(Jllo~lJ)
(19)
The value of Cj for each lanthanide listed in Table I includes contributions from excited state J levels that are populated at room temperature for some of the ions, for example, Samarium(Ill) and Eu(III).41 The numerical coefficient (Jl[allJ) changes sign for several of the ions, and this correctly predicts why some lanthanides induce shifts to high frequency and others to low frequency. The two crystal field coefficients, A ° and A 2, can also change sign with differing ligand fields. For a series of isostructural lanthanide-ligand complexes, where the values of r, 0, ~b, and the crystal field coefficients are independent of the lanthanide, the measured dipolar shift for any nucleus in that series of complexes should be proportional to Bleaney's Cj values. Thus, the lanthanide-independent constants may be combined with the Cj values to give
Ad:Ol(cos2°-a)r3"2(sin20c°82')"
(20)
52
PROBES OF METAL ION ENVIRONMENTS
[3]
where D1 and D 2 are temperature-dependent constants that depend on the individual lanthanides. If D 2 equals 0, axial symmetry occurs and the measured dipolar shifts b e c o m e proportional to Dl(3 cos a 0 - l)/r 3. Axial s y m m e t r y can o c c u r in two different ways. The lanthanide complex may contain a 3-fold or higher s y m m e t r y axis in solution, or there can be effective axial s y m m e t r y resulting from either rapid internal rotation about the lanthanide-ligand bond 45 or rapid interconversion of the geometrical isomers of the complex. 46 Such fluxional behavior has been proposed for many systems whose solid-state structures indicate nonaxial symmetry, although the paramagnetic shifts appear to possess axial s y m m e t r y in solution. It has been argued that the validity of using the axial symmetry assumption can be tested by examining shifts for different lanthanide complexes. If LIS values for a given complex are measured for a series of shift reagents containing different lanthanides, a plot of the measured LIS values versus Bleaney's Cj values is linear if the origin of the shift is purely dipolar. H o w e v e r , it should be noted that such linearity is not a test for axial s y m m e t r y since both D~ and D E should be constant for isostructural complexes. Deviations from linearity indicate that either the measured LIS values are not purely dipolar or the assumption of isostructurality is not valid. It has also been proposed that the constancy of internal shift ratios for different lanthanide complexes can be taken to indicate that the measured LIS values are contact free and conform to dipolar axial symmetry. 47-49 In that case, these shift ratios could be used with some confidence to derive geometrical information about the lanthanide complex. We note parenthetically that the measured LIS values could contain a contact c o m p o n e n t while the shift ratio, if indeed constant, should not. F o r example, a contact contribution could be present in each measured shift in the same ratio as the measured shift ratios. 16 Inspection o f Eq. (18) also suggests that constancy of shift ratios along the lanthanide series is not an absolute criterion of axial symmetry. It rather indicates that the complexes are either axially symmetric or strictly isostructural (A ° and A~ are constant for the entire series). It also has been shown that if the nuclei 45j. M. Briggs, G. P. Moss, E. W. Randall, and K. D. Sales, J. Chem. Soc. Chem. Commun., 1180 (1972). 46W. de W. Horrocks Jr., J. Am. Chem. Soc. 96, 3024 (1974). 47C. D. Barry, J. A. Glasel, A. C. T. North, R. J. P. Williams, and A. V. Xavier, Nature (London) 232, 236 (1971). 48I. D. Campbell, C. M. Dobson, R. J. P. Williams, and A. V. Xavier, Ann. N.Y. Acad. Sci. 222, 163 (1973). 49I. D. Campbell, C. M. Dobson, and R. J. P. Williams, Proc. R. Soc. London A 345, 41 (1975).
[3]
LANTHANIDE SHIFT REAGENTS
53
are in a particular spatial arrangement relative to the principal magnetic axis system they may have constant shift ratios, even though there are significant contributions of the nonaxial term in Eq. (20). 5°'51 Therefore, although it is likely that many lanthanide complexes achieve effective axial symmetry by some averaging process (as discussed above), routine assumption of axial symmetry based solely on constancy of shift ratios should be used with extreme caution. The Fermi contact contribution to the LIS, Ac , is much less prevalent for complexes of the lanthanides than for those of the transition metal ions, as the orbitals used by lanthanides in bonding have very little 4 f character. If a small fraction of unpaired electron spin density is delocalized into the orbitals of a ligand atom, that spin density may become polarized through the ligand bonds and produce an additional magnetic field at the nucleus being examined in the NMR experiment. This spin polarization mechanism usually causes a decrease of the contact shift as the number of bonds from the ligating atom increases. The magnitude of the contact shift depends on the hyperfine coupling constant, A, between the electron and the nuclear magnetic moments and the spin expectation value, (Sz), for a particular lanthanide: Ac = (A/h)(Sz)/(yflo/2rr)
(21)
Considering a singly populated ground J level, with Zeeman splittings less than KT, 52 (Sz) J =
--flgj(gj
--
B0 1)J(J + 1) 3K----T
(22)
and Ac is proportional to T -1. Values of (Sz) have been tabulated by Golding and Halton 4° for each lanthanide, which include excited electronic states that are thermally populated at room temperature, [e.g., from Sm(III) and Eu(III)] (Table I). These values can be either negative or positive owing to the large orbital contribution to the determination of the energy levels of the lanthanide ions. Once contact shift contributions to measured LIS values have been identified, they must be separated from the potentially structurally useful dipolar contributions. The approach introduced by Dobson et al. 53 involves 50 T. D. Marinetti, G. H. Snyder, and B. D. Sykes, Biochemistry 15, 4600 (1976). 51 j. W. M. de Boer, P. J. D. Sakkers, C. W. Hilbers, and G. de Boer, J. Magn. Reson. 25, 455 (1972). 52 W. B. Lewis, J. A. Jackson, J. F. Lemons, and H. Taube, J. Chem. Phys. 36, 694 (1962). 53 C. M. Dobson, J. P. Williams, and A. V. Xavier, J. Chem. Soc., Dalton Trans., 2662 (1973).
54
PROBES OF METAL ION ENVIRONMENTS
[3]
calculating the ratio of the shifts for one nucleus that contains contact and dipolar components (Aa+~) versus another nucleus in the same molecule that has only a dipolar shift (Ad) and plotting the ratio Ad+c/Aaversus (Sz)/A d for a series of lanthanides. However, the most general separation method was introduced by Reilley et al.,54 which relies on use of both theoretical Cj and (S z) values to separate those components. The total observed isotropic shift for a nucleus (after correcting for Acf effects) may be expressed as (23)
Aob s = A d + A c
Substituting reduced forms of Eqs. (18) and (21) into Eq. (23) gives Aobs = GCj + F(Sz)
(24)
where G is the complex geometrical term in Eq. (18) and F contains the hyperfine coupling constants and the remaining constants in Eq. (21). Equation (24) may be rearranged into two linear forms: (25a) (25b)
Aobs/(S z) = G ( q / ( S z ) ) + F Aobs/Cj = G + F((Sz)/C )
Equation (25a) should be used in linear regression analysis when AobS is dominated by dipolar shifts (calculated G / F >> 1) and Eq. (25b) when Aobs is dominated by contact effects (calculated G / F ~ 1). 54 Relaxation Rates
For paramagnetic lanthanide ions, the dipolar contribution to the nuclear relaxation rates (the contact contribution is usually negligible) can be expressed by the following terms of the Solomon-Bloembergen equations 10,55. 1 _ 2 yi2gjZJ(J + 1)/32 (
TIM
15
r6
3z¢ + 7r¢ ] \ 1 + O.)I2Tc2 1 + OksZTc2/
1 _ 1 "yi2gj2j(j + 1)/3 2 ( T2M
15
r6
3r c 4rc
+ 1 d'- ¢.OI2Tc2
~_ 13r~ '~ 1 + (.Os2Tc2/
(26) (27)
where the constants, YI, gi, J, and/3, have the usual meaning, to~ is the nuclear Larmor frequency, tos ~ 660toi, and rc is given by
1_!+I
1
"r~ zR
~-~l +--zi
54 C. N. Reilley, B. W. Good, and R. D. Allendoerfer, Anal. Chem. 48, 1446 (1976). 55 j. Reuben and D. Fiat, J. Chem. Phys. 51, 4918 (1969).
(28)
[3]
LANTHANIDE SHIFT REAGENTS
55
where TR is the rotational correlation time of the complex, Tie is the electron spin relaxation time, and ZM is the lifetime of the complex. When extreme narrowing conditions occur, tOsZc ~ 1, and l T1M
1 T2M
Cr-6Zc
(29)
where C = (4/3)ylZgj2j(j + 1)/32. Equation (29) can be used, under appropriate conditions, to obtain absolute values of the metal-to-nucleus distance r by specifying the values of zc . Data on the kinetics of lanthanide complex formation43 indicate that "rMexceeds 10 -7 sec. In the case of Gd(III), electron spin relaxation times Tie are rather long and can be estimated by using literature values for Tie obtained by EPR signal line widths and the frequency dependence of Tie1°:
1/Tje = Drv/(l + /360s2"rv2)
(30)
where "rv is the correlation time reflecting the rate at which solvent collisions modulate the zero-field splitting and/3 and D are constants for the particular spin system. At high fields (toH > 200 MHz), Tie is greater than or equal to 2 × 10 7 sec. Therefore, for proteins with rotational correlation times "rR no greater than 10-8 sec, the correlation time "rc of Eq. (28) is dominated by "rR, which can be obtained, for example, from analysis of protein ~3C relaxation times. Using this value in Eq. (29) leads to calculation of absolute Gd(III) nuclear distances from the analysis of Gd(III)induced relaxation enhancements. For the non-S-state lanthanides which have short Tie values ( ' ( 1 0 -12 sec), 56 "re is dominated by TI~ and very little nuclear paramagnetic relaxation occurs. Information on trends in T~ for a range of lanthanides have been obtained from T~ values of protons of lanthanide complexes with small ligands or proteins as a function of the effective magnetic moment of the c o m p l e x , 42,57 using Eq. (29). However, the non-S-state lanthanides have an additional nuclear relaxation mechanism, referred to as the Curie spin or magnetic susceptibility relaxation term. 58 This results from the interaction of the nuclear spins with the static magnetic moment related to (Sz) [see Eq. (22)], which is modulated by "re (but not by T~e): 16~/2/3o2gj4/34j2(J+l)2("rR) TlM× -- 5 (3KT)Zr 6 1 + ¢.,Ol2"rR2
(31)
56 B. M. Alsaadi, F. J. C. Rossotti, and R. J. P. Williams, J. Chem. Soc., Dalton Trans., 2147 (1980). s7 p. D. Burns and G. N. LaMar, J. Magn. Reson. 46, 61 (1982). 58 M. Gueron, J. Magn. Reson. 19, 58 (1975); A. J. Vega and D. Fiat, Mol. Phys. 31, 347 (1976).
56
PROBES OF METAL ION ENVIRONMENTS
1
1 "y2flo2gj4fl4j2(j + 1)2 (4rR + 3¢R (3KT)2r 6 _ 1 + £012TR2]
TZM× -- 5
[3]
(32)
where the subscript X refers to this term. The relative importance of this term increases with the square of the magnetic field. Lanthanide-induced shift and relaxation rate perturbations have been used to determine the conformations of molecules in solution. 14The relevant geometrical parameters in Eqs. (20) and (29) must be averaged by the fast molecular motions that take place in solution before fitting the observed perturbations to a structure or set of structures. Lanthanide-Induced Shift Studies of Biological Macromolecules Application of the LIS method to probe the aqueous structure of biological macromolecules has not developed as rapidly as for small molecules, mainly because of the experimental difficulties involved in such studies, such as poor spectral resolution, lack of resonance assignments, and multiple lanthanide ion binding sites. Although some LIS studies have been reported for tRNA, 59 most have been limited to low molecular weight proteins containing one or more selective lanthanide binding sites. Lanthanide ions are known to bind in normal Ca 2÷ binding sites on proteins, such as the amylases, thermolysin, calmodulin, or parvalbumin, or they may simply happen to occupy a relatively selective site where two or more carboxyl group side chains congregate, such as in concanavalin A or lysozyme. The Ln3+-ATP complexes have also been used as a substitute for Mg2+-ATP in kinases. 6° It is advantageous if the substitution of a Ln 3÷ for Ca 2÷ or Mg 2÷ is isomorphous and the system retains its normal activity, so that the information gained from LIS studies may be useful in understanding biological structure/function relationships. In practice, this has often not been observed; indeed, it has been suggested2~ that if a Ln3+-substituted protein is active, the Ca 2÷ (or Mg 2÷) plays a structural role, but if it is inactive, the ion has a catalytic role. We now describe a few typical applications of LIS studies to proteins. Mapping Active Site o f Nonmetalloenzyme: The Case o f Lysozyme
Hen egg white lysozyme is a small enzyme, having a single polypeptide chain of 129 amino acid residues and a molecular mass of approximately 14400 Da, that catalyzes the hydrolysis of fl-l,4-glycosidic linkages between residues in the polysaccharide components of bacterial cell walls. 59 C. R. J o n e s a n d D. R. K e a r n s , Proc. Natl. Acad. Sci. U.S.A. 71, 4237 (1974). 6o p. Transwell, E. W. W e s t h e a d , a n d R. J. P. Williams, FEBS Lett. 48, 60 (1974).
[3]
LANTHANIDE SHIFT REAGENTS
57
Trp 62
Tvr53
Thr
51
•
56 ~
Trp ~...-.~Ala 107
350 f" ~..~, Ala I10
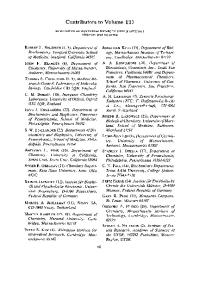
FIG. 1. Schematic illustration of the active site region of lysozyme as determined by X-ray crystallography. (Reprinted with permission from Ref. 2.)
Its X-ray crystal structure has been determined to a resolution of 2.5 A, 61'62 the first enzyme to yield such an atomic resolution structure. It was also a very early test example for NMR lanthanide shift reagent applications by the Oxford enzyme g r o u p . 2'48'49 Lysozyme has no known metal ion requirements and binds lanthanide ions in solution only weakly (Kassoc ~ 103 M-l), with the primary site located in the enzyme active site near the catalytically active side-chain carboxyl groups of Glu-35 and Asp-52 (Fig. 1). 2'48'49 In solution, some other very weak (Kassoc -< 10 M -l) binding sites have been detected, resulting from binding to surfaceexposed carboxylic acid groups, but only the NMR effects arising from the strong binding site can be measured. 63Although the enzyme is inhibited by the lanthanide binding, the conformational perturbations resulting from this binding are small and confined to the immediate vicinity of the metal binding site, as implied by solution NMR studies 49'63 and finally shown by X-ray studies of the Gd(III)-lysozyme complex. 64 The ortho protons of Tyr-53 shift on addition of increasing amounts of a paramagnetic lanthanide other than Gd(III), so fast exchange conditions apply and the LIS values for various lanthanides were proportional to 61 C. C. F. Blake, L. N. Johnson, G. A. Mair, A. C. T. North, D. C. Phillips, and V. R. Sarma, Proc. R. Soc. L o n d o n B 167, 378 (1967). 62 T. Imoto, L. N. Johnson, A. C. T. North, D. C. Phillips, and J. A. Rupley, in "The Enzymes" (P. D. Boyer, ed.), 3rd Ed., Vol. 3, p. 666. Academic Press, New York, 1972. 63 C. M. Dobson and R. J. P. Williams, in "Metal-Ligand Interactions in Organic Chemistry and Biochemistry" (B. Pullman and N. Goldblum, eds.), Part 1, p. 255. Reidel, Dordrecht, The Netherlands, 1977. 64 K. Kurachi, L. C. Sieker, and L. H. Jensen, J. Biol. Chem. 250, 7663 (1975).
58
PROBES OF METAL ION ENVIRONMENTS
[3]
Bleaney's Cj values (Table 1). 49 Although several proton resonances shift when a lanthanide is titrated into the protein, many could not be resolved because of overlap with other unshifted resonances in the spectra, a frequent problem with protein spectra, particularly in the early studies at 270 MHz proton frequency. Campbell e t a t . 48'65 introduced an ingenious solution to this problem by adding incremental amounts of Gd 3+ and generating an NMR difference spectrum after each addition. Because Gd 3+ induces line broadening only in those resonances nearest the lanthanide binding site, the resonances that appear in each new difference spectrum reflect nuclei further removed from the Gd 3+ binding site. Ions that produce a paramagnetic shift are then added in combination with Gd 3+ to obtain LIS values (Fig. 2) for a number of resonances near the lanthanide binding region which could not normally be resolved. Some of the reported 49 LIS values and relaxation rate enhancements of a number of CH resonances of hen egg white lysozyme induced by the binding of various paramagnetic lanthanides are summarized in Table II. A semiquantitative comparison of the structure of the protein in solution and in the crystal was then attempted. As the relative relaxation of resonances induced by Gd 3+ is simply proportional to the relative values of 1/r 6 for the different nuclei [see Eq. (29)], where r is the distance between the bound lanthanide and the nucleus in question, a plot of observed relative distances against the calculated relative distances from the X-ray structure can be made 49 (see Fig. 3A). Allowance has been made for rotation of methyl groups and for flipping of tyrosine residues. The correlation of the NMR data with the X-ray structure is generally good, except for the Val-109 resonances and also for the resonances at longer distances (r -> 14 ,~), where the relaxation from the major binding site is small and difficult to measure, and where relaxation from the weaker binding sites is more important. The proton resonances were assigned to specific amino acid protons in the primary sequence of the enzyme using a comparison of experimental NMR data and the X-ray crystal structure. The LIS values induced by the other paramagnetic lanthanides are proportional to 1/r 3 and to functions related to angles made between the vector joining the metal to the nucleus and the axis of magnetic susceptibility determined by the ligand field effects, and which depend on its symmetry. As this symmetry cannot be determined directly, Eq. (20) with D 2 ~ 0 or D 2 = 0, corresponding, respectively, to rhombic and axial symmetry, could be used to fit the experimental LIS data. It was considered by the authors 49 (see Table II for some of the data) that the observed LIS ratios were reasonably independent of the nature of lanthanide (with the notable 65 I. D. Campbell, C. M. Dobson, and R. J. P. Williams, J. Magn. Reson. 11, 172 (1973).
[3]
59
LANTHANIDE SHIFT REAGENTS
Lysozyme (5 mM) +Eu (111)(3.3 mM)
'\\ i
Lysozyme(5 raM) w I!
Lysozyme(5 raM) + Pr(lll) (10 mM) I
2
I
1
I
0
~/ppm FIG. 2. G d 3÷ differencespectra of the methyl region of lysozymein the absence and presence of shift probes. (Reprintedwith permissionfrom Ref. 48.) exception of Tm3+), suggesting that the shifts may be described by the axial symmetry equation [Eq. (20), with D2 = 0]. Given the coordinates of the assigned nuclei and the metal ion binding site from the crystal structure, the ratios of (3 cos 2 0 - 1)/r 3 for each nucleus were calculated for all possible directions of the magnetic symmetry axis (which defines 0). For a very limited range of directions, the observed and calculated ratios were found to be close (see Table II and Fig. 3B). The agreement for many resonances was found to be excellent, indicating general accord between the crystal structure of lysozyme and the solution structure as determined by the LIS method; moreover, it shows that the conformation of the enzyme near the metal binding site (also the active site) is unique and well defined. However, the assumption of axial symmetry of the LIS values and therefore the possibility of obtaining a more detailed structure of the
60
PROBES O F M E T A L I O N E N V I R O N M E N T S
[3]
T A B L E II PROTON S H I F T AND RELAXATION DATA FOR LANTHANIDE(III) IONS IN H E N EGG WHITE LYSOZYME a
Shift ratios G d 3+
Observed Resonance
Observed broadening ratio
r b (/~)
P r 3+
N d 3+
Calculated
V a l - 1 0 9 CZdH3 V a l - 1 0 9 C~2H3 Ala-110 CH 3 T r p - 108 CVH Trp-108 NH Ala-31 CH 3 Thr-51 CH 3 o-Tyr-53 m-Tyr-53 L e u - 5 6 CvlH3 L e u - 5 6 C~'2H3 I1e-98 CY2H3 Met-105 CH 3 Met-12 CH3 L e u - 1 7 C~IH3 L e u - 1 7 C~2H3 o-Tyr-20 o-Tyr-23 T r p - 6 3 CVH Ala-107
2300 2300 1750 1200 -163 140 100 100 95 95 75 35 25 25 25 -----
8.81 6.02 6.26 6.87 -10.44 9.61 10.90 9.87 11.85 9.60 13.3 12.6 14.7 17.2 15.8 -----
73 - 109 59 -117 -45 -151 100 160 0 -9 -32 - 14 -2 --0 - 14 53 -68
-110 -380 64 -55 --69 100 100 -12 --11 5 7 12 ------
65 175 -80 -137 -21 -lll 100 144 - 1 - 19 -23 -25 -6 ---3 - 10 42 -49
Reprinted with permission from R e f . 49. b Crystal structure.
a
protein in solution are much more doubtful. Some differences in shift ratios were indeed observed for the different lanthanides (see Table II), indicating that the assumption of axial symmetry is not strictly correct. In fact, Agresti e t al. 66 have reanalyzed the LIS data and statistically tested the validity of such an assumption. Both Nd 3÷ and C e 3÷ w e r e found to exhibit considerable nonaxial contributions to the dipolar LIS values. The assumption of axial symmetry was statistically rejected with 97.5% confidence. Lenkinski e t al. 67 also rejected the assumption of axial symmetry for the LIS shifts observed for the Co 2÷ derivative of lysozyme. Using the shift perturbations produced by Co 2÷ and the broadenings induced by 66 D . G . A g r e s t i , R . E . L e n k i n s k i , a n d J. D . G l i c k s o n , B i o c h e m . B i o p h y s . R e s . Commun. 76, 711 (1977). 67 R . E . L e n k i n s k i , D . G . A g r e s t i , D . M . Chen, and J. D . Glickson, Biochemistry 17, 1463 (1978).
[3]
LANTHANIDE SHIFT REAGENTS
61
A 1.0
I 0 0.5
Oo
i
!
i
i
i
i
i
Ii1.01
= I
Calculated PP" Shift Ratios
B "0
/
o o 1.0
J I
I
-1.0
/~
I
A
i
Observed |
I
1.0
o
.0
FIG. 3. Correlation of calculated and observed (A) relative distances from the Gd 3+ ion in lysozyme and (B) relative shifts induced by the Pr 3+ ion in lysozyme. (Reprinted with permission from Ref. 48.)
Gd 3+, the assignment of the signals from the indole N H protons of the tryptophan residues in lysozyme were cross-checked by using both metals, in association with the crystal structure. 68 ~3C NMR spectroscopy was also used to investigate the effect of chemical modification of Trp-108 on 68 R. E. Lenkinski, J. L. Dallas, and J. D. Glikson, J. Am. Chem, Soc. 101, 3071 (1979).
62
PROBES OF METAL ION ENVIRONMENTS
[3]
the binding of lanthanide ions, which is weakened by a factor of more than 20. 69 Weak and less specific binding of lanthanide ions was also observed to the surface of various enzymes, such as glyceraldehyde-3-phosphate dehydrogenase, 7° horse ferricytochrome c, 71 and basic pancreatic trypsin inhibitor (BPTI). 72 The observed shifts were used to help assignments, a task of less importance now with the present high-field instruments and multidimensional techniques. For proteins that lack a single, well-defined lanthanide binding site, formation of a specific nitrotyrosine derivative by chemical modification was proposed as a binding site for lanthanides as protein NMR structural probes. 73 This approach was successfully applied to a study of the Gd 3+induced proton relaxation effects of dinitro-BPTI, where Gd 3+ interacts with nitrotyrosine-21.74 However, the interpretation of the Pr 3+- and Eu 3÷induced LIS values was found to be complex, owing to the presence of nonaxial symmetry contributions. 75 The general applicability of this approach has also not been demonstrated.
Probing Active Site of Mg2+-ATP-Dependent Phosphoglycerate Kinase Yeast 3-phosphoglycerate kinase (PGK), a glycolytic enzyme that catalyzes the reversible phosphorylation of 3-phosphoglycerate (PGA) by ATP, is a monomer with a molecular mass about 45 kDa. Its schematic high-resolution X-ray crystal structure 76'77 (see Fig. 4) shows that the polypeptide chain is organized into two structurally independent domains that are joined by a short helical hinge composed of two chains. More than 50% of the residues are organized in two large/3 sheets that, between them, contain 14 strands (A-N) and 13 a helices (I-XIII). The catalytic mode of Mg2÷-ATP (or Mg2+-ADP) binding to PGK, illustrated in Fig. 4, is to the C-terminal domain, where a hydrophobic depression binds the adenine group. The phosphate chain of the cofactor points away from the C-terminal domain toward the N-terminal domain. The active site of the 69 K. Dill and A. Allerhand, Biochemistry 16, 5711 (1977). 7o R. A. Dwek, H. R. Levy, G. K. Radda, and P. J. Seeley, Biochim. Biophys. Acta 377, 26 (1975). 71 C. M. Dobson, G. R. Moore, and R. J. P. Williams, FEBS Lett. 51, 60 (1975). 72 S. J. Perkins and K. Wiithrich, Biochim. Biophys. Acta 536, 406 (1978). 73 T. D. Marinetti, G. H. Snyder, and B. D. Sykes, J. Am. Chem. Soc. 97, 6562 (1975). 74 T. D. Marinetti, G. H. Snyder, and B. D. Sykes, Biochemistry 15, 4600 (1976). 75 T. O. Marinetti, G. H. Snyder, and B. D. Sykes, Biochemistry 16, 647 (1977). 76 R. D. Banks, C. C. F. Blake, P. R. Evans, R. Haser, D. W. Rice, G. W. Handy, M. Merrett, and A. W. Philips, Nature (London) 279, 773 (1979). 77 H. C. Watson and N. P. C. Walter, EMBO J. 1, 1635 (1982).
[3]
~ / ~
LANTHANIDE SHIFT REAGENTS
63
M2° g
leu
FIG. 4. Schematic drawing of the active-site cleft of PGK as determined from X-ray crystallography. The a-helical segments are denoted by cylinders and the/3-sheet strands by arrows. The residues associated with the basic-patch region of the N-terminal domain (His-62, His-167, and His-170 and Arg-38, Arg-65, and Arg-168) are also shown. Inset shows the bound substrates Mg2+-ATP and PGA. (Reprinted with permission from Refs. 76 and 77.)
enzyme is probably divided between the two domains, with the C-domain carrying the cofactor and the N-domain the PGA substrate and the catalytic site. Nucleotide binding to PGK in solution has been studied using and proton 6°'8°-82 NMR techniques. Conformational changes were moni-
31p78,79
78 B. D. Nageswara Rao, M. Cohn, and R. K. Scopes, J. Biol. Chem. 253, 8056 (1978). 79 B. D. Ray and B. D. Nageswara Rao, Biochemistry 27, 5574 (1988). 80 W. J. Fairbrother, D. Bowen, L. Hall, and R. J. P. Williams, Eur. J. Biochem. 184, 617 (1989). 81 W. J. Fairbrother, H. C. Graham, and R. J. P. Williams, Eur. J. Biochem. 190, 161 and 407 (1990).
64
PROBES OF METAL ION ENVIRONMENTS
[3]
toted on binding of ATP and ADP both with and without Mg 2÷. These studies clearly show the presence of two ATP binding sites on PGK. Its primary binding site involves electrostatic interactions between the nucleotide triphosphate chain and arginines in the basic-patch region (located in the N-domain, see Fig. 4), identified as the general anion binding site. The PGA substrate binds close to Arg-168. As the Mg 2÷ concentration is increased relative to ATP, hydrophobic binding of the adenosine moiety of ATP occurs to PGK at a secondary site, which is equivalent to the catalytic site at the C-domain observed by X-ray crystal studies. The affinity of the catalytic site is increased relative to the primary electrostatic site with increasing Mg 2÷ concentration. Binding to the catalytic site causes a conformational change of His-167. These conclusions are consistent with a kinetic study 83 which has shown ATP 4- to be an activator of PGK at low concentrations and an inhibitor at higher concentrations. The inhibition was shown to be competitive with respect to both substrates (MgE+-ATP and PGA). The activating site is the PGA binding site. A kinetic and proton NMR study 6° at neutral pH showed that MgZ÷-ATP has an apparent K m that is dependent on the PGA concentration ( K m = 0.073 mM at [PGA] = 5 mM) and that L n a + - A T P (Ln = La, Eu, Pr, and Yb) is a competitive inhibitor of PGK, with apparent KI = 0.04 raM. Mg2+-ATP binds at the catalytic site with Kd = 0.15 mM, whereas La3+-ATP shows much tighter binding at the same site. These observations validate the use of Ln3+-ATP complexes as shift and relaxation probes of the resonances of nuclei in the active site region of PGK, and of other ATP phosphotransferases. In fact, data from this technique have been obtained that enabled the mapping of the geometry of the metal/ ATP/PGK active site complex, s3-85 Using paramagnetic difference spectroscopy, the line-broadening inhibitor Gd3+-ATP and the substrate Mn2+-ATP were found to induce identical perturbation of the enzyme resonances, a4,85 These perturbations are quite specific, corresponding to various residues located at the basic patch of the N-domain [His-62 (peak 3 in Fig 5A), His-167 (peaks 4, 15), His-170 (peak 5)] and others located near the ATP binding site at the C-domain [Tyr-193 (peak 14) and Phe-342 (peak 12)] (see Fig. 4 for the residue locations and Fig. 5A for the spectrum and signal numberings). The effects of the shift probes Ln3+-ATP (Ln = Pr, Eu 3+) (see Fig. 6) are in agreement with the broadening data: the largest LIS values are 82 M. Larsson-Raznikiewicz and R. Schierbeck, Biochim. Biophys. Acta 481, 283 (1977). s3 p. Tanswell, E. W. Westhead, and R. J. P. Williams, Biochem. Soc. Trans. 1, 79 (1974). 84 p. Tanswell, E. W. Westhead, and R. J. P. Williams, Ear. J. Biochem. 63,,249 (1976). 85 H. R. Wilson, R. J. P. Williams, J. A. Littlechild, and H. C. Watson, Ear. J. Biochem. 170, 529 (1988).
[3]
65
LANTHANIDE SHIFT REAGENTS A
H-2
H-all 34 5
110
I
9
I
H-I'
I
I
8 7 6 Chemical Shift (ppm)
B 3
I
I
I
7 6 Chemical Shift (ppm)
5
C
His 62 I,t'tis1~
9.0
8.0
His His
7.0
6.0
Chemical Shift (ppm)
FIG.5. Paramagneticdifferencespectraofthe PGKaromaticprotonregionin the presence of (A) 20 g,MGd3+-ATP;(B) 40/xMGd3+-P2; (C) 2/~M[Cr(CN)6]3-. (Adaptedwith permission from Refs. 81 and 84.)
observed for His-167 and (opposite sign) His-62 and His-170. The broadening probe Gd3+-P2 (P2 = pyrophosphate) (see Fig. 5B), and the corresponding shift probe Eu3+-P2, cause very similar effects to the Lna+-ATP chelates, 84 whereas the anionic broadening probe [Cr(CN)6] 3- (Fig. 5C) and the corresponding shift probe [Fe(CN)6] 3- affect only the histidine residues in the basic patch region of the N-domain. 81 This binding site
66
PROBES OF M E T A L ION E N V I R O N M E N T S -50
[3]
-
-4O -30 ~" -1-
-20
.=,-2_ -10
09
i
,
I
i
I
I
I
I
I
~
I
1.0
ao 20
ss
S
lO [Pr • ATP]/[enzyme] (mol/mol) |
'
I
I
I
0.5
I
I
I
I
110
-10' -20 -30 -401 FIG. 6. LIS for PGK histidine resonances as a functionof the concentrationof the shift probes Eua+-ATP and pr3+-ATP. (©) His-62; (0) His-167; (I) His-170. (Adapted with permission from Ref. 84.) corresponds to the general anionic site for PGK, made up of a cluster of positively charged side chains of His-62, His-167, His-170, Arg-21, Arg65, and Arg-168. 81 The broadening and shift effects produced by the Ln3+-ATP probes were then used to map geometrically the enzyme active site, including the conformation of the ATP, the position of various enzyme side-chain residues, and an approximate position for the substrate PGA 84 (Fig. 7). Because the X-ray structure (Fig. 4) indicates that the basic-patch histidine residues are at least 12 ,~ from the ATP binding site, it follows from the above observations that the enzyme as seen by NMR must differ from that seen in crystals. The observed proximity of the two binding sites in the two domains supports a hinge-bending movement hypothesis postulated to explain the catalytic mechanism of this enzyme, 76 whereby the open or substrate-binding form with the two domains apart transforms into the closed and catalytically active form, where the active site cleft and the
[3]
LANTHAN1DE SHIFT REAGENTS
67
site of the transferable phosphate group come into close proximity. Thus, this example illustrates the utility of selective paramagnetic perturbations even for a large protein.
Studies of Ca2+-Binding Proteins: Parvalbumin Another protein that has been studied extensively using the LIS method illustrates a much more complex yet potentially more informative situation. This is the work of Lee and Sykes 86'87 on the CaZ+-binding muscle protein parvalbumin. This protein, having a molecular mass around 11 kDa and a known X-ray crystal structure,88 binds 2 equivalents of Ca z+ in two distinct binding domains called the "CD and EF hands." Each of these consists of a short a-helical structure, a loop around the Ca 2+ site which contains regularly spaced carboxyl, carbonyl, and hydroxyl sidechain ligands for the metal ion, followed by a second a-helical region. Unlike lysozyme, these binding domains have a very high affinity for Ca z+ (Kd -~ 10-9 M) and an even higher affinity for the Ln 3+ cations. It has been shown that the CD domain has a significantly higher affinity for the larger Ln 3+ ions, whereas the EF domain is less selective [e.g., for Yb 3+, K d ~ (4-7) × 10-l° M for CD, K d ~- (2-6) × 10-l° M for EF]. This fact allows, in the presence of Ca z+ and given the preference of Ca z+ for the CD site, preferential loading of the EF site by the smaller ion, Yb 3+ (paramagnetic) or Lu 3+ (diamagnetic), at low Ln 3+/protein ratios, followed by loading of the other site at a higher ratio. The NMR spectra shown in Fig. 8 illustrate the complexity of this LIS study, as compared to the lysozyme study. As incremental amounts of Yb 3÷ are titrated into the protein, several proton resonances disappear from their diamagnetic positions and several new resonances appear both upfield and downfield from their normal diamagnetic positions, between - 2 0 and +36 ppm. Some resonances result from Yb 3+ binding in the EF site, whereas others arise as a result of Yb 3÷ binding in the CD site, in a sequential loading scheme (Fig. 9). This is typical of a slow-exchange situation and is more difficult to interpret since the correspondence between the diamagnetic and paramagnetic resonances is not known. The first problem is then the proper assignment of the many shifted resonances observed. The approach taken by Lee and Sykes was to measure the paramagnetic shifts and broadenings induced by Yb 3+ binding in the proton NMR spectrum and to use the known X-ray structure of the 86 L. Lee and B. D. Sykes, Biochemistry 19, 3208 (1980); L. Lee and B. D. Sykes, Biochemistry 211, 1156 (1981); L. Lee and B. D. Sykes, Biochemistry 22, 4366 (1983). 87 T. C. Williams, D. C. Corson, and B. D. Sykes, J. Am. Chem. Soc. 106, 5698 (1984). 88 R. H. Kretsinger and C. E. Nuckolds, J. Biol. Chem. 248, 3313 (1973).
68
PROBES OF METAL ION ENVIRONMENTS \
[3]
/ \
/ \
®~,®"
/
~-~
@,,, @
\
/ \
/ \
/
@ --(+)-,, -
~
5'
~--
,43'
\
2'
', @
/
\
•
2 (--)
± +
@ T "'~
@
J" j.
j. f j f J@ J
(--)
2'
(J~)~/[ " "
.,.
,. " "
(--)
%,
",
® 0"(~.. %.
@ J. +.L I
~-J
[3]
LANTHANIDE SHIFT REAGENTS
69
protein to determine the unknown parameters required to interpret those effects in terms of the structure of the protein. First, the line broadening effects of the shifted proton resonances were analyzed as a method for the determination of metal-proton distances in the EF site of parvalbumin. 87 The spin-lattice relaxation times and the line widths of several peaks of the NMR spectrum for a yb3+/protein ratio of 0.8 (Fig. 8C) were measured at three different frequencies namely, 200,270, and 400 MHz. Plots of those line widths as a function of the square of the frequency, o~2, were found to be linear. From Eqs. (26), (27), (31), and (32), it is clear that only the susceptibility relaxation term is field dependent. Thus, the intercepts of those plots gave the contribution to the line width governed by the nonsusceptibility contribution, which probably arises from proton dipole-dispole interactions in the protein. For toi2 ~ 0, Lee and Sykes, using relevant values for the constants of Eqs. (27) and (32), showed that for the yb3+-parvalbumin complex at 270 MHz (1/Tzx)/(1/T2s) ~ 16, and thus the susceptibility relaxation term dominates the normal Solomon term. It was similarly shown that the T~ values of the resonances are dominated by the electronic dipolar relaxation mechanism. The metal-proton distances given in Table III were obtained by calculating the susceptibility contribution to the line width, (1/T2x), and analyzing them in terms of Eq. (32), using relevant constants. These distances are therefore an aid to the assignment of the shifted resonances, by comparison of the experimental distances with those calculated from the crystal structure of the protein. The analysis of the dipolar shifts poses a second problem, related to locating the direction and magnitude of the magnetic susceptibility tensors, which define the values of D~ and D2 in Eq. (20). Axial symmetry could not be assumed, as LIS data were available only for Yb 3÷. LIS data for other ions could perhaps have been obtained, but, as indicated above, the selectivity of the EF site over the CD site changes with increasing cation size, and this precludes taking LIS measurements with a sufficient number of other Ln 3÷ ions to test for axial symmetry. Thus, the analysis of the LIS values requires the specification of eight parameters in Eq. (20): three coordinates for the metal ion, three Euler angles that relate the principal symmetry axis of the magnetic susceptibility tensor of Yb 3÷
FIG. 7. Schematic of the active site of PGK showing the relative coordination of the enzyme and ATP protons to the lanthanide (designated M). The protons are located spatially on the basis of the NMR data. The dashed lines represent the dipolar cone of the LIS, and the plus signs (+) define the symmetry axis (PGA, 3-phosphoglycerate; 3, His-62; 4, 15, His-167; 5, His-170; 12, Phe-342; 14, Tyr-193). (Adapted with permission from Ref. 84.)
70
PROBES OF METAL ION ENVIRONMENTS
[3]
A
B
|
30
1
i
i
i
18
J
i
6
i
i
-6
i
- 18
1
|
-30
ppm 8
c
35
30
25
20
15
10
54 55 59 53 ~7 ^
15~2I g ~ -~
30
s2
-;s
-~o
ppm Fro. 8. Proton spectrum (270 MHz) of (A) CaZ+-saturated carp parvalbumin and (B) parva]bumin with 0.8 equivalents of yb3÷; (C) shows spectrum (B) with numbered resonances. [Adapted with permission from L. Lee and B. D. Sykes, Biochemistry 20, 1156
0981). Copyright 1981 American Chemical Society.]
[3]
LANTHANIDE SHIFT REAGENTS
71
2.0 1.4
0.6 ~ ~J~] 34 30 26 22 18 14 & ppm
8ootB ILl
600I
rr
400! 2O0
m
2 3 4 YbJPo F ~ . 9. (A) Proton spectrum (270 MHz) of carp parvalbumin (positive shift portion) at Yb3*/protein ratios of 0.6, 1.1, 1.4, and 2.0. (B) Areas of three different resonances as a function of Yb3+/protein ratio (&, peak 3; Ira, peak 8; Q, peak next to 8, see Fig. 8C). [Adapted with permission from L. Lee and B. D. Sykes, Biochemistry 20, 1156 (1981). Copyright 1981 American Chemical Society.]
to the axis system of the crystal, and Dl and D z . The coordinates obtained by X-ray crystallography for Ca2+ in the EF site of parvalbumin were taken as the coordinates for Yb 3÷. Only five of the shifted resonances (three proton, one l~3Cd, and one 13C) could be assigned with certainty,
72
PROBES OF METAL ION ENVIRONMENTS
[3]
T A B L E III SUSCEPTIBILITY CONTRIBUTION TO SPIN--SPIN RELAXATION OF PROTON N M R RESONANCES OF yb3+-PARVALBUMIN AND MEASURED METAL-PROTON DISTANCES a
Resonance b
Measured r (,~)
1/T2x (sec -I)
3 4 5 6 7 8 10 51 56 61 65 66
5.8 5.9 6.2 6.5 6.2 7.9 8.8 7.7 6.2 7.0 6.6 5.6
141 139 102 78 101 24 12 26 102 46 67 179
Reprinted with permission from Ref. 86. Spectroscopy conducted at 270 MHz. b See Fig. 8C for peak assignments.
so these were used to locate the direction and the magnitude of the Y b 3÷ susceptibility tensors using coordinates for these five nuclei from the X-ray structure. With these parameters determined (see the best-fit calculated versus observed LIS values in Table IV), LIS values for all other nuclei in the protein could be predicted, and several resonances were assigned on this basis. 86 It was noted that the calculated LIS values for protons T A B L E IV COMPARISON OF CALCULATED AND OBSERVED LANTHANIDEINDUCED SHIFTS IN PARVALBUMIN a
ap Nucleus
Observed
Calculated
r b (~)
~H His-26C2H lH His-26C2H IH N - a c e t y l - C H 3 U3Cd C D metal site 13C Arg-75 ~:-carbon
0.485 0.343 0.033 -0.270 0.318
0.475 0.332 0.082 -0.286 0.351
13.6 15. l 20.0 11.9 23.2
Reprinted with permission from Ref. 86. b F r o m E F site.
[3]
LANTHANIDE SHIFT REAGENTS
73
close to the EF binding site (5-10 ,~) were generally larger than the observed shifts, suggesting that the solution structure in this region is less compact than that predicted from the crystal structure. This illustrates the power of the LIS method in emphasizing relatively small structural differences between the solution and solid state. Ln 3+ ions were later used to replace Ca 2+ and assign various ~3C resonances of parvalbumin. 89 The approach described above provides a useful methodology that can be applied to analyze the spectral perturbations induced by the trivalent lanthanide ions in the slow exchange limit. Because of the great degree of sequence similarity between parvalbumin and many other CaZ+-binding proteins of the EF family, such as calmodulin (CAM), troponin C (TnC), the myosin light chains, and the intestinal calcium-binding proteins (ICaBP), and the fact that some of these proteins already have known X-ray crystal structures, an approach involving LIS is, in principle, applicable to them. Some preliminary studies have been undertaken, such as in troponin C fragments 9°'91 and in ICaBP. 92 Studies of non-EF-type Ca 2+binding proteins, such as elastase, have also been reported. 93 Probing Surface o f Proteins
The processes whereby a protein surface recognizes another surface are of fundamental importance in a wide range of biochemical systems. Recognition, which is rather selective, is largely dependent on general electrostatic interactions. The potential energy surfaces of the interacting proteins depend on the polarity size, shape, and flexibility of their surfaces, which are determined by the geometric distribution of their surface residues. 94 The surface cationic groups (guanidinium from arginines or ammonium from lysines) or anionic groups (carboxylates from aspartates and glutamates) may be found concentrated in certain regions, yielding cationic and anionic patches which constitute mountains and wells in such a potential energy surface. Hydrophobic patches may also be found. Studies of the binding of small charged cationic and anionic species to protein surfaces constitute a powerful method to study this problem. 89 D. J. Nelson, lnorg. Chim. Acta 27, L71 (1978). 90 L. Lee, B. D. Sykes, and E. R. Birnbaum, FEBS Lett. 98, 169 (1979).
91j. Garirpy, L. E. Kay, I. D. Kuntz, B. D. Sykes, and R. S. Hodges, Biochemistry 24, 544 (1985). 92W. J. Bridsall, D. C. Dalgano, B. A. Levine, R. J. P. Williams, C. S. Fullmer, and R. H. Wasserman, in "Calcium BindingProteins: Structure and Function" (F. L. Siegel, E. Carafoli, R. H. Kretsinger, D. H. MacLennam, and R. H. Wasserman, eds.), p. 405. Elsevier, New York, 1980. 93j. L. Dimicoli and J. Bieth, Biochemistry 16, 5532 (1977). 94S. C. Tam and R. J. P. Williams,Struct. Bonding (Berlin) 63, 103 (1985).
74
PROBES OF METAL ION ENVIRONMENTS
[3]
These studies have been systematically carried out for ferricytochrome c, 95-97 using small complexes of differing size, shape, and charge that are paramagnetic N M R shift and/or relaxation agents. Analysis of the location of their binding sites was possible through observation of NMR effects on specific proton resonances, which function as reporter groups (Fig. 10). For example, binding studies of the spherical relaxation agents [Cr(CN)6] 3÷, [Gd(dipicolinate)3] 3-, and [Cr(NH3)6] 3+ yield, respectively, the location of positive, hydrophobic, and negatively charged surface regions. Cylindrical probes like [Fe3+(EDTA4-)] - will find dipolar regions. All those surface regions are quite mobile. Such an approach has also been applied to detect histidine-, lysine-, and arginine-containing cationic patches in PGK 81 and myosin subfragment S1, 98 using [MIII(CN)6] 3probes, and hydrophobic patches in S1, 98 using [Gd(DOTA)]-. A different LIS approach has been used to assign 13C resonances in the bacteriophage fd ssDNA-binding gene 5 protein (G5P). This protein, which in solution is a dimer with a molecular mass of about 20 kDa, may be reductively methylated to introduce 13C-enriched methyl groups into all six lysyl residues without significantly disrupting its ability to bind ssDNA. 99 This derivative has been studied by ~3C NMR, and three of the modified lysine resonances are affected by the binding of oligonucleotides. The problem encountered in this protein, which does not normally bind metal ions, was how to assign the resonances to the proper lysyl residues in the protein sequence. In this case, the assignment was accomplished by titrating the protein with negatively charged Ln 3÷ tetraazamacrocylic phosphate extrinsic probes, Tb(DOTP) 5- as a LIS probe and Gd(DOTP) 5as a relaxation probe. The spectrum of the 13C-enriched protein before and after the addition of Tb(DOTP) 5- is shown in Fig. 11. Resonances 1, 2, and 5 shifted to higher frequency, and resonances 3 and 4 shifted to lower frequency throughout a titration until 1 equivalent of chelate per protein dimer had been added. Further additions of the probe did not affect the spectrum. Addition of Gd(DOTP) 5- specifically broadened resonance 2 (and 1 to some extent). Competition experiments between the shift probe 95 C. G. S. Eley, G. R. Moore, G. Williams, and R. J. P. Williams, Eur. J. Biochern. 124, 249 (1976). 96 G. Williams, C. G. S. Eley, G. R. Moore, M. N. Robinson, and R. J. P. Williams, FEBS Lett. 150, 295 (1982). 97 C. O. Arean, G. R. Moore, G. Williams, and R. J. P. Williams, Eur. J. Biochem. 173, 607 (1988). D. C. Dalgarno, H. P. Prince, B. A. Levine, and I. P. Trayer, Biochim. Biophys. Acta 707, 81 (1982). R. Dick, C. F. G. C. Geraldes, A. D. Sherry, C. W. Gray, and D. M. Gray, Biochemistry 28, 7896 (1989).
[3]
75
LANTHANIDE SHIFT REAGENTS
K5
126 I K oo
~'-~1
~~'E~
9
C terminis
V3 4-13:1
~ / ~ ~ K E 8 2 7 1
Top D93 02 K5 I
--5 6 ~ . ~ E69 K99~ ~ , , , - . ~ ~M65 Clerminus--~, C'~3"~6, ~ ' ~ ~ 1 rEK73 T1tO2~3~/~j~:~60~~6, / E66 ( )H33{ -~"~'-~L .-'~L-X==,,J, / 7
DSO Back FIG. 10. Binding sites for [Cr(CN)6]3- on cytochrome c. Filled regions are positively charged, and striped regionsare negativelycharged.Symbolsare single-letternotationsfor amino acids. The square grids denote the six anion binding sites. (Reprinted with permission from Ref. 94.)
and a hexanucleotide show that the binding is mutually exclusive, which suggests that the binding site for the phosphonate chelate overlaps the DNA binding sites. A comparison of the experimental and calculated (based on the protein crystal structure ~°°) shift and broadening effects 10oG. D. Brayer and A. McPherson, J. Mol. Biol. 169, 565 (1983); G. D. Brayer and A. McPherson, Biochemistry 23, 340 (1984).
76
PROBES OF METAL ION ENVIRONMENTS
[3]
4
5 6
A
3,4
5
•
l
. . . .
I
45
. . . .
J
. . . .
I
. . . .
i
. . . .
44
6
I
43
. . . .
~
. . . .
I ' "
42
(ppm) FIG. 11. 13C NMR spectrum (50.1 MHz) of [methyl-13C]G5P (A) before and (B) after the addition of [Tb(DOTP)] 5-. Resonances 1-6 correspond to the six dimethyllysyl residues, whereas resonance 7 is the partially modified N-terminal dimethylmethionyl residue. (From Ref. 99.)
allowed location of the probe at the protein surface and assignment of resonances 1-6. Resonance 2 corresponds to Lys-24, whose large perturbation can be explained by a substantial movement of the flexible DNAbinding loops containing this residue on binding of the chelate. This is an example of a system that has relatively specific lanthanide chelate binding, which may be saturated at the concentrations used in the NMR experiment while maintaining rapid chemical exchange conditions. This advantage allows determination of the stoichiometry plus a direct evaluation of the diamagnetic chemical shift of each resonance. One further advantage of this system is that the Ln(DOTP) 5- structures are by definition axially symmetric, l°l so the LIS data may be fit to the axial symmetry model without the usual laborious tests for axial symmetry and without making assumptions concerning ligand field averaging. ~01A. D. Sherry, C. F. G. C. Geraldes, and W. P. Cacheris, Inorg. Chim. Acta 139, 137 (1987).
[3]
LANTHANIDE SHIFT REAGENTS
77
The interaction of Gd(DOTP) 5- with very similar IKe and M13 G5P proteins has been studied by proton NMR as a function of pH.~°2 This study showed that these probes bind to the protein at two spatially remote sites whose affinities have different pH dependencies. Above pH 7, there exists one high-affinity binding site for the probe per G5P monomer, which coincides with the ssDNA-binding domain of a phosphate-binding electropositive cluster at the protein surface. At pH 5, a second lowaffinity probe binding site became apparent. Soluble spin labels, such as the nitroxide tempol, approach protein surfaces randomly and "bleach" their protons to NMR measurements because of paramagnetic relaxation effects. The simplification of twodimensional nuclear Overhauser effect spectroscopy (NOESY) spectral cross-peaks observed for amide protons in the presence of nitroxides and in DzO, which depend on proton exposure to the nitroxides and to the solvent, reflects the native folding pattern of the protein. A correlation of the spectral simplifications with the known tertiary structure of peptides and proteins, such as gramicidin S, lysozyme, and BPTI, has been explored to provide useful information about protein conformation and dynamics, such as the location of specific amide groups.l°3'~°4 Conclusions and Future Prospects Despite much effort, the prospect of obtaining the quantitative structure of a protein in solution using lanthanides as NMR shift and relaxation probes independently of its X-ray crystal structure has never materialized. However, at least for small proteins, this structural goal has been reached using a combination of the nuclear Overhauser effect and multidimensional NMR. 1°5 Nevertheless, useful qualitative or semiquantitative structural information can still be obtained using the lanthanide probe method, even for medium-sized proteins. Enzymes with no metal requirements are the least amenable to the use of lanthanides as probes, owing to the difficulty of, in general, finding a single, specific metal binding site. MgZ+-ATP-dependent kinases and Ca2+-binding proteins may, on the other hand, constitute the most promising systems to explore, through the use of isomorphous substitution. Axial 102j. p. M. van Duynhoven,I. M. A. Nooren, D. W. Swinkels,P. J. M. Folkers, B. J. M. Harmsen, R. N. H. Konings,G. L. Tesser, and C. W. Hilbers,Biochemistry, submitted. 103N. Niccolai, A. Bonci, M. Rustici, M. Scarselli, P. Neff, G. Esposito, P. Mascagni, A. Motta, and H. Molinari,J. Chem. Soc., Perkin Trans. 2, 1453(1991). 104G. Esposito, A. M. Lesk, H. Molinari, A. Motta, N. Niccolai, and A. Pastore, J. Mol. Biol. 224, 659 (1992). 105K. Wtithrich,Science 243, 45 (1989); K. Wiithffch,Acc. Chem. Res. 22, 36 (1989).
78
PROBES OF METAL ION ENVIRONMENTS
[4]
symmetry of the experimental LIS values should not be assumed as a rule, but rather considered the exception. Ideally, axial symmetry should be proved by methods independent of LIS measurements, if possible through a study of the magnetic susceptibility tensor for the Ln3÷-protein deriv~ttives in single crystals. Examples of calcium-binding proteins that are amenable to LIS studies and that have already been studied by luminescence or ESR spectroscopic methods using lanthanide ions include calmodulin, a-lactalbumin, phosp h o l i p a s e A 2 , and C a 2 + - A T P a s e . 16'1°6'1°7 Lanthanides are also sometimes good probes at Fe 3÷ sites, as demonstrated in ESR studies of Gda÷-trans ferrin derivatives. 108,109In fact, proton LIS studies have been reported for Ln3+-transferrins. 1~° It is hoped that many other applications of lanthanides as NMR probes of proteins will arise in the future. Acknowledgments The authorthanks Prof. R. J. P. Williamsfor inspirationand JuntaNacionalde Investigaqho Cientificae Tecnol6gia(JNICT), Portugalfor financialsupport. 106 E. M. Stephens and C. M. Grisham, Biochemistry 18, 4876 (1979). 107G. H. Reed, R. D. Hershberg, and G. H. de Haas, in " N M R in Biochemistry" (S. Opella and P. Lu, eds.), p. 361. Dekker, New York, 1979. i08 p. B. O'Hara and S. H. Koenig, Biochemistry 25, 1445 (1986). 109 O. Zak and P. Aisen, Biochemistry 27, 1075 (1988). ll0 L. Messori and M. Piccioli, J. Inorg. Biochem. 42, 185 (1991).
[4] A l k a l i M e t a l N u c l e a r M a g n e t i c R e s o n a n c e By DUARTE MOTA DE FREITAS Introduction The alkali metal ions Na t and K ÷ are abundant in biological systems, generally in the concentration range of 1.0-I000 mM. ~ In contrast, the concentrations of Li ÷, Rb ÷, and Cs ÷ in most biological systems are negligible. ~Li ÷, however, is present at appreciable concentrations (in the range of 0.2-5.0 mM) in tissues of manic-depressive patients receiving lithium carbonate treatment. 2 i C. A. Pasternak (ed.), "Monovalent Cations in Biological Systems." CRC Press, Boca Raton, Florida, 1990. 2 M. Schou, in "Lithium and the Cell: Pharmacology and Biochemistry" (N. J. Birch, ed.), p. 1. Academic Press, San Diego, 1991.
METHODS IN ENZYMOLOGY, VOL. 227
Copyright © 1993 by Academic Press, Inc. All rights of reproduction in any form reserved.
[4]
ALKALI METAL N M R
79
Many enzymes are activated by K + alone (e.g., pyruvate kinase, phosphofructokinase, and aldehyde dehydrogenase), a few enzymes are activated by Na + alone (oxaloacetate decarboxylase), and one membranebound enzyme (Na +,K*-ATPase) is activated by both K + and Na ÷ ions. J Whereas the intracellular K + concentrations are generally high for most cell types, the extracellular K ÷ concentrations are low. In contrast, the intracellular Na + concentrations are typically lower than the Na + concentrations in extracellular fluids. The Na + and K + gradients, which result from active and passive ion transport mediated by membrane-bound proteins, and the corresponding transmembrane potential difference play an important role in nerve transmission arid muscle contraction. 1 The Li + ion has pharmacological importance in the treatment of manic-depressive psychosis2; Rb + and Cs + ions are sometimes used in physiological studies as tracers of K + transport. Despite the physiological and pharmacological importance of alkali metal ions and the rather high concentrations in biological systems, the understanding of the environment of alkali metal ions in biomolecules is scant compared to that available for transition metal ions. Alkali metal ions are diamagnetic, and their complexes with biological ligands are colorless, ruling out the application of common methods, such as electron spin resonance and optical spectroscopy. Total alkali metal ion concentrations in metalloproteins or concentrations during ion transport generally can be determined by conventional methods, such as atomic absorption (AA) spectrophotometry or the use of radioisotopes; however, the determination of the environment of alkali metal ions in biomolecules is not amenable to these conventional methods. The determination of ion concentrations during transport experiments performed with invasive methods, such as AA or radioisotopes, requires the separation of cells from the suspension medium, followed by cell lysis, prior to analysis. 3 The radioisotope method is not applicable to Li + transport because lithium radioisotopes have extremely short half-lives. If an alkali metal cation is present in two different environments in a biological sample, in either the free hydrated form or bound to a cytoplasmic protein or a membrane component, only alkali metal nuclear magnetic resonance (NMR) spectroscopy would be suitable for probing these different environments. A molecular understanding of the binding and transport properties of alkali metal ions can be obtained from alkali metal NMR methods; magnetically or chemically nonequivalent pools of alkali metal cations have different relaxation and sometimes different chemical shift properties. 3 D. Mota de Freitas, M. T. Espanol, and E. Dorus, in "Lithium Therapy Monographs" (V. S. Gallicchio, ed.), Vol. 4, p. 96. Karger, Basel, 1991.
80
PROBES OF METAL ION ENVIRONMENTS
[4]
Several reviews of alkali metal N M R and its applications to biological s y s t e m s h a v e appeared4-11; these should be consulted for earlier accounts o f alkali metal N M R s p e c t r o s c o p y and for details on the N M R properties of alkali metal nuclides. This chapter provides a practical description of the w a y in which N M R s p e c t r o s c o p y can be used for determining the e n v i r o n m e n t of alkali metal ions in m e t a l l o e n z y m e s and metalloproteins as well as for studying alkali metal ion distribution and transport across cell m e m b r a n e s . Because of recent d e v e l o p m e n t s in N M R applications to t r a n s m e m b r a n e transport of alkali metal ions in cell suspensions and perfused organs, this physiologically important area of alkali metal N M R applications is described here in depth. The principles that form the basis o f the N M R transport m e t h o d s illustrated here with h u m a n red blood cell (RBC) suspensions are also applicable to perfused organs. 9-N Details on the w a y in which the interpretation of alkali metal N M R data is obtained and the special precautions to be taken w h e n this technique is used are also given.
Special Features of Alkali M e t a l Nuclear Magnetic Resonance Spectra The basic principles and applications of N M R s p e c t r o s c o p y are described elsewhereJ2; in this section we describe unique aspects of alkali metal N M R spectra. With the advent of Fourier transform nuclear magnetic r e s o n a n c e ( F T - N M R ) s p e c t r o m e t e r s , the introduction of superconducting magnets, and i m p r o v e m e n t s in p r o b e design, new information on the m e t a l l o b i o c h e m i s t r y of alkali metal ions has been obtained f r o m alkali metal N M R s p e c t r o s c o p y . T h e N M R properties of the biologically important alkali metal nuclides are shown in Table I. F o r comparison, the N M R properties of the m o r e c o m m o n nuclides IH and 13C are also listed in Table I. With the exception o f 6Li, all alkali metal nuclides have a relatively high natural abundance. The N M R receptivity of a nuclide provides a 4 j. Mason (ed.), "Multinuclear NMR," p. 625. Plenum, New York, 1987. 5 C. Detellier, in "NMR of Newly Accessible Nuclei: Chemically and Biochemically Important Elements" (P. Laszlo, ed.), Vol. 2, p. 105. Academic Press, New York, 1983. 6 F. W..Wehrli, in "Annual Reports on NMR Spectroscopy" (G. A. Webb, ed.), Vol. 9, p. 125. Academic Press, New York, 1979. 7 S. Fors6n and B. Lindman, Methods Biochem. Anal. 27, 289 (1981). s j. j. Dechter, in "Progress in Inorganic Chemistry" (S. J. Lippard, ed.), Vol. 29, p. 285, Wiley, New York, 1982. 9 C. S. Springer, Jr., Annu. Rev. Biophys. Chem. 16, 375 (1987). l0 R. K. Gupta, in "NMR Spectroscopy of Cells and Organisms" (R. K. Gupta, ed.), Vol. 2, p. 1. CRC Press, Boca Raton, Florida, 1987. II K. Kirk, N M R Biomed. 3, 1 (1990). t2 j. j. Villafranca, this series, Vol. 177, p. 403.
~
+
..g a
_
~ ~ 1 1
xx~x~Xll %
iI
.,.¢ ,-I
N m
Z >
Z ©
Iga
~xx~xxxg
0 m 0
[..q
I~. o 0
,-] i~1
1. Here Zc is a characteristic tumbling rate of the molecular system containing the 43Ca nucleus and oJo is the NMR frequency (Larmor frequency) of the 43Ca nuclei. 6 R. Poupko, A. Baram, and Z. Luz, Mol. Phys. 27, 1345 (1974). 7 L. G. Werbelow and A. G. Marshall, J. Magn. Resort. 43, 443 (1981). 8 P.-O. Westlund and H. WennerstrOm, J. Magn. Reson. 50, 451 (1982). 9 C. A. Fyfe, "Solid State NMR for Chemists." CRC Press, Guelph, Ontario, Canada, 1983.
110
PROBES OF METAL ION ENVIRONMENTS
[5]
In the case of rapid isotropic motion, as would be expected to prevail for 43Ca2+ ions binding to a small organic molecule, a peptide, or perhaps even a small protein, the relaxation rates R, and R2 will be identical and governed by a single relaxation time constant, T, according to 1° 27r2 2 R l = R 2 = (l/T) = - ~ - X ~'~
(1)
where X is the quadrupole coupling constant (in Hz) characterizing the interaction of the nuclear electric field gradient with the external electric field gradient. The value of X will typically be in the range 105 to 106 Hz. In Eq. (1) we have neglected any asymmetry in the external electric field gradient, which is reasonable since this term is in most cases close to unity. Equation (1) means that the relaxation time, T, for a 43Ca2+ ion binding to a molecule with ~'c = 1 nsec and with X = 1 MHz equals 2.5 msec, corresponding to a line width of the observed N M R signal of about 140 Hz. The use of Eq. (1) is valid if too ( = 27rVo) -< 1 × 10⁸ radians/sec. It should be noted that in the rapid isotropic motion situation the NMR line shape will be Lorenzian. In view of this it may come as a surprise that the line width of the 43Ca2+ NMR signal in a 100 m M aqueous solution of an inorganic calcium salt is less than 1 Hz.I1 In the case of slow isotropic motion the relaxation of a nucleus like 43Ca with spin I > ½, will in general not be a simple exponential decay. In the case of 43Ca (I = ½) the transverse and longitudinal nuclear magnetizations will decay as a weighted sum of four exponentials. 5 This means that the line shape of a 43Ca NMR signal will no longer be a Simple Lorenzian but more complex. However, in a considerable number of biological applications the experimental conditions are such, or can sometimes be made such, that OSorc is in the proximity of unity, a situation one might call "intermediate isotropic motion." In this case the transverse and longitudinal relaxation rates will often appear singly exponential though different. Halle and Wennerstr6m have used perturbation theory to derive approximate analytical expressions for R, and R212 [Eq. (2)]: 10 A. Abragam, in "The Principles of Nuclear Magnetism." Oxford Univ. Press (Clarendon), London and New York, 1961. it S. Fors6n and B. Lindman, Methods Biochem. Anal. 27, 289 (1981). 12 B. Halle and H. Wennerstr6m, J. Magn. Reson. 44, 89 (1981).
[5]
CALCIUM N M R
0.2rc 0.8r c 27r2 2 1 + Worc RI = "~-X 2 2 + 1 -¥-Z-2 2 + 4¢Oo~'c/ R2
=
27r2 2 ( 0.5~'c 0.2~-c - - ~tOo~-c 2 + 1 + 4¢Oo~'c/ 22 ~ - - X 0.3~'c + 1 +
111
(2a) (2b)
Equations (2a) and (2b) are valid approximations for experimental conditions such that Worc -< 1.5. The apparent complexity of the above experimental situation is in fact beneficial. Because the observed relaxation rates Rj and R 2 are unequal, it follows that if we have determined both these rates we may independently calculate rc and X!
Effects of Chemical Exchange When a magnetic nucleus like 43Ca is being rapidly transferred between two environments characterized by different interactions with the nucleus this constitutes a mechanism for relaxation. The appearance of a 43Ca NMR spectrum will be dependent on the rate of chemical exchange in relation to other NMR parameters. We begin to assume that a 43Ca nucleus is present in two different environments, say, A and B, characterized by different chemical shifts and different intrinsic relaxation rates. In the absence of chemical exchange we would then observe two separate 43Ca NMR signals. Typically environment A could be uncomplexed, "free," 43Ca2+ ions in aqueous solution, and B could be 43Ca2+ ions (strongly) binding to a biological macromolecule, for simplicity assumed to undergo rapid isotropic motion. The NMR signal from site A would then be sharp and narrow, whereas that from site B would be broad owing to efficient relaxation in this site (long re, high X). If we gradually could turn on chemical exchange of the 43Ca2+ nucleus, the first effect to be discerned would be an additional broadening of the two NMR signals. The additional broadening, AAvl/2, is given by AA/-"I/2 =
1/~7"ex
(3)
where rex represents the average lifetime of a 43Ca2+ ion in the site. If the populations of the two sites are PA and PB, it then follows that PA/PB = A B rexh'ex. If PA is not much larger than PB, the additional line broadening may be most easily detected on the narrow A signal. The "turning on" of chemical exchange can often in practice be accomplished by raising the sample temperature. Equation (3) may be used to determine slow exchange rates even if the population of 43Ca2+ ions in the fast relaxing site, PB, is so small that no NMR signal from the B site is observable.
112
PROBES OF METAL ION ENVIRONMENTS
[5]
We now turn to the other extreme experimental situation, that is, when the rate o f chemical exchange of the 43Ca2+ ion between the two different environments is much faster than both the inverse of the chemical shift difference ANAB ( = NA -- NB) and the relaxation rates (R1 and R2) at both sites. In this case the 43Ca N M R spectrum of our model system would consist of a single signal. The N M R properties of this signal will be a weighted average of the properties at sites A and B. Thus, the L a r m o r f r e q u e n c y of the observed signal Noss = PANA + PBNB and the relaxation rate R °Bs = R °Bs = R °ss = PARA + PBRs. In this experimental situation the exchange rate may not be determined from the N M R spectrum. This situation is, however, very useful if one is primarily interested in determining association constants for Ca 2+ interacting with a biological macromolecule. The relaxation rate, and accordingly the N M R signal line width, of 43Ca2+ at the macromolecular binding sites is very much larger than for " f r e e " 43Ca2+. This means that even if only a small fraction of the 43Ca2+ ions is bound to the macromolecular site the averaged 43Ca2+ N M R signal will be considerably broadened. Let us consider Ca z+ binding to a single binding site on a protein molecule, P. We may write for the equilibrium constant Ka: C a 2+ + P .
Ka--
kon
, Ca2+ . p ko~
(4)
kon _ [ C a 2+ . p ]
kon
[Ca2+][P]
The fraction o f Ca 2+ bound to the protein, PB, is [Ca 2+ • P]/[Ca2+]tot, where [Ca2+]tot is the total Ca z+ concentration. If the experiment is conducted at conditions such that Ca z÷ ions are in large excess over the protein, the population of " f r e e " Ca 2+ , P r , will be close to unity. It then follows from Eq. (4) that P s = ga[P]tot/(1 + ga[Ca]tot)- At a given set o f Ca 2+ N M R relaxation rates, RoB s will be Ka[PltotRs
Ross = PFRF + PsRB = PFRF + 1 + Ka[Ca2+]tot
(5)
We may consider only the observed relaxation rate in excess over the value for " f r e e " Ca 2+, REX, and since PF ~ 1 we have ga[P]totRs
REX = Ross - RF = 1 + Ka[Ca2+]to t
(6)
It is apparent that the relation in Eq. (6) may be used to determine Ca 2+ binding constants by following the dependence of REX, that is
[5]
CALCIUM N M R
113
7rA/~l/2, on the total Ca 2+ concentration. The upper limit of K a values that can be determined is dependent on the lowest Ca 2+ concentrations at which 43Ca NMR signals can be reliably detected. Ka values of up to 104 M- l may certainly be detected with a good experimental setup. For higher K a values the assumption of fast chemical exchange may also not be valid. A good test if the fast exchange criterion is met is to raise the temperature of the sample. The observed 43Ca NMR line width should then decrease slightly owing to the faster tumbling of the protein molecule and the correspondingly slower relaxation of the bonded 43Ca2+ ion. The NMRaccessible range of Ka values, from approximately 1 to 104 M -l, is difficult to study by other physical techniques. If the Ca 2+ chemical exchange rate is neither very slow nor very fast, but comparable to the rate of relaxation at the macromolecular binding site, the appearance of the 43Ca NMR spectrum will depend in a complex way on the exchange rate, the Ca 2+ binding constant, and the relaxation rate. The extraction of these physical parameters from the experimental spectrum requires a detailed analysis of Ca 2+ to protein concentration ratios. A procedure that has been used for a number of years in our department is described in the literature) 3,14 The procedure depends on an analysis of the total band shape of the 43Ca NMR spectrum. For systems where it has been possible to compare rate constants obtained from the NMR method with rate constants obtained from stopped-flow measurements, the rates are found to agree within the errors of measurements. Under favorable circumstances the rate constants that may be determined using 43Ca NMR range from less than 10 to 104 sec-1. Although a total band-shape analysis of the 43Ca NMR spectrum is always advisable, it is possible to use a simple analytical expression for the excess line width, REX, in systems where the concentration of uncomplexed, " f r e e , " Ca 2+ is much larger than the concentration of the Ca2+-protein complex (PF > > PB)- Then we have
Ri,EX -
PB
(7)
(Ri,B) 1 + 'rex
where i = 1 (longitudinal relax) or 2 (transverse relax) and R;,B is the relaxation rate at the protein site with the Ca z+ exchange lifetime %x. Equation (7) is valid as written when the 43Ca NMR chemical shift difference between free and bound states is small. Equation (7) will not result in very accurate values of the Ca 2+ exchange rate but may nevertheless be useful in many situations. 13 T. Drakenberg, S. Fors6n, and H. Lilja, J. Magn. Reson. 53, 412 (1983). 14 M.-D. Tsai, T. Drakenberg, E. Thulin, and S. Fors6n, Biochemistry 2 ~ 3635 (1987).
114
PROBES OF METAL ION ENVIRONMENTS
[5]
Special Experimental Problems of 43Ca Nuclear Magnetic Resonance NMR spectroscopy of quadrupolar nuclei like 43Ca NMR differs in many respects from NMR of spin I = ~ nuclei. We briefly comment on some of the most pertinent factors. Sample Preparation. As mentioned in the introduction, 43Ca NMR on problems of biological interest generally necessitates the use of isotopeenriched 43Ca. An enrichment of 40 to 60% may be sufficient. With a reasonably sensitive NMR spectrometer (see below) this should allow studies of samples with millimolar or even submillimolar Ca z+ concentrations. EDTA, EGTA, or other organic chelators that may have been used in the preparation of the macromolecular sample should be removed. ~H NMR is the best way of checking this. Control of pH of the sample is also important. H + will compete with Ca 2+ , and below pH 5 carboxylate side chains in proteins will gradually become protonated and lose the ability to strongly ligand to Ca 2+. Spectrometers. NMR probes suitable for 43Ca studies are usually not standard on modern commercial NMR spectrometers and may have to be acquired separately. Good NMR probes and spectrometer systems should have the characteristics of high sensitivity and low acoustic ringing. The sensitivity should always be tested on standard samples using experimental conditions (number of pulses, total acquisition time, a reasonably large 43Ca NMR line width, e.g., 100-200 Hz) similar to those expected in the biological applications planned. Acoustic ringing is a phenomenon that in particular affects NMR spectra of nuclei at low frequencies. Mechanical, "acoustic," waves are generated in the probe as a result of the radio frequency pulses used to excite the magnetic nuclei under study and will result in a "rolling" baseline. These effects can largely be eliminated by pulse cycling but can also be suppressed through careful probe designs. 1,~1,15 Acquisition of 43CaNuclear Magnetic Resonance Spectra. One of the benefits of the high 43Ca relaxation rates usually encountered in biological applications is that high rates of radio frequency pulsing may be used to obtain the NMR spectrum. High pulse rates do, however, put high demands on the spectrometer: high power output at the low-frequency band where 43Ca signals appear so as to make the 90° pulses short, high dynamic range, control of the preacquisition delay time, etc. These and other requirements have been discussed at some length by Sanders and T s a i . 4 It should be emphasized here that the line shape of a 43Ca NMR signal may be complex and non-Lorentzian. To truly reproduce the NMR specI5 I. P. Gerothanassis, Prog. NMR Spectrosc. 19, 267 (1987).
[5]
CALCIUMNMR
115
trum and avoid artificial broadening it is necessary to sample the free induction decay (FID) after a radio frequency pulse for a time TS that satisfies the condition T, > ~T2, where T2 is the longest time constant that characterizes the decay of the FID.
Experimental Applications A comprehensive review of essentially all 43Ca NMR studies of calcium-binding proteins has been published.16 In this chapter we highlight a few applications aimed at determining different biophysical parameters.
Chemical Shift 43Ca ions bound to proteins frequently give broad (400-800 Hz) signals within a small shift range (+-30 ppm). It is therefore often difficult to discriminate signals from calcium ions in different environments, although band-shape analysis can help to identify partially overlapping components 17 as illustrated in Fig. 1. The problem can also be overcome by addition of various lanthanide shift reagents [e.g., Dy(PPP)2 v- , where Dy is dysprosium(III) ion and ppps- is triphosphate] to the protein solution, whereby the signal from free calcium ions experiences a shift change of between 60 and -125 ppm. 18'19 A drawback is that some shift reagents broaden the signals beyond detection.
Ca2+-Binding Constants The first determination of the calcium affinity of a protein using 43Ca NMR concerned the single Ca 2+ site in prophospholipase A2, for which the binding constant was calculated as K a = 2.5 x 10³ M -1 (Refs. 13, 20, and 21). This initial work has been followed by several other studies of calcium sites as diverse as that in factor XIII of the blood coagulation cascade (K a = 400 M - l ) , 22 bone y-carboxyglutamic acid protein (Ka = 16 C. Johansson and T. Drakenberg, Annu. Rep. NMR Spectrosc. 22, 1 (1989). 17 H. J. Vogel, T. Drakenberg, and S. Fors6n, Biochemistry 24, 3870 (1985). 18 H. J. Vogel, T. Andersson, W. Braunlin, T. Drakenberg, and S. Forsfn, Biochem. Biophys. Res. Commun. 122, 1350 (1984). 19 H. J. Vogel and W. Braunlin, J. Magn. Res. 62, 42 (1985). 20 T. Andersson, T. Drakenberg, S. Fors6n, T. Wieloch, and M. Lindstr6m, FEBS Lett. 123, 115 (1981). 21 T. Drakenberg, T. Andersson, T. S. Fors6n, and T. Wieloch, Biochemistry 23, 2387 (1984). 22 M. M. Sarasua, K. A. Koehler, C. Skrzynia, and J. M. McDonagh, J. Biol. Chem. 257, 14102 (1982).
116
PROBES
'
'
'
I
1000
OF
'
METAL
'
'
'
ION
I
0
ENVIRONMENTS
'
'
'
'
[5]
I
'
"
'
-1000
Hz
FIG. 1.43Ca NMR spectrum at 24.34 MHz from a solution of 2.2 mM total calcium and 1 mM of the calbindin D9k mutant Y13F. (Top) Experimental spectrum; (middle) calculated spectrum; (bottom) individual Lorentzian lines. The observed band can be resolved into three Lorentzian signals, one for free calcium and two broader lines of approximately equal intensity for calcium in the two bindings sites in the protein. [Redrawn with permission after S, Linse, P. Brodin, T. Drakenberg, E. Thulin, P. Sellers, K. Elmd6n, T. GrundstrSm, and S. Fors6n, Biochemistry 26, 6723 (1987).]
5 × 10³ to 1 × 10⁵ M - l ) , 23 a n d the p o l y p e n t a p e p t i d e o f e l a s t i n (K a = 7 o r 35 M-1).24 Interaction between Macromolecules 43Ca N M R c a n also b e u s e d to s t u d y the i n t e r a c t i o n b e t w e e n m a c r o m o l e c u l e s if at l e a s t o n e o f t h e m b i n d s c a l c i u m . I n the c a s e o f c a l c i u m b o u n d to p r o t h r o m b i n f r a g m e n t 1, B o u h o u t s o s - B r o w n et al. z5 h a v e f o u n d that the 43Ca N M R line w i d t h is s e n s i t i v e to b o t h p r o t e i n a s s o c i a t i o n a n d to the i n t e r a c t i o n o f the p r o t e i n with a p h o s p h o l i p i d m e m b r a n e . 23 M. Sv~ird,T. Drakenberg, T. Andersson, and P. Fernlund, Eur. J. Biochem. 158, 373 (1986). 24D. W. Urry, T. L. Trapane, and C. M. Venkatachalam, Calcif. Tissue Int. 34, $41 (1982). 25E. Bouhoutsos-Brown, C, H. Pletcher, G. L. Nelsestuen, and R. G. Bryant, J. lnorg. Biochem. 21, 337 (1984).
[5]
CALCIUM NMR &v
12
/Hz
1 17
×
o
200
o
150
100
50
i
270
320
370 ~T/K
FIG. 2. Temperature dependence of the 43CaNMR linewidth (aVl/2) of the Lorentzian signal from free calcium in the presence of three different calbindin D9k mutants: (©) (A14A + AI5D) with kon = 515 sec-l; (×) (AI5D + P20G) with koff = 92 sec-~; and (11) (A142x + A15D + P20G + N21A) with koff = 6700 sec -t. Note that the calcium/protein ratios are different for the three plots. [Redrawn with permission after C. Johansson, P. Brodin, T. Grundstr6m, S. Fors6n, and T. Drakenberg, Eur.J. Biochem. 202, 1283(1991).]
Calcium Exchange Rate, ko#, Quadrupole Coupling Constant, X, and Correlation Time, ~',. As described earlier, the t e m p e r a t u r e d e p e n d e n c e of the 43Caline width gives direct information of the exchange rate, koff, for the calcium ions, as depicted in Fig. 2. F u r t h e r m o r e , from the t e m p e r a t u r e dependence the quadrupole coupling constant, X, and correlation time, %, for calcium in the binding site can be obtained. This gives information on the environment of the site, and f r o m a total band-shape analysis of the Lorentzian signals as a function of t e m p e r a t u r e information on the t h e r m o d y n a m i c s of calcium binding can be obtained. S o m e proteins belonging to the calmodulin superfamily of calciumbinding proteins have been extensively studied by 43Ca NMR: troponin C, parvalbumin, calmodulin, and calbindin D9k. F o r calmodulin (CAM), with a correlation time of 8.2 nsec and a quadrupole coupling constant of 1.15 M H z , studies of both the intact protein and its two tryptic fragments, each comprising one globular domain with two Ca 2+ sites, led to the identification of the two C-terminal Ca 2+ sites as the high-affinity sites with slow Ca 2+ exchange (kofr --~ 10 sec-~) and the N-terminal sites as the
118
PROBES OF METAL ION ENVIRONMENTS
[6]
low-affinity c a l c i u m / m a g n e s i u m sites with an intermediate exchange rate of about 500 s e c - J (Refs. 1, 26, and 27). Finally one might raise the question whether the d e v e l o p m e n t o f multidimensional high-resolution ~H N M R methods will m a k e 43Ca N M R studies redundant. It is, h o w e v e r , evident from the a b o v e presentation that 43Ca N M R provides unique information about Ca 2÷ ions interacting with m a c r o m o l e c u l a r sites. A striking e x a m p l e is provided in the case of calbindin D9k, which has been subject to detailed engineering and structural (~H N M R and X-ray) studies in our laboratory. Several mutant f o r m s of the protein have been extensively studied by 43Ca N M R , w h e r e b y , for instance, different factors that affect the calcium exchange rate in the Nterminal site have b e e n identified. J7,28-32 In addition, a study of calciumbinding l y s o z y m e s and a-lactalbumins 33 illustrates that 43Ca N M R will continue to be an indispensable m e t h o d for the study of calcium binding proteins. 26S. Fors6n, A. Andersson, T. Drakenberg, O. Teleman, E. Thulin, and H. J. Vogel, in "Calcium Binding Proteins" (B. de Bernard, G. L. Soltocasa, G. Sandri, E. Carafoli, A. N. Taylor, T. C. Vanaman, and R. J. P. Williams, eds.), p. 121. Elsevier, Amsterdam, 1983. 27A. Teleman, T. Drakenberg, and S. Fors6n, Biochim Biophys. Acta 873, 204 (1986). 28S. Linse, P. Brodin, T. Drakenberg, E. Thulin, P. Sellers, K. Elmd~n, T. Grundstr6m, and S. Fors6n, Biochemistry 26, 6723 (1987). 29S. R. Martin, S. Linse, C. Johansson, P. M. Bayley, and S. Fors6n, Biochemistry 29, 4188 (1990). 30C. Johansson, P. Brodin, T. Grundstr6m, E. Thulin, S. Fors6n, and T. Drakenberg, Eur. J. Biochem 187, 455 (1990). 31p, Brodin, C. Johansson, S. Fors6n, T. Drakenberg, and T. Grundstr6m, J. Biol. Chem. 265, 11125 (1990). 32C. Johansson, P. Brodin, T. Grundstr6m, S. Fors6n, and T. Drakenberg, Eur. J. Biochem. 202, 1283 (1991). 33j. M. Aramini, T. Drakenberg, T. Hiraoki, Y. Ke, K. Nitta, and H. J. Vogel, Biochemistry 31, 6761 (1992).
[6] P u l s e d E l e c t r o n N u c l e a r M u l t i p l e R e s o n a n c e Spectroscopic Methods for Metalloproteins and Metalloenzymes B y HANS THOMANN and MARCELINO BERNARDO
1. Introduction Pulsed electron nuclear multiple r e s o n a n c e ( P E N M R ) s p e c t r o s c o p y refers to a b r o a d class o f techniques in which solid-state pulsed nuclear
METHODS IN ENZYMOLOGY, VOL. 227
Copyright © 1993 by Academic Press, Inc. All fights of reproduction in any form reserved.
[6]
PULSED ELECTRON NUCLEAR MULTIPLE RESONANCE
l 19
magnetic resonance (NMR) methods are combined with pulsed electron paramagnetic resonance (EPR) methods for measuring the magnetic interactions of paramagnetically coupled NMR-active nuclei. In metalloproteins and metalloenzymes, the paramagnetism typically originates from the active site such as the transition metal ion or cluster of ions or from an organic cofactor. Examples of frequently encountered transition metal sites in metalloenzymes and proteins include mononuclear copper, iron, and molybdenum centers, iron-sulfur clusters, oxo-bridged copper and iron clusters, manganese clusters, and heme centers. The combination of the NMR with EPR techniques provides the advantage of increased spectral resolution as well as significantly higher sensitivity than would be obtained in the NMR experiment alone. Continuous wave irradiation techniques have generally been used to excite both the NMR and EPR transitions in most multiple resonance experiments. The additional advantages of employing pulsed excitation techniques are presented and demonstrated in this chapter. Detailed chemical and electronic structure information on the active site in the protein or enzyme can be derived from the analysis of the NMR frequencies of paramagnetically coupled nuclei even when single crystals are not available. High-resolution data on the electronic structure derived from spectroscopic methods are particularly useful if the coordination structure is known from the crystal structure. The combination of crystallographic and spectroscopic data offers the best potential for understanding chemical functionality such as electron transfer, redox potentials, and substrate specificity and reactivity. In magnetic resonance experiments, structural information is derived from the magnetic interactions between the unpaired electron spin on the metal sites and the paramagnetically coupled nuclei of the central metal atoms and ligand nuclei. This interaction can in some cases be observed as line splittings, known as the hyperfine splittings, in an EPR spectrum. In studies of metalloproteins it is frequently the case that the hyperfine splittings from ligand nuclei and even from the central metal nuclei are not resolved in the EPR spectra. This low spectral resolution arises from many line broadening mechanisms, particularly the anisotropy of the g factor as well as the overlap of hyperfine splittings from the many nuclei in the coordination sphere of the transition metal site. EPR spectra broadened by these line broadening mechanisms are referred to as inhomogeneously broadened lines. Inhomogeneous line broadening obscures the structural information otherwise provided in the analysis of the hyperfine splittings. In principle, greater spectral resolution could be obtained in the NMR spectrum of the paramagnetically coupled nuclei. In a system with one
120
PROBES OF METAL ION ENVIRONMENTS
[6]
electron coupled to many nuclei, each electron spin state can be coupled to many combinations of nuclear spin states. As a result there are many nuclear hyperfine line splittings in the EPR spectrum, which ultimately results in an inhomogeneously broadened line shape. On the other hand, the electron spin can be in only one of two spin states, so the NMR line for each nucleus can only be split into two lines. The increase in spectral resolution can be qualitatively understood by considering the average spectral density of lines in an EPR spectrum compared to the lines in the NMR spectrum. The relative number of lines in the EPR and NMR spectra can be compared using the spectral density functions introduced by Hyde.~ The average spectral density for an EPR spectrum is K
II (2Nklk + 1) k=l PEPR =
(1)
K
Z 2AkNA
k=l
The numerator in Eq. (1) corresponds to the number of EPR lines observed that are due to the hyperfine splitting, Ak, assuming no degeneracy, with K groups of N k equivalent nuclei with nuclear spin I k . The denominator describes the total width of the EPR spectrum. For simplicity, only isotropic first-order hyperfine interactions are considered. The corresponding average spectral density for the NMR spectrum of paramagnetically coupled nuclei is 2K PNMR -- Amax
(2)
where Areax determines the width of the spectrum. Because we have used the simplifying assumption that only the first-order hyperfine interaction generates line splittings, only two NMR lines are observed for each group of K equivalent nuclei. Comparing Eq. (1) to Eq. (2) it is clear that the EPR spectral density increases much faster than the NMR spectral density. Under appropriate conditions, nuclei coupled to an unpaired electron can be observed directly in the NMR experiment. 2,3 The paramagnetic interaction shifts the NMR resonance frequency and can broaden the line. An essential criterion for direct NMR detection is that the electron J. S. Hyde, "Magnetic Resonance in Biological Systems." Pergamon, London, 1967. 2 G. N. LaMar, W. D. J. Horrocks, et al., "NMR of Paramagnetic Molecules." Academic Press, New York, 1973. 3 I. Bertini and C. Luchinat, " N M R of Paramagnetic Molecules in Biological Systems" Benjamin Cummings, Menlo Park (1986).
[6]
PULSED ELECTRON NUCLEAR MULTIPLE RESONANCE
121
spin-lattice relaxation time, Tie, or electron correlation time, re, is on the order of 10- ~1sec or less if well-resolved NMR lines are to be observed. The short electron spin relaxation time assures that the anisotropic g factor and hyperfine interactions are averaged to a small value, resulting in narrow NMR lines. The paramagnetic shift is then determined by the isotropic hypertine interaction arising from the unpaired spin density on the nucleus. The pulsed techniques described in this chapter for the EPR detection of NMR transitions are well suited to those situations where the direct NMR detection of paramagnetically coupled nuclei fails. If the electron spin relaxation times are not favorable, the NMR lines are broadened beyond detection. The low sensitivity of the NMR experiment is another limiting factor. As an example, the NMR spectra of the central metal nuclei in paramagnetic transition metal complexes can be readily observed by indirect detection using pulsed excitation techniques but cannot be observed using direct NMR detection. Within the broad class of electron nuclear multiple resonance methods, electron nuclear double-resonance (ENDOR) spectroscopy is the most established. 4-v Traditionally the ENDOR experiment has been performed by continuously irradiating both the EPR and NMR transitions simultaneously. NMR transitions are detected indirectly via the change in EPR signal intensity caused by the nuclear spin flip. ENDOR transitions are therefore NMR transitions detected indirectly via an EPR transition. The ENDOR signals are often referred to as " E N D O R enhancements" because the signal corresponds to an increase in the EPR signal intensity. Because the radio frequency (rf) field irradiating the NMR transition and the microwave field irradiating the EPR transition are continuously on during the experiment, this version of the ENDOR experiment is known as continuous wave (CW)-ENDOR. In the pulsed electron nuclear multiple resonance techniques discussed in this chapter, both the NMR and EPR transitions are irradiated using pulsed techniques. The first pulsed ENDOR experiment was demonstrated by Mims in 1965, 8 less than 10 years after Feher first reported the 4 M. M. Dorio and J. H. Freed (eds.), "Multiple Electron Resonance Spectroscopy." Plenum, New York, 1979. 5 L. Kevan and L. D. Kispert (eds.), "Electron Spin Double Resonance Spectroscopy." Wiley (Interscience), New York, 1979. 6 H. Kurreck, B. Kirste, et al., " E N D O R Spectroscopy of Radicals in Solution." VCH Publ., New York, 1988. 7 A. J. Hoff (ed.), "Advanced EPR: Applications in Biology and Biochemistry." Elsevier, Amsterdam, 1989. 8 W. B. Mims, Proc. R. Soc. L o n d o n 283, 452 (1965).
122
PROBES OF METAL ION ENVIRONMENTS
[6]
CW-ENDOR experiment. 9 Subsequently, several pulsed ENDOR studies of organi~ and inorganic radicals were reported. ~°-13 The first pulsed ENDOR experiments on a metalloprotein were reported in 1988.14 There are several factors motivating the development of pulsed methodology in electron nuclear multiple resonance experiments. 8'13'15-19 Detecting the E N D O R enhancement by pulsed excitation techniques eliminates the sensitivity of the ENDOR signal to the detailed balance between the electron and nuclear spin relaxation rates. This sensitivity is well known in CW-ENDOR experiments 4'5 and has two important consequences. First, it often precludes the observation of ENDOR signals except over a very limited temperature range. Second, the relaxation rates can determine and limit the E N D O R enhancement and the ENDOR line shapes, thereby affecting the sensitivity and resolution. In contrast, in the pulsed E N D O R experiment, the only requirements for observing an ENDOR enhancement are that (1) the electron spin phase memory time is sufficiently long to observe a free induction decay (FID) or a spin echo and (2) the time scale in which the electron spin polarization decays is comparable to or longer than the time required to flip the nuclear spin. If these conditions are satisfied, a pulsed ENDOR experiment will succeed, whereas the CW-ENDOR experiment may or may not succeed depending on the spin relaxation rates and other experimental conditions. As will become apparent in this chapter, all CW-ENDOR experiments have direct analogs in pulsed E N D O R versions. A second important motivation for developing pulsed methodology is that pulsed methods significantly increase the ability to manipulate the spin system. As has been amply demonstrated in NMR spectroscopy, this ability greatly extends the information that can be derived from a 9 G. Feher, Phys. Rev, 103, 834 (1956). l0 I. M. Brown, D. J. Sloop, et al., Phys. Rev. Lett. 22, 324 (1969). 1i p. F. Liao and S. R. Hartmann, Phys. Rev. B 8, 69 (1973). 12 W. A. J. A. v. d. Poel, D. J. Singel, et al., Mol. Phys. 49, 1017 (1983). 13 M. Mehring, P. Hofer, et al., Bet. Bunsen-Ges. Phys. Chem. 91, 1132 (1987). 14 H. Thomann, M. Bernardo, et al., "Time Domain ENDOR Studies of Disordered Solids." 29th Experimental NMR Conference, Rochester, New York, 1988. 15 A. Grupp and M. Mehring, "Modern Pulse and Continuous Wave Electron Spin Resonance Spectroscopy." Wiley, New York, 1990. J6 H. Thomann and M. Bernardo, Spectrosc. Int. J. 8, 119 (1990). 17 C. Gemperle and A. Schweiger, Chem. Rev. 91, 1481 (1991). ts H. Thomann and M. Bernardo, "Advances in Chemistry," Vol. 229. ACS Books, Washington, D.C., 1992. i9 H. Thomann and W. B. Mims, "Pulsed Magnetic Resonance: NMR, ESR, and Optics," p. 362. Oxford Univ. Press (Clarendon), Oxford, 1992.
[6]
PULSED ELECTRON NUCLEAR MULTIPLE RESONANCE
123
spectrum. 2° Examples of pulsed methods which would be extremely difficult or impossible to implement as CW-ENDOR analogs include two dimensional (2D) E N D O R ] ~'22coherence transfer ENDOR,10,23 and multiple quantum (MQ) ENDOR. 24'25 We proceed in the next section by first describing the spectrum of NMR transition frequencies typically observed for paramagnetically coupled nuclei. This is followed by sections describing the basic physical principles for pulsed techniques in electron nuclear spectroscopy. Next, we follow with a section on the experimental and instrumental considerations, providing the nonspecialist with an overview of the experimental methodology. Discussion of specific PENMR experiments with examples of applications to metalloenzymes and metalloproteins is given in subsequent sections.
2. Electron Nuclear Double Resonance Energy Levels and Transition Frequencies When the electron spin relaxation time is not sufficiently short to average the anisotropic magnetic interactions to their isotropic values, the NMR transitions for paramagnetic nuclei are spread over a wide spectral bandwidth. 2'3 This is generally the situation encountered at low temperatures (near liquid helium) where most pulsed EPR experiments on metalloenzymes must be performed. The distribution of NMR frequencies arises from the anisotropies of both the electronic g factor and the hyperfine interaction. Additional broadening can arise for quadrupolar nuclei or if the electron spin multiplicity is greater than S = ½. In the latter case the zero field splitting can lead to line broadening. 26 The interaction energy between a single electron with S -- ½ and a nucleus with the applied magnetic field and between the electron and nucleus are formally described by the spin Hamiltonian26: ~
= f l S ' g . H o - fingnI ' H o + S ' A ' I
+ I'P'I
(3)
20 R. R. Ernst, G. Bodenhausen, et al., "Principles of NMR in One and Two Dimensions." Oxford Univ. Press (Clarendon), Oxford, 1987. 21 C. Buhlmann, A. Schweiger, et al., Chem. Phys. Lett. 154, 285 (1989). 22 H. Thomann and M. Bernardo, Chem. Phys. Lett. 169, 5 (1990). 23 p. Hofer, A. Grupp, et al., Phys. Rev. A 33, 3519 (1986). 24 M. Mehring, P. Hofer, et al., Europhys. Lett. 6, 463 (1988). 25 H. Thomann and M. Bernardo, lsr. J. Chem. 32, 323 (1992). 26 A. Abragam and B. Bleaney, "Electron Paramagnetic Resonance of Transition Metal Ions." Oxford Univ. Press (Clarendon), Oxford, 1970.
124
PROBES OF METAL ION ENVIRONMENTS
[6]
where S and I are electron and nuclear spin angular momentum operators. The properties of this spin Hamiltonian and the spectra that it defines have been discussed in several general texts on EPR spectroscopy. 26-3° The first and second terms in Eq. (3) describe the interaction of the electron and nuclear spin, respectively, with the applied static magnetic field, H 0. These terms are known as the electron and nuclear Zeeman interactions, respectively. The nuclear Larmor frequency is given by vn = gnflnHo/h, where gn is the nuclear g factor which depends on the chemical identity of the nucleus, fin is a fundamental constant known as the nuclear Bohr magneton which depends on the charge-to-mass ratio of the nucleus, and h is Planck's constant. The electron Larmor frequency is defined by a similar expression except that the electron g factor for a metal typically has a large anisotropic component so that the product of g and H 0 is expressed through a matrix equation as indicated in Eq. (3). The anisotropy of the g factor is a consequence of the fact that the spin-orbit coupling imparts an orientation dependence to the quantisation axis of the electron spin. The third term in Eq. (3) describes the magnetic interaction between the electron and a nucleus. The unpaired electron generates a magnetic field at the nucleus which vectorially adds to the applied static field to produce an effective local magnetic field. The local magnetic field can comprise an isotropic component arising from the finite unpaired electron spin density at the nucleus. This is also known as a Fermi contact interaction. A finite Fermi contact interaction indicates that a covalent interaction exists between the atom hosting the unpaired electron and the nucleus. This covalent coupling need not, however, be through a direct bond. It could also arise through an indirect bonding pathway because of electron correlation effects. Because of this ambiguity the isotropic interaction is sometimes referred to as a transferred hyperfine interaction. The hyperfine coupling is also composed of an anisotropic interaction which can comprise two contributions. One is the classic through-space dipolar coupling between the electron and nucleus. The second is a quantum mechanical effect arising from the distribution of the unpaired spin density in the molecular wave function as the electron in a transition metal complex is generally not well represented as a point dipole. This anisotropy is expressed by a matrix coupling for the interaction between the electron and 27 N. M. Atherton, "Electron Spin Resonance: Theory and Applications." Halsted Press (Wiley), New York, 1973. z8 W. Gordy, "Theory and Applications of Electron Spin Resonance." Wiley, New York, 1980. 29 j. E. Wertz and J. R. Bolton, "Electron Spin Resonance." Chapman & Hall, London, 1986. 3o j. R. Pilbrow, " E P R of Transition Metal Ions." Oxford (1991).
16l
PULSED ELECTRON NUCLEAR MULTIPLE RESONANCE
125
nucleus. The energies of these hyperfine interactions can vary from a few kilohertz to tens of megahertz for ligand nuclei and to several hundred megahertz for the central metal nuclei. The hyperfine interaction with a nucleus of spin I causes each of the eigenvalues m s of S z to be split into (21 + 1) spin states labeled according to the eigenvalues m I . The allowed eigenvalues for the projection of Iz along the z axis are - I < mi < + I, where the mx differ by unity. In favorable cases, the hypeffine interaction can be observed as line splittings in the EPR spectrum. Allowed EPR transitions obey the selection rule lares] = 1 so that the splitting of each ms state into (2I + 1) levels will result in (21 + l) EPR transitions. ENDOR transitions are NMR transitions detected via an EPR transition. The hyperfine interaction generates a local magnetic field which produces a shift of the NMR resonance frequency with respect to the Larmor frequency. The frequency shifts depend on the relative orientation of the applied magnetic field with respect to the principal axis system in which the hyperfine matrix is diagonal. Expressions for the orientation-dependent ENDOR frequencies in randomly oriented transition metal complexes have been d e r i v e d . 26'31-33 In the coordinate system in which the g matrix is diagonal, the nuclear spin Hamiltonian can be written a s 33 3 ~(~n = ~ [( s ' ° A ) i i=1
(gnflnHohi)]Ii
(4)
where the nuclear spin operator I will have three components, I;, where the index i = 1, 2, 3 refers to the x, y, and z axes, respectively. The h i are unit vectors for the directions of the magnetic field expressed in spherical polar coordinates: ( h 1 , h 2 , h 3) = ( c o s qb
sin 0,
sin ~b sin 0,
cos 0)
(5)
where (0, ~b) are the polar and azimuthal angles that relate the magnetic field vector to the coordinate system in which the g-matrix is diagonal. The prime on S' indicates that S is expressed in the coordinate system in which the g matrix is diagonal. The term S' •A defines the local magnetic field arising from the hyperfine interaction. This local field will either add or subtract to the applied magnetic field depending on the eigenvalue, ms,, of S'. Expressing this orientation dependency by an orientationsl A. Schweiger, F. Graf, et al., Chem. Phys. 17, 155 (1976). 32 B. M. Hoffman, J. Martinsen, et al., J. Magn. Reson. 59, 110 (1984). s3 G. C. Hurst, T. A. Henderson, et al., J. Am. Chem. Soc. 1M, 7294 (1985).
126
PROBES OF METAL ION ENVIRONMENTS
[6]
dependent hyperfine coupling, the nuclear frequencies for S = ½ are given by t,+ = t'n ± 4 [ a ( o , 6)1
v± = 41A(O,ch)[+ t,.
(2Vn>lal;I= 4) (2~. < Ia[; I = 4)
(6)
where the subscripts refer to the NMR frequencies in the two electron spin manifolds. The expressions in Eq. (6) indicate that for a nucleus with I = 4, two ENDOR lines will be observed, one for each of the two electron spin manifolds. These lines will be displaced either about the nuclear Larmor frequency or about one-half of the hyperfine coupling depending on the relative magnitudes of these terms as indicated in Eq. (6). For the simplified case of axial symmetry, the orientation dependence of the hyperfine coupling is given by
A(O, ~b) = [i=~l(j~=lAjigj) ] 1/2
(7)
where the indices i, j = 1, 2, 3 refer to the coordinate axes x, y, and z. In most cases the microwave pulses excite only a small region of the EPR spectrum centered about the magnetic field selected. 34This magnetic field position selects a subset of molecular orientations defined by the resonance condition: hv = gflH o where the orientation dependence of the anisotropic g factor is given by
g(O' dP) = [ ~ (gihi)2]
(8)
The number of molecular orientations which contribute to the ENDOR spectrum is minimum for values of (0, ~b) that correspond to a principal axes of the g matrix. This was first reported by Rist and Hyde 35 and is referred to as g factor orientation selectivity. Higher spectral resolution is observed in ENDOR spectra recorded at magnetic field values corresponding to those values of (0, ~b) which correspond to these principal axes. These improved spectral resolution is only realized, however, if the principal axes of the g and A matrices are collinear or if the largest components of the two principal axes systems coincide. In ENDOR spectra of noncrystalline materials, a single pair of lines will only be observed if the principal axes of the g and hyperfine matrices are collinear. Otherwise, a powder pattern line shape arising from the angular dependence indicated in Eq. (7) will be obtained. According to Eqs. (4) and (8), the 34 W. B. Mires, "Electron Paramagnetic Resonance," p. 263. Plenum, New York, 1972. 35 G. H. Rist and J. S. Hyde, 52, 4633 (1970).
J. Chem.Phys.
[6]
PULSED
ELECTRON
NUCLEAR
MULTIPLE
RESONANCE
127
powder pattern will also depend on the magnetic field position within the EPR spectrum at which the ENDOR spectrum is recorded. An additional complication arises if the nuclear spin angular momentum I > ½.Then the fourth term in Eq. (3) describing the nuclear quadrupole interaction is nonzero. The nuclear quadrupole interaction describes the interaction of a nucleus with I > ½with the electric field gradients at the nucleus. These electric field gradients arise from a nonspherical charge distribution caused by the atoms in the vicinity of the nucleus. The magnitude and orientation of these gradients are determined by the electronegativity and the geometric positions of the atoms surrounding the nucleus. 36 The nuclear quadrupole interaction is described by a nuclear spin selfcoupling. The anisotropy of the quadrupole interaction is described by the quadrupole tensor, P, which is traceless so that it is fully characterized by five independent components. These are usually taken as the magnitude of the quadrupole coupling, e2qQ/h, the quadrupole asymmetry, ~, and the three Euler angles, (a, /3, y), that describe the orientation of the quadrupole tensor with respect to the principal axes of the g matrix. The quadrupole coupling constant and asymmetry parameter are related to the tensor elements by
e2qQ = 2•(2• - l)Pzz (9) exx - eyy
"0 =
Pzz
The elements Pxx, eyy, and Pzz are the principal values of the quadrupole tensor P and are defined so that Iezzl >- Ieyyl >- Iexxl. The quadrupole interaction results in additional splittings of the ENDOR lines. If the magnetic field, H0, is oriented parallel to one of the principal axes and the g, A, and P tensors are collinear, the first-order ENDOR frequencies are given by VENDOR= IAil 2 - + v "+- 3 Ieil(2m ~ + 1)
(IAI > 2v, > 3leil) (lO)
Iail b'ENDOR =
2
+ 31eil(2m I + 1) + Vn
- - Z.
(]AI > 31e,I > 2v.)
where the A i and Pi denote the principal values of the A and P tensors along the axis i. The nuclear transitions in Eq. (lO) are assumed to increase in the quantum number m I, that is, m t --~ m I + 1. 36 E. A. C. Lucken, "Nuclear Quadrupole Coupling Constants." Academic Press, London, 1969.
128
PROBES OF METAL ION ENVIRONMENTS
[6]
For an I = 1 nucleus such a s 1 4 N , four ENDOR transitions are expected. However, if the hyperfine splitting is resolved in the EPR spectrum, each mi state can be selectively excited. In this case, less than the 4 ENDOR transitions expected may be observed, depending on the mi levels involved in the EPR transition. A two-line ENDOR spectrum can be observed if the EPR transition connects the mi = 0 to mi = 0 states, whereas a four-line spectrum can be observed if the EPR transition connects either of the m I ----- - I states. A reduced number of ENDOR lines than the 41 expected can also be observed for nuclei with I > 1 if the individual EPR transitions can be irradiated. 3. Basic Principles of Sublevel Polarization Transfer A distinguishing feature of the pulsed electron nuclear multiple resonance experiments discussed in this chapter is that no Mx,y component of the electron spin magnetization is present when the rf pulses are active. We consider the effect of the rf pulses on the NMR transitions only as far as these NMR transitions affect the electron spin polarization M z . It is also possible to observe an ENDOR signal ifMx,y magnetization is finite during this time. 1°'13 Such experiments are known as coherence transfer pulsed ENDOR experiments. Interesting aspects of the quantum mechanical properties of magnetic dipole transitions have been observed by coherence transfer pulsed ENDOR. 13 However, coherence transfer ENDOR studies are experimentally more demanding than sublevel polarization transfer ENDOR. The line widths in coherence transfer are also generally broader than observed in polarization transfer experiments because of the short electron spin phase memory times. For these and other reasons, only polarization transfer ENDOR experiments have been applied in metalloprotein studies. We now describe the details of pulsed ENDOR experiments where the transverse components of the electron spin magnetization Mx,y -- 0 during the polarization transfer step of the pulse sequence. A simple four-level system will suffice to describe the basic principles of sublevel polarization transfer techniques. The sublevel polarization transfer principles described in this section are the basis for all pulsed ENDOR experiments. These are the pulsed analogs of the CW-ENDOR experiment. The principles of sublevel polarization transfer also form the basis for a wide variety of more complex pulsed electron nuclear multiple resonance techniques. 15-19,21-25 The two most commonly used pulse sequences for the sublevel polarization transfer experiment, shown in Fig. 1, were proposed by Mims s and Davies. 37 In both cases a single if pulse is applied to excite NMR 37 E. R. Davies, Phys. Lett. A 47, 1 (1974).
[6]
PULSED
ELECTRON
NUCLEAR
MULTIPLE
RESONANCE
129
I I I
tTw-q H-
i m NMR
b t~w--I b--
+gml
mA
b-~-q
NMR I
'+ Preparation I
"I
I
Mixing
~t
Detection
FIG. 1. Davies ENDOR (a) and Mims ENDOR (b) pulse sequences.
transitions. As shown below, this NMR transition corresponds to a transfer of spin polarization between two spectral positions in the EPR spectrum. In the pulse sequence proposed by Mires, the nuclear spin flip interferes with the refocusing of a stimulated electron spin echo. In the pulse sequence proposed by Davies, the nuclear spin flip modifies the intensity of an electron spin echo. In both cases, the reduction of the primary or stimulated electron spin echo is a consequence of sublevel polarization transfer. It is useful to divide the pulses into conceptual periods, as indicated in Fig. 1, similar to the procedure used in modern pulsed NMR spectroscopy. 2° In the preparation period, sublevel polarization is created from the electron spin longitudinal polarization. In the mixing period, this polarization is transferred between two positions in the EPR spectrum which are split by the hyperfine coupling. This time period could therefore more accurately be referred to as the polarization transfer period, but we retain the term mixing in order to be consistent with the NMR literature. The purpose of the detection period is self-explanatory; it is to observe the effects of the pulses on the spin system in the periods preceding the detection period. It is assumed in the discussion below that the reader is familiar with certain concepts in magnetic resonance, namely, (1) the concept of the rotating frame, (2) the response of the spins to pulsed excitation, (3) the
130
PROBES OF METAL ION ENVIRONMENTS
[6]
concept of spin polarization, and (4) the concept of spin coherence. A comprehensive discussion of these topics can be found in any general text on magnetic resonance. 3.1. P r e p a r a t i o n P e r i o d : S u b l e v e l P o l a r i z a t i o n T r a n s f e r
In all the pulsed ENDOR experiments we consider in this chapter, one or two microwave pulses are applied in the preparation period to create a sublevel nuclear spin polarization. This sublevel nuclear spin polarization is created from the electron spin polarization owing to the equilibrium distribution of spins among the electron Zeeman spin energy levels. Because geflHo >>g n f l H o , the dominant contribution to the electron spin polarization is from the electron Zeeman interaction, AE = hv = g d 3 H o . At the magnetic field strengths at which ENDOR experiments are performed, the polarization arising from the nuclear Zeeman and hyperfine interactions is negligible compared to the electron polarization and is ignored. The ratio of spins in the upper, N u , and lower level, Nl, electron Zeeman spin energy levels is given by the Boltzmann relation: 1 - (gBHo/kT) = 1 - 8
Nu = N l e x p ( - g ~ H o / k T ) - - ~
(11)
where the total number of spins N = Nl + Nu. When the electron is coupled to nuclei, the polarization is distributed over the hyperfine sublevels in each electron spin manifold. Referring to the four-level system in Fig. 2, at the start of the pulse sequence the electron spin polarization is given by AP14 + AP23 = 8/2 + 8/2 = 8. Each box in Fig. 2 represents the electron spin polarization corresponding to 8/2.
a
E4~
b
c
\
E3
E2 E1 Preparation
Mixing
Detection
FIG. 2. Energy level diagram for the interaction of one-electron with one I = ½nucleus showing the transfer of spin populations during the preparation, mixing, andMetection periods of the Davies ENDOR sequence.
[6]
PULSED ELECTRON NUCLEAR MULTIPLE RESONANCE
131
Sublevel polarization will be created if at the end of the preparation period not all EPR transitions have been equally excited. In the case of single-pulse excitation, this is accomplished by selectively inverting the spin populations on a subset of EPR transitions. In our example of the fourlevel system, let us suppose that a microwave pulse selectively excites the EPR transition E1 ~ E4 in Fig. 2. For the present purposes, we can treat this transition as if it were an independent two-level system. If the excitation pulse applied to the EPR transition E~ ~ E4 is a rr pulse, the electron spin polarization for this effective two-level system will change sign. The polarization of the four-level system immediately after the selective microwave excitation pulse is shown in Fig. 2b. Notice that now API4 --k- ~ 2 3 = - 8 / 2 71- 8/2 = 0. An EPR spectrum recorded immediately following the selective excitation pulse would have one emission peak and one normal absorption peak. For the analysis of the ENDOR experiment, we examined the spin polarization in the hyperfine sublevels. Before the microwave preparation pulse, the spin polarization in both hyperfine sublevels is: AP~2 = 0, AP34 = 0. After the pulse, A P I z = - 8 / 2 and AP34 -- - 8 / 2 . The selective excitation of the microwave preparation pulse has resulted in a transfer of the electron spin polarization to sublevel spin polarization. We refer to sublevel spin polarization to distinguish from nuclear spin polarization. Sublevel spin polarization is more precisely described as longitudinal electron nuclear two-spin order. In contrast, nuclear spin polarization is not a function of the electron spin states. 17'2° The sublevel spin polarization has been referred to as nuclear spin alignment in order to avoid confusion with nuclear spin polarization. 13,15 Sublevel polarization can also be created using two microwave pulses in the preparation period, as shown in the pulse sequence of Fig. lb and first demonstrated by Mims. 8 One advantage of using a two-pulse excitation is that the microwave pulses need no longer correspond to selective EPR excitations. After a first thought it might appear that nonselective pulses could not produce sublevel polarization. In fact, no sublevel polarization is present immediately following the first pulse. However, if the pulses are 7r/2 pulses, then during the time z following the first pulse, the local magnetic field arising from the hyperfine coupling will cause the Mx,y components of the magnetization corresponding to the two spin packets (of the two EPR transitions) to accumulate different phase factors. After a time ~"this accumulated phase is stored along the z axis by applying the second ¢r/2 pulse. After this second pulse, the electron spin polarization, [APl4 + AP23] is modulated by the terms cos(A~'/2) cos(f~:'), whereas the periodicity of sublevel polarization, [API2 + AP34] is now given by sin(A~'/2) sin(f~:-). Note that the creation of sublevel polarization also requires a resonance offset, denoted by f~s. Note also that no sublevel
132
PROBES OF METAL ION ENVIRONMENTS
[6]
polarization exists if the product Az/2 = mr, where n = 0, I, 2, etc. 8 These are known as blind spots in the Mims ENDOR experiment. 8 Their significance will become apparent below.
3.2 Mixing Period: Sublevel Polarization Transfer After the sublevel polarization has been created in the preparation period, an rfpulse is applied in order to transfer this sublevel polarization to another hyperfine sublevel. This transfer is accomplished by inducing a nuclear spin flip, that is, an NMR transition. We can treat the magnetization from the two sublevels, E 3 and E 4 , and E 1 and E 2 , as pairs of isolated two-level systems. The sublevel population difference AP34and AP~2 created in the preparation period then corresponds to longitudinal sublevel magnetization, Mz(34) and Mz~12) , for these sublevels. For the example in Fig. 2, we have selected the frequency of the rf mixing pulse to be on resonance with the sublevel transition E 3 ~ E 4. The rf pulse will transform the longitudinal component, Mz(34 ) of this sublevel magnetization to Mz~34) cos OR. The nutation angle, OR equals yneH2tp, where Yn is the nuclear gyromagnetic ratio,/-/2 is the rf magnetic field intensity, and tp is the rf pulse length. Note that the sign of the nutation angle can be positive or negative since ~n can be positive or negative. The factor e takes into account the enhancement of the nuclear transition rate owing to the electronic magnetic field at the nucleus. This electronic field arises from the hyperfine interaction, z6 When OR = 7r, Mz(34 ) is transformed from - M z ( 3 4 ) t o +Mz(34 ) . This corresponds to the transformation of (AP34) to -(AP34) as indicated in Fig. 2c. After an rf 7r pulse, the electron spin polarization is now AP~4 + AP23 = 0, while the net sublevel polarization is AP12 + z ~ 3 4 = 0. In this simple four-level system, this nuclear spin flip corresponds to the transfer of electron polarization from one EPR line (the transition El ~ E4) to the second EPR line (the transition E: ~ E3). An EPR absorption spectrum collected after the rf rr pulse is applied would show no absorption from either transition. In fact, this polarization transfer could in principle be detected by sweeping (with the microwave frequency) through the EPR absorption spectrum. In practice, it is easier to detect it from the change in amplitude of an electron spin echo.
3.3. Detection Period The transfer of polarization can in principle be detected by any method for observing the EPR transitions. This includes sweeping the EPR absorption such as in conventional EPR, observing the free induction signal using a single microwave pulse, observing the electron spin echo intensity,
[6]
PULSED ELECTRON NUCLEAR MULTIPLE RESONANCE
133
or directly reading the longitudinal magnetization. Direct detection of the longitudinal polarization requires special instrumentation. 38'39 Likewise, detection using low-power continuous wave excitation requires a more complex instrumental setup capable of performing both pulse and continuous wave EPR experiments. The most common method for reading out the electron polarization is to observe the amplitude of a primary electron spin e c h o 37 o r of a stimulated echo. 8 It is also possible to detect the FID following single-pulse excitation. 4° However, for samples with extremely broad inhomogeneous EPR lines such as is usually observed for transition metals in proteins and enzymes, the FID decays within the dead time of the receiver.
4. Amplitudes in Pulsed Electron Nuclear Double Resonance Spectra The amplitudes in the ENDOR spectra are determined by the transition probabilities that depend on the spin Hamiltonian parameters and also on experimental parameters that depend on the details of the experiment. In this section we describe how the various experimental parameters of the pulse sequence affect the amplitudes in the pulsed ENDOR spectrum. The experimental parameters selected for the preparation, mixing, and detection periods must each be considered for a quantitative analysis of the ENDOR amplitudes. In most cases the effects of the experimental conditions on the ENDOR amplitudes, EA(v+), can be considered separately for each pulse period so that the final amplitudes can be expressed by the following product relation: EA(v±) = P(A, Ap) M(~) D(A, Ap, z)
(12)
where P, M, and D represent the functions that determine the ENDOR amplitudes in the preparation, mixing, and detection periods, respectively. The arguments of the functions in each case indicate the dominant contributions to the ENDOR signal amplitude in each period. A more detailed analysis of each of these periods is discussed below, but first we must consider the more complex spectra usually encountered for frozen solutions of transition metals in enzymes and proteins. In this case, the discussion of the simple four-level model must be expanded to include the effects of inhomogeneous line broadening.
38 G. Whitfield and A. G. Redfield, Phys. Rev. 106, 918 (1957). 39 A. Schweiger and R. R. Ernst, J. Magn. Reson. 77, 512 (1988). 4o T. Wacker and A. Schweiger, Chem. Phys. Lett. 191, 136 (1992).
134
PROBES OF METAL ION ENVIRONMENTS
[6]
4.1. lnhomogeneously Broadened Electron Paramagnetic Resonance Lines: Hole Burning One way to envision an inhomogeneously broadened spectral line is to consider the overlap of many pairs of lines, each arising from the EPR transitions in a four-level system, but where each four-level system is characterized by a slightly different hyperfine interaction. If a sufficient number of transitions overlap in the ESR spectrum, no individual lines will be resolved, and the overall line shape will approach a single line with a Gaussian line shape profile. In inhomogeneously broadened lines a saturation hole can be "burned" into the line shape by the microwave excitation pulse(s). The width, tp, of the microwave pulse determines its bandwidth in the frequency domain. For a square pulse, this frequency is roughly given by Ap ~- 1/tp. A hole will be burned into the line if Ap is less than the line width. The ability to burn a hole into an absorption line in magnetic resonance and in optical spectroscopy is in fact often taken as an indication that the absorption line is arising from inhomogeneous rather than homogeneous broadening mechanisms. Homogeneous broadening arises from lifetime broadening, as opposed to static (time-independent) broadening mechanisms which contribute to inhomogeneous line broadening. An example of a saturation hole burned into an inhomogeneously broadened ER line shape is illustrated in Fig. 3a. The spin packets at the center of the saturation hole are on-resonance and in the example of Fig. 3a are shown to have an inverted electron spin polarization following the excitation pulse. Those spin packets far away from the center of the saturation hole, that is, far away from the resonance condition, are not affected by the excitation pulse. The profile of the saturation hole describing the connection between the on-resonance spin packets whose polarization is inverted and the off-resonance spin packets whose polarization is unaffected by the pulse is determined by several factors. In practice, the transmitter pulses generally do not have ideal rectangular pulse shapes. The finite probe Q tends to broaden the sharp transitions of a rectangular pulse. Furthermore, spin dynamics mechanisms, such as spectral and instantaneous diffusion, also broaden the excitation profile. Although such spin dynamics mechanisms may not be significant on the short time scale of the microwave excitation pulse in the preparation period, they usually become significant over the longer time scale during which the rf pulse is applied. As result of these complications, the magnetization profile excited by a microwave pulse can to a first approximation be described by a Lorentzian function41: 4J W. B. Mims, K. Nassau, et al., Phys. Rev, 123, 2059 (1961).
[6]
PULSED ELECTRON NUCLEAR MULTIPLE RESONANCE
135
a
b
FIG. 3. EPR spectra of an inhomogeneously broadened line showing the saturation/ inversion " h o l e " after the preparation period in the Davies E N D O R (a) and the Mims E N D O R (b) pulse sequences.
P(A, Ap) = 4(v_+ -
Vn)2/[4(1.'+ -- Vn)2 + (2Ap) 2]
(13)
where P(A, Ap) represents the sublevel spin polarization and dip is the width of the Lorentzian hole. Under limiting conditions in which ideal ~r/2 and ~r pulses are assumed, the width can be related to the microwave magnetic field intensity: Ap = gefleHl/h, where H~ is the magnitude of the microwave magnetic field intensity. A hole can also be burned into the inhomogeneous absorption line using two microwave pulses in the preparation period, as shown in the pulse sequence of Fig. lb. The pattern of electron polarization created by the pulses is shown in Fig. 3b. For the two-pulse excitation, the polarization described by Eq. (13) [or Eq. (14)] is multiplied by the function cos(2zrAff) where Ai is the hyperfine coupling of the jth nucleus. 8 This creates a sawtooth pattern of electron spin polarization that is superimposed onto the saturation hole burned into the inhomogeneously broadened EPR.
4.2. Preparation Period: Hyperfine Contrast Selectivity In the case of the inhomogeneously broadened EPR line, the NMR transition in the mixing period corresponds to the transfer of polarization from within the hole burned into the EPR line in the preparation period
136
PROBES OF M E T A L ION E N V I R O N M E N T S
[6]
to another part of the EPR spectrum. Thus, the sublevel transition, i.e., the polarization transfer, corresponds to a displacement, Ad , of the polarization within the EPR spectrum. If the displacement remains entirely within the saturation hole, no change in EPR signal intensity can be observed. For a preparation consisting of single-pulse excitation, this means that the displacement of the electron spin polarization must be greater than Ap/2. Of course polarization can only be transferred if the rf matches a hyperfine sublevel transition. This establishes the important criterion that A > Ap/2 in order to observe an ENDOR signal in the Davies E N D O R experiment. Nuclei with hyperfine couplings A ~ Ap/2 will not contribute to the E N D O R spectrum.16'37'48 Because the width Ap of the saturation hole determines the minimum hyperfine coupling that can be observed, the choice of the preparation pulse conditions imposes a selectivity on the magnitude of the hyperfine couplings that will be observed in the ENDOR spectrum. This is known as hyperfine contrast selectivity and can be used to suppress selectively E N D O R amplitudes for nuclei with small hyperfine couplings. As shown in Section 5, this can be useful if ENDOR lines from nuclei with smaller and larger hyperfine couplings overlap in the ENDOR spectrum. The effect of the hyperfine contrast selectivity mechanism on the amplitude of the Davies E N D O R lines can be placed on a more semiquantitative basis by substituting the expressions for the hyperfine coupling (see Section 2) into Eq. (13). Substituting into Eq. (13) we have
P(A, Av) = A2/[A2 + (2Ap)2]
(14)
According to Eq. (14), P(A, Ap) decreases continuously from unity when Ap = 0 to P(A, Ap) = 1 when Ap ~ ~. The ENDOR signal intensity is determined not only by the excitation conditions in the preparation period but also by the excitation conditions in the detection period. The ENDOR signal intensity can be expressed by the product of P(A, Ap) with D(A, Ap) where D (A, Ap) represents the detection period. 47 While the explicit expressions for D(A, Ap) depend on the details of the detection pulses used, the functional form for D(A, Ap) is similar to P(A, Ap) but with an additional Ap in the numerator. For the present discussion, it is sufficient to note that D(A, Ap) increases from 0 when Ap = 0 to D(A, Ap) ~ 1 when Ap = ~ ~. The maximum ENDOR signal is obtained when the product P(A, Ap) D(A, Ap) reaches a maximum. 42'47'48 This maximum occurs at the crossover point between the decreasing function P(A, Ap) and the increasing function D (A, Ap) and is obtained when A = 2A~. The microwave excitation pulse intensity can therefore be adjusted to enhance or suppress E N D O R lines selectively depending on the magnitude of the hyperfine coupling. 42'47'48
[6]
PULSED ELECTRON NUCLEAR MULTIPLE RESONANCE
137
Note that because A = 2(v_+ - v,), the hyperfine contrast selectivity mechanism is not dependent on the type of nucleus, that is, on gn, but only on the difference between the ENDOR frequencies and the nuclear Larmor frequency. The mechanism for hyperfine contrast selectivity is therefore neither a homonuclear nor a heteronuclear suppression effect as has been suggested in the literature. 42 It is therefore not correctly described as a proton suppression technique. This is evident in the Davies ENDOR spectra of stellacyanin (see Section 6), where the proton ENDOR signals from the methylene protons on the thiolate ligand which have large A values are in fact enhanced and not suppressed under preparation pulse conditions that suppress the protons with small A values. The two-pulse excitation imposes an additional constraint for observing ENDOR signals. For a preparation period consisting of two-pulse excitation, the condition on the polarization displacement i.e., the maximum ENDOR effect, is obtained for z = (2n + 1)~r/A and is zero for r = 2 n r t / A where n = 0, 1, 2, etc. s The latter correspond to the blind spots in the Mims ENDOR experiment mentioned above. We see that for two-pulse excitation, the condition that A > AJ2 is relaxed, but at the expense of introducing blind spots at periodic intervals in the hole burned into the EPR line. The Mims ENDOR experiment offers excellent sensitivity for detecting ENDOR lines from nuclei with small hyperfine interactions. In the Mims ENDOR experiment, the interpulse delay time z determines the relative amplitudes of the ENDOR transitions. The amplitudes of weakly coupled nuclei are suppressed the least by choosing large values of z because this creates a sawtooth pattern where the "teeth" are more closely spaced. A direct comparison between the ENDOR amplitudes in the Davies and Mims experiments recorded under similar microwave excitation pulse conditions is shown in Fig. 9 for a blue copper protein, stellacyanin (see Section 6. I). The Mires ENDOR spectrum (Fig. 9a) was recorded using microwave excitation pulses of 0.05/zsec and r = 0.30/zsec. This Mires spectrum may be contrasted with the Davies ENDOR spectrum (Fig. 9b), which was recorded with a similar microwave excitation pulse width. Note that the weakly coupled protons dominate the Mims ENDOR spectrum, whereas the ENDOR signals from these protons are completely suppressed in the Davies ENDOR spectrum. The Mims ENDOR experiment is also more effective in detecting ENDOR signals from nuclei that have both small g. and small hyperfine coupling values. For example, an 14N nucleus with a very small hypertine coupling such that A ¢ 2Ap can be more readily detected by Mims ENDOR 42 p. E. Doan, C. Fan, et al., J. Magn. Reson. 95, 196 (1991).
138
PROBES OF METAL ION ENVIRONMENTS
[6]
because the Davies experiment would require a very long preparation pulse length. In the Mims experiment short pulse widths can be used by choosing a long interpulse delay time, r. Weakly coupled laN nuclei have been detected in Mims ENDOR studies of model copper complexes 43 and for nitrogen ligands coupled to an iron-sulfur center in the enzyme hydrogenase. 44 A direct comparison of the NMR transitions detected by electron spin echo envelope modulation (ESEEM) and stimulated echo ENDOR spectroscopies has been reported 43'44 and is discussed in Section 8. One complication of the Mims ENDOR experiment involves the blind spots where no E N D O R effect is observed. On the other hand, these blind spots can aid in the assignment of hyperfine coupling values. The n = 1 blind spots are indicated by the arrows in Fig. 9a. The blind spots can be easily identified by recording several spectra using different r values. The upper bound on r will be determined by the electron spin phase memory time, which (at liquid helium temperature) is usually on the order of 2-3 /zsec for metalloproteins. The lower bound on the usable ~"is determined by the spectrometer dead time.
4.3. Mixing Period: Hyperfine Enhancement Factor The dependence of the ENDOR amplitudes on the polarization transfer step in the mixing period can be expressed by
M(v-+) = ½[1 - COS(0R_+)]
(15)
where OR_+ = yeffB2t~ is the Rabi nutation angle, 45 yeff is the effective nuclear gyromagnetic ratio in which the hyperfine enhancement factor is taken into account, B2 is the rf magnetic field intensity, and trf is the rf pulse length. The qualifier --- on R in OR_+refers to the two electron spin manifolds corresponding to the eigenvalues, ms. For simplicity, we drop this qualifier in subsequent discussions below. The effective nuclear gyromagnetic ratio is related to the nuclear gyromagnetic ratio by the hyperfine enhancement factor, e. For an isotropic hyperfine interaction, A, the enhancement factor is given by 26 e = I1 + msA/val
(16)
where v, is the nuclear Larmor frequency. For proton A values typically encountered in metalloenzyme ENDOR studies, the enhancement factor 43 E. J. Reijerse, N. A. J. M. v a n Earle, eI al., J. Magn. Reson. 67, 114 (1986). H. T h o m a n n , M. Bernardo, et ai., J. A m . Chem. Soc. 113, 5911 (1991). 45 I. I. Rabi, Phys. Rev. 51, 652 (1957).
[6]
139
PULSED ELECTRON NUCLEAR MULTIPLE RESONANCE
.
0
.
.
.
.
.
.
.
.
.
.
.
.
.
.
.
.
.
.
.
.
.
.
.
.
.
.
.
I
I
5
10
.
.
.
.
.
.
.
.
.
.
.
.
.
.
.
.
.
.
.
.
.
.
.
.
.
.
.
.
.
.
.
.
.
.
.
.
.
.
.
I
1;
2'0
25
t~ Us) FIG. 4. Transient nutation patterns showing the Rabi oscillation frequencies at two positions in the ENDOR spectrum of stellacyanin at g = 2.10 and r = 0.23 tzsec. Other experimental conditions are as in Fig. 8b. The ordinate axis, AX, is the difference in EPR signal intensity with and without the rf pulse.
is in the range 0 < e < 2. Nitrogen nuclei directly bound to a metal ion can have large hyperfine interactions so that the enhancement is typically in the range 2 < e < 20. As discussed below, significant effects on the ENDOR amplitudes will be observed if e ~ I. The nutation of the sublevel magnetization can be observed using either the Davies or Mims ENDOR pulse sequences by either incrementing the rf magnetic field intensity in a stepwise manner or by incrementing the rf pulse length on successive pulse sequence iterations) 3'46'47 If the pulse length is incremented, the nutation of the nuclear magnetization will be superimposed on the time-dependent signal arising from the loss of the electron spin polarization. The latter is a consequence of the electron spin-lattice relaxation or spectral diffusion mechanisms. The effect of electron polarization decay during the mixing time can be removed by digital filtering or by subtracting the ENDOR signal obtained by repeating the Davies or Mims pulse sequence with the rf power set to zero on alternate pulse sequence iterations. 46 C. Gemperle, A. Schweiger, et al., Chem. Phys. Lett. 145, 1 (1988). 47 p. Hofer, "Development of Pulsed ENDOR and Applications to Polyacetylene." Ph.D. Thesis. Stuttgart, 1988.
140
PROBES OF METAL ION ENVIRONMENTS
[6]
Exam[ales of transient nutation patterns showing the Rabi oscillation frequencies at two positions in the E N D O R spectrum of the blue copper protein stellacyanin are shown in Fig. 4. The first maximum in each waveform corresponds to the maximum polarization transfer, which is obtained when OR = rr. The sudden decrease in the signal intensity at the end of each waveform is a direct measurement of the signal baseline. When the baseline is directly measured, the advantage of measuring the transient nuclear nutation by subtracting the signal with rf power on from the signal with no rf power is that the absolute ENDOR enhancement can be measured. From Fig. 4 it is evident that the polarization transfer, and therefore the ENDOR amplitude, is reduced for OR < 7r and for OR > zr. However, the loss in signal amplitude is very small for OR > 7r. Note also that the Rabi oscillations are rapidly dampened for OR> ~'. This damping can arise from a combination of effects including nuclear spin relaxation during the rf pulse, rf magnetic field inhomogeneity, and dephasing caused by the destructive interference between signals arising from a distribution of E N D O R frequencies. The latter is expected if the ENDOR line is inhomogeneously broadened. Multiple Rabi oscillation periods can be observed if the E N D O R line is narrow and therefore sustains little or no inhomogeneous broadening. 16-18,48 Davies and Mims E N D O R spectra are typically recorded using a fixed rf power level and rf pulse length. ENDOR spectra are often recorded over a wide frequency range encompassing many different types of nuclei with a wide range of hyperfine coupling magnitudes. The frequency-dependent nuclear nutation angle arising from the hyperfine enhancement is then directly manifest in the relative ENDOR amplitudes. This becomes evident by considering the effective flip angles, 0Reft, for protons and nitrogen nuclei. Suppose the proton and nitrogen nuclear Larmor frequencies are 13 and 1 MHz, respectively. If OR = ~r at 13 MHz, then for a proton hyperfine coupling of 10 MHz, ORelf is equal to 0.627r and 1.387r in the two electron spin manifolds. Assuming the same rf pulse length and/42 intensity for the nitrogen as for protons, the flip angles for nitrogen are multiplied by TN/3'H ~ 0.07. For a nitrogen hyperfine coupling of 36 MHz, OReff is 1.237r and 1.37w, whereas for a nitrogen coupling of 18 MHz, ORelf is 0.58zr and 0.72zr. This is in good agreement with the approximately 2:1 intensity ratio observed for the two nitrogen E N D O R lines in the spectrum of stellacyanin shown in Fig. 8b. The intensity of the proton ENDOR lines for the 48 H. Thomann and M. Bernardo, "Pulsed ENDOR Methods for Metalloproteins and Enzymes." Annual Rocky Mountain Conference on Applied Spectroscopy, Denver, Colorado, 1990.
[6]
PULSED ELECTRONNUCLEARMULTIPLERESONANCE
141
thiolate methylene protons are lower than expected because of hyperfine anisotropy. The nitrogen and proton ENDOR lines are approximately equal in intensity for Davies ENDOR spectra recorded at gy as shown in Fig. 12b. 4.4. D e t e c t i o n P e r i o d
Although in principle a variety of schemes could be used to detect the electron spin polarization, in practice spin echo or stimulated echo detection is normally used for metalloprotein studies. The echo intensity depends on several factors, which can be expressed as D(A, Ap, ~-) = [Em(,r)][Emod(~-)]
(17)
4.4.1. Electron C o h e r e n c e Effects. The first term, Em(z), in Eq. (17) expresses the fact that the echo is detected at finite interpulse delay times, ~', during which the echo intensity will be reduced by irreversible dephasing mechanisms. The reduction in echo intensity is described by the phase memory decay time, Tm, which is defined as the time for the echo signal to fall to roughly 37% (e- 1) of its initial value at z = 0. In most metalloproteins, Tm is on the order of 2 to 3/zsec. The explicit consideration of the phase memory effects becomes important if Tm is not constant for all ENDOR lines in the spectrum. This could arise, for example, if ENDOR lines from more than one electron radical site contribute to the ENDOR spectrum and the radical sites do not have the same Tm values. 4.4.2. E l e c t r o n N u c l e a r C o h e r e n c e Effects. The second term, Emod(Z), in Eq. (17) expresses the fact that, if nuclear modulation is present, the spin echo envelope intensity may be a periodic function of the interpulse delay time, z. The observations of nuclear modulation of the echo envelope intensity requires the coherent excitation of both semiforbidden and allowed EPR transitions. 49 The echo envelope will be modulated with the periodicity of the v+, u_ ENDOR frequencies as well as the sum and difference of these frequencies. As the simplest example, we consider an electron coupled to a nucleus with I = ½. The echo envelope intensity is then described by 49
Emod('r) -=- 1 -- k/2 - k/2{cos(27rv+ ~') + cos(2~'v_ r) - ½cos[(27rv+ + 2~'v_)r] - ½cos[(27rv+ - 2Try )~']} (18) where v+ and v_ are the hyperfine frequencies in the two electron spin manifolds. The modulation depth factor, k, is given by k = [27ru,B/(21rv+)(27rv_)] 1/2
where B = (1/h)(gegd3d3,)(3 cos 0 sin O)/r 3. 49W. B. Mims, Phys. Rev. B 5, 2409 (1972).
(19)
142
PROBES OF METAL ION ENVIRONMENTS
[6]
If the nuclei are not coupled to each other, the modulation for more than one nucleus is given simply by the product OfEmodfor the individual nuclei: Em~
= [Ij[Emod(/j)]
(20)
which contains the modulation frequencies for the individual nuclei as well as combination frequencies from the product. A quantitative description of the nuclear modulation of the electron spin echo envelope usually requires consideration of additional interactions such as the nuclear quadrupole interaction for nuclei with I > ½and must include orientational averaging and orientation selectivity effects. 5° Our focus in this chapter is not, however, a quantitative description of the nuclear modulation phenomenon but rather the manifestation of the nuclear modulation phenomenon in the pulsed ENDOR spectrum. 4.4.2.1. Hyperfine correlation. The most trivial situation that can be encountered if nuclear modulation is present is if all ENDOR lines in the ENDOR spectrum are equally modulated in amplitude for ENDOR spectra recorded for different ~" values of the spin echo delay in the detection period. A somewhat less trivial but important situation arises if only a subset of ENDOR lines are amplitude modulated by the electron spin echo envelope modulation function. 5~ This situation can be encountered, for example, if ENDOR lines from two different electron radical sites contribute to the ENDOR spectrum but only one of the radical sites has an additional nucleus giving rise to the nuclear modulation of the electron spin echo envelope. The nuclear modulation effect can in fact be used as a spectral editing technique as discussed in Section 9 on ESEEMedited ENDOR. 4.4.2.2. Partial excitation. In some cases it is possible that the microwave pulses in the detection period coherently excite both the allowed and semiforbidden EPR transitions associated with an NMR transition in one electron manifold while the ENDOR transition is detected for the NMR transition from the same nucleus in the second electron spin manifold. This situation can be encountered for protons, where the hyperfine interaction is large and of the order of A ~ 2vn . It is then likely that the one sublevel will give rise to electron spin echo envelope modulation (ESEEM), whereas the other sublevel will only be observed as an ENDOR transition. For example, the amplitude of the v+ ENDOR line in Davies ENDOR spectra recorded at several values of ~" will then be amplitude modulated with periodicity cos[2zr(v_)7]. If the modulation arises from more than one nucleus, then the relative amplitudes in the ENDOR spectrum can depend on the periodicity of the ESEEM frequencies for the 50 S. Dikanov, "Electron Spin Echo Spectroscopy." CRC Press, Boca Raton, Florida, 1992. 51 H. Thomann and M. Bernardo, Chem. Phys. Lett. submitted (1993).
[6]
PULSED ELECTRON NUCLEAR MULTIPLE RESONANCE
143
individual nuclei as well as on the combination frequencies that arise from the product function in Emoa-
4.4.3. Orientation Selectivity by Electron Spin Echo Envelope Modulation. The nuclear modulation effect can also influence the pulsed ENDOR spectrum by another mechanism. The spin echo modulation depth and frequency are functions of the anisotropic hyperfine interaction and of the nuclear quadrupole interaction i f / > ½. Usually the nucleus responsible for the nuclear modulation signal is not the same nucleus that is responsible for the ENDOR signal. Both nuclei can of course be part of the same paramagnetic molecule, with each nucleus described by a hyperfine and quadrupole interaction tensor. However, the orientation and magnitudes of the hyperfine and quadrupole tensors for the nucleus responsible for the nuclear modulation will in general not be the same as for the nucleus responsible for the ENDOR signal. As an example consider the simplified case that the electron-nuclear hyperfine coupling is purely dipolar. The ENDOR frequencies are then given by 27rv+ = [ ( B / 2 ) 2 + (Aft2 + 27rVn)2] 1/2 2try_ = [ ( B / 2 ) 2 + (Aal2 27"gl)n)2]1/2 -
(21a) (21b)
where Aa = (1/h)(g~ gj3d3n)(3 cos 2 0 - 1)/r3, r being the distance between the electron and nucleus and 0 the angle between the magnetic field H0 and the vector pointing from the electron to the nucleus, and the parameter B was defined in Eq. (19). Because the ESEEM spectrum and the echo envelope waveform are Fourier transform pairs, selecting a particular r value in the spin echo readout period corresponds to the selection of an orientation or range of orientations in the ESEEM spectrum. This selects a corresponding set of orientations for the nuclei contributing to the ENDOR spectrum. The orientation selected for each nucleus depends on the anisotropy of the hyperfine interaction and on the relative orientations of the hyperfine and quadrupole tensors.
5. Experimental and Instrumental Considerations In this section we describe some practical considerations concerning the performance of pulsed electron nuclear experiments. When properly designed, a spectrometer used for pulsed ENDOR experiments can also be utilized for electron spin echo experiments, particularly ESEEM spectroscopy. Experimental considerations for electron spin echo spectroscopy have been discussed by Mims. 33,s2,s3As we illustrate in this chapter, s2 W. B. Mims and J. Peisach, "Biological Magnetic Resonance." Plenum, New York, 1981. 53 W. B. Mims and J. Peisach, "Advanced EPR Techniques, Applications in Biology and Biochemistry." Elsevier, Amsterdam, 1989.
144
PROBES OF METAL ION ENVIRONMENTS
[6]
tlator ~
~
~ero~
FIG. 5. Block diagram of a pulsed electron nuclear multiple resonance spectrometer.
several new experiments require the capability for performing both ESEEM and pulsed ENDOR experiments. A block diagram of a pulsed multiple resonance spectrometer capable of performing the experiments described in this chapter is shown in Fig. 5. Important experimental and instrumental considerations are described below.
5.1. Time Scales
It is essential that the EPR and NMR transitions occur on a time scale short compared to the electron and nuclear spin relaxation times, respectively. This criterion dictates the conditions for the time scales of the microwave (mw) and rfpulses. As discussed further below, this condition also affects the temperature at which experiments can be performed. The microwave pulses must be short compared to the electron spin phase memory time, Tm. Tm characterizes the decay of the transverse magnetization. Mx,y. Spin packets that have dephased during the time the pulse is applied will not contribute to the detected signal at the end of the pulse sequence. This has the effect of reducing the overall signal-to-noise ratio in the experiment. At liquid helium temperatures (4 K), the electron spin phase memory time, Tin, for transition metal ions with one unpaired electron (i.e., spin ½) in frozen solutions of metalloenzymes is determined by the random
[6]
PULSED ELECTRON NUCLEAR MULTIPLE RESONANCE
145
nuclear spin flip-flops of the abundant protons in the protein. This random field is fairly consistent from one protein to another so that the T~n value observed is consistently on the order of 2 to 3/xsec. The phase memory times rapidly decrease with increasing temperature. In most cases, the electron spin echo signal can only be observed up to about 25 K. For electron spin echoes to be observed, the microwave pulses should be on the order of a few hundred nanoseconds. To adjust the bandwidth of the hole burned into the EPR line by the preparation pulse, the microwave pulses should also be independently adjustable in time increments of 0.05 /zsec or less. This fine tuning of the width of the microwave pulses provides flexibility in experimental design. An example of where such pulse width adjustments are necessary arises when taking advantage of hyperfine contrast selectivity mechanisms as a spectral simplification method, as discussed in Sections 4 and 6 of this chapter. High resolution for the timing increments during the mixing period is not so essential for pulsed polarization transfer ENDOR experiments. Timing increments of 0.1/zsec are certainly adequate and are easily obtainable with, commercially available programmable timing sources. Shorter timing increment adjustments between the microwave pulses are, however, essential if the same spectrometer is to be used for ESEEM experiments or for some of the new combined ESEEM/ENDOR experiments described in this chapter.
5.2. Temperature The temperature is an important experimental parameter in all electron nuclear multiple resonance experiments. This is true whether pulsed or CW excitation techniques are employed. In both cases the EPR signal intensity is larger at lower temperature. At low temperature both a larger electron spin polarization is obtained and the spin relaxation rates are longer. However, the effect of temperature on the pulsed ENDOR and the CW-ENDOR signals is manifest in quite different forms. IN CW-ENDOR, the ENDOR signal intensity is determined by the ratio of electron and nuclear spin relaxation rates as well as on the electron-nuclear cross-relaxation rates. 4-6 The latter are transitions in which both the electron and nucleus change their spin state. The sensitivity to the details of the electron and nuclear spin relaxation rates in CW-ENDOR has two practical consequences. First, the intensity of the C W - E N D O R signal is a sensitive function of temperature. Because the electron and nuclear relaxation rates generally do not follow the same functional dependence with temperature, the observation of the
146
PROBES OF METAL ION ENVIRONMENTS
[6]
CW-ENDOR signal is often restricted to a narrow temperature window. Furthermore, the relative intensities of lines within a CW-ENDOR spectrum are not simply related to the number of nuclei that contribute to the line. As already discussed earlier in this chapter, one of the primary advantages of employing pulsed excitation in ENDOR experiments is that the ENDOR enhancement is not dependent on this relationship between the electron and nuclear spin relaxation rates. However, the success of the pulsed ENDOR experiment does require electron spin phase memory times that are sufficiently long to observe a spin echo. It is also essential that the electron spin polarization created in the preparation period does not decay by spin-lattice relaxation or spectral diffusion mechanisms before sublevel polarization transfer can be detected. During the time interval between the preparation period and the detection period, the electron longitudinal spin polarization created in the preparation period will decay back toward thermal equilibrium. The rate of this decay is characterized by the electron spin-lattice relaxation time, Tie. Tie characterizes the lifetime of the spin in the excited spin state. The loss of electron longitudinal polarization by spin-lattice relaxation will reduce the EPR signal intensity observed in the detection period. This loss in signal intensity competes directly with change in the EPR signal intensity arising from the displacement of the longitudinal electron spin polarization due to sublevel polarization transfer. The loss of electron spin polarization during the mixing period results in a reduced signal-to-noise ratio in the ENDOR spectrum. For transition metal ions, Tie values decrease rapidly with increasing temperature. T~ values can range over many orders of magnitude in time, from less than nanoseconds at high temperature to minutes at low temperatures. The magnitude and explicit temperature dependence of Tie depend on many factors including the spin multiplicity of the ion, the electronic orbital degeneracy, and the ligand field of the coordination complex. Pulsed ENDOR experiments of transition metal ions are generally performed in the liquid helium temperature range, where T~e values are generally on the order of milliseconds or longer.
5.3. Sample Volume, Concentration, and Sensitivity In general, higher sample concentrations give higher signal intensities, but there are two factors that set the upper limit on the usable concentration levels. First, it may simply be difficult to concentrate the protein beyond a certain limit. Second, at higher concentrations
[6]
PULSED ELECTRON NUCLEAR MULTIPLE RESONANCE
147
the spin-spin interactions between metal centers may shorten the electron spin phase relaxation time so that electron spin echoes are more difficult to detect. The concentration at which these spin-spin interactions between metal ions can be observed depends on whether the metal ions are buried within a protein or are situated near the protein surface. Shorter Tm values can often be observed when concentrations of the metal ions exceed the range of a few millimolar. It is important to recognize that the shortening of the T~ values will be observed at concentrations far below those required to observe broadening effects in the EPR spectrum. Attention should also be paid to the possibility of aggregation on freezing. Aggregation can increase the possibility of spin-spin interactions. Sample volumes depend on the probe design. For most designs, sample volumes in the range of 100 to 300 t~l are optimum. We have found that it is particularly convenient if the probe accommodates samples in the standard 4-mm EPR sample tubes. The sensitivity of the pulsed ENDOR experiment depends in large measure on the width of the inhomogeneous EPR absorption spectrum, the electron spin relaxation rates, and the efficiency of the probe design. The width of the EPR line is important because only a small portion of the overall resonance line is sampled by the pulses at a given magnetic field setting. The excitation bandwidth of the microwave pulses samples roughly 0.5-10 G out of an EPR line which may be several hundred gauss or wider. The sensitivity that can be expected for metal ions or metal clusters with spin multiplicites greater than ½ is lower than for spin ½ samples because the EPR signal is spread over a greater magnetic field range. The effect of short electron spin relaxation rates has already been discussed. Short phase memory times reduce the electron spin echo intensity, resulting in a lower signal-to-noise ratio of the detection signal. The ENDOR signal intensity is a measure of the change in the echo intensity due to sublevel polarization transfer and is not a measure of the absolute echo intensity. Of course, if the echo is weak because of a short Tin, changes in its intensity will be more difficult to detect. Short T~e times compete directly with the sublevel polarization transfer to result in a reduction of the echo intensity. This results in a direct reduction in the ENDOR signal intensity. In practice, the ENDOR enhancement observed for copper proteins and copper enzymes, iron-sulfur proteins and enzymes, and hemes are in the range of 1 to 10% of the EPR signal intensity. This applies to experiments performed at roughly 2 K, with sample concentrations of roughly 1 mM and sample volumes of about 200/~1.
148
PROBES OF METAL ION ENVIRONMENTS
[6]
5.4. Microwave Transmitter The short phase memory time observed for frozen solutions ofmetalloproteins and enzymes dictates many aspects of the microwave transmitter design. It is essential that microwave magnetic field strengths on the order of 10 G (in the rotating frame) be available at the sample. This is necessary so that the spins on-resonance can be rotated through a sufficiently large angle in a time short compared to Tm. As a guiding rule, the spins should be rotated by a ~" flip on a time scale roughly 10 times shorter than Tm. This sets the criterion Hi -> zr/YTm for the required microwave magnetic field strength. Probes used in electron spin echo and pulsed ENDOR must have a low Q value (see discussion of probes below), so the ability to deliver these high field strengths requires the use of high-power microwave transmitters. In most modern spectrometers this is achieved by amplifying a low-level microwave source signal to power levels between 100 and 1000 W using a traveling wave tube amplifier (TWTA). The configuration of the TWTA in the microwave transmitter is shown in the block diagram of Fig. 5. Alternate (and less expensive) methods of achieving the high microwave power levels such as the use of magnetrons is also possible. However, these alternatives are less desirable because of the poor pulseto-pulse stability and difficulty in generating phase coherence between microwave pulses. A second microwave source must be added for hyperfine selective ENDOR experiments. 2z Alternatively, the hyperfine selective ENDOR experiments may be performed using one microwave source and jumping the magnetic field between the preparation and detection periods. 21 Besides the ability to generate the appropriate microwave power levels, other important aspects of the microwave transmitter are the capability to control the phase of the pulse and the ability to generate pulses over a broad frequency range. Control of the phase provides the capability to phase cycle the pulses in a pulse sequence, The use of phase cycling techniques helps eliminate the contribution of spurious signal responses to the desired signal. At minimum it is desirable to have the capability to shift the phase by ~', but solid-state microwave components are readily available to also allow generation of ~-/2 phase shifts. The latter are essential if the spectrometer is also to be used for Fourier transform EPR experiments but are not critical for ESEEM or pulsed ENDOR experiments. 5.5. Probes The probe is one of the most critical components in the spectrometer. In pulsed EPR experiments, the probe must convert the power microwave
[6]
PULSED ELECTRON NUCLEAR MULTIPLE RESONANCE
149
delivered by the transmitter to magnetic field at the sample. In pulsed ENDOR and related multiple resonance experiments, the probe must also convert the high power rf pulses delivered from the transmitter to a magnetic field at the sample. The probe must have resonance modes in which the magnetic and electric fields are separated and must accommodate the sample in a region of maximum magnetic field and minimum electric field. The conversion of microwave power to magnetic field can be accomplished by using probes with high-Q resonant modes or by confining the magnetic field to a small volume at the sample. The first approach is commonly used in CW-EPR spectroscopy, where cavity structures with Q values of several thousand are used. High-Q structures cannot be used in pulsed EPR spectroscopy. High-Q structures will not admit the bandwidth of frequencies contained in the short microwave transmitter pulses. In addition, the microwave transmitter power in the probe must decay to levels below the signal level before the EPR signal can be observed. This decay time, known as the probe ring down time, must be short compared to the phase memory time, Tm. The time during which ring down occurs is known as the dead time of the spectrometer. The microwave power level in the probe decays as exp(-oJt/Q), where oJ is the microwave frequency. Mims has estimated that a decay of order 140 dB is necessary for the transmitter power to be reduced to the thermal noise power level. 34 This value can be used to estimate the spectrometer dead time resulting from the probe ring down time: t(ringing) ~ 14[ln(10)]Q/to ~ 32Q/to. For probes with Q values of the order of 100, t(ringing) is approximately 60 nsec, which is roughly a factor of 2 shorter than the actual dead time observed experimentally for many spectrometers. The microwave magnetic field at the sample is directly proportional to the product of the probe Q and the filling factor. The filling factor, ,/, is approximately given by the ratio of the sample volume to the total volume of the probe in which the magnetic field is finite. By the reciprocity relationship, the sensitivity is also determined by this relationship. The use of low-Q probes demanded for fast ring down can be compensated by increasing the filling factor. This is accomplished by confining the magnetic field to a small volume of space at the sample. Several probe designs with low Q values and large filling factors have been described in the literature. Mims designed a transmission cavity in which the sample is placed directly on the center conductor of the microwave transmission line. 8 It has the advantage of having the highest filling factor but is inconvenient to use, especially if the sample is air and temperature sensitive. Probe designs which accommodate standard 4- or 5-mm
150
PROBES OF METAL ION ENVIRONMENTS
[6]
EPR sample tubes include the slotted tube resonator 47.54and the loop gap 55 and bridged loop gap resonators. 56 A modified slotted tube resonator was used in all experiments described in this chapter. An additional complexity introduced in pulsed multiple resonance experiments is that an rf circuit must also be present to deliver the rf magnetic field. Ideally, the rf circuit should not interfere with the performance of the microwave circuit. In practice, this is difficult to achieve. The presence of the rf elements usually degrades the performance of the microwave circuit. This is often manifest by slightly longer ring down times than would be obtained in the absence of the rf circuit. The coil can be wound on the outside or inside of the microwave shield. The former design has the advantage that it minimizes the interference with the microwave circuit but has the disadvantage that a lower rf field is obtained for a given transmitter power. The latter offers the highest power-to-field conversion factor but is more difficult to design without compromising the microwave circuit. The design of the rf circuit is in many respects much more simple than that required for NMR experiments. This is because the rf circuit only needs to deliver the rf power to the sample. Because the NMR signal is not detected, the Q value of the rf circuit is not critical. Indeed, the Q value must by necessity be extremely low to accommodate the extremely wide frequency range of the ENDOR spectrum. The rf circuit is in fact better described as a low-pass rf filter rather than by a Q-factor value. In practice some compromise must be made between the efficiency of converting rf power to rf magnetic field and the usable frequency range. Circuits with higher induction values generate higher rf magnetic fields but start to attenuate the rf input power at lower frequencies. At X-band EPR frequencies, the ENDOR of ligand nuclei, especially protons and nitrogen atoms, are observed in the range from 1 to 30 MHz. However, as is demonstrated in Section 6, the sensitivity in pulsed ENDOR experiments is sufficient so that ENDOR spectra from 1 to 200 MHz can be recorded. The ENDOR from central metal nuclei with large hyperfine splittings are observed in the higher frequency range.
5.6. Radio Frequency Transmitter The specifications for the rf transmitter are very similar to those of a typical high-power pulsed NMR transmitter for studies of solids. The detailed specifications for the rf transmitter will depend on the type of 54 M. Mehring and F. Freysoldt, J. Phys. E: Sci. Instrum. 13, 894 (1980). 55 W. Froncisz and J. S. Hyde, J. Magn. Reson. 47, 515 (1982). 56 S. Pfenninger, J. Forrer, et al., Rev. Sci. Instrum. 59, 752 (1988).
[6]
PULSED ELECTRON NUCLEAR MULTIPLE RESONANCE
151
multiple resonance capabilities desired. As a minimum for pulsed ENDOR experiments, the transmitter should be capable of delivering rf pulses of sufficient magnitude to rotate the nuclear spins in a time short compared to the time scale over which the electron spin polarization decays after the preparation pulse. The electron spin-lattice relaxation time, Tie, can be taken as a measure of this decay. It should be recognized, however, that the spectral diffusion of energy across the inhomogeneous EPR resonance line width can enhance the polarization decay by several orders of magnitude. As a conservative estimate, the NMR transition should occur in a time an order of magnitude shorter than T~e. This assumes that the nuclear phase memory relaxation time, T2n, is longer than 10T~e. Little direct experimental data o n T2n for paramagnetically coupled nuclei are available. Preliminary experimental data suggest that the T2n values for nuclei shifted away from the nuclear Larmor frequency by the hyperfine interaction are longer than for nuclei at their Larmor frequency. 16'~8 In the absence of other data, we assume for the current discussion that T2, is not the limiting criterion for the time scale in which the NMR transition must occur. If this is not the case, then the condition tp < 10T2, should replace the condition tp < 10Tie in the discussion that follows. Recalling that the nutation angle 0 is equal to ey,H2tp, it is clear that the rf power requirements will vary depending on the value of the hyperfine enhancement factor, e, as well as on the rf circuit design parameters. We can obtain an estimate of the required rf magnetic field at the sample by using our rule of thumb that tp -< 10TI~and a 7r pulse for maximum ENDOR enhancement, H 2 = 107r/eYnTle. Protons and nitrogen are two nuclei commonly observed in metalloenzyme studies. Assuming Tie = 10 msec, we find that for protons H2 = 0.738/e G, whereas for ~4N//2 = 10.2/e G. For protons with small hyperfine couplings, the H2 required is in fact rather modest, as fields of 1 G in the rotating frame are easily achieved. The inverse linear relationship between H2, TI~, and e means that the irradiating magnetic fields required will vary significantly with the hyperfine coupling and the TI~ value. In metalloenzyme studies at X-band microwave frequencies, the proton hyperfine coupling A is typically no larger than 2v~. Thus e is no greater than 2 for the NMR transition in one of the rns electron spin manifolds but no less than 0 for the NMR transition in the other electron spin manifold. If A is approximately equal to 2v, so that e = 0.01, an H 2 of about 75 G may be required for arr pulse. For a nucleus with a low gyromagnetic ratio, such as the ~4N nucleus, much larger H2 fields are required. 14N nuclei that coordinate metal ions typically have hyperfine couplings in the range 5 < A < 40 MHz depending on the type of metal ion and the details of the coordination structure. As
152
PROBES OF METAL ION ENVIRONMENTS
[6]
a result, enhancements of up to e = 20 can be observed. The enhancement factor results in larger effective gyromagnetic ratios. This results in a significantly lower rf magnetic field requirement. In practice, magnetic fields of the order of 50 G can be easily achieved using a 500- to 1000-W rf amplifier. Larger field strengths can be achieved if the rf circuit is tuned to a narrower frequency range. Using a more modest rf power amplifier with an output in the range of 100 to 500 W, protons with small hyperfine couplings, A < 2v., are easily observable, whereas nuclei with low y values are easily observable if the hyperfine enhancement is sufficiently large. Proton ENDOR lines with A ~ 2v n can exhibit a pronounced amplitude asymmetry between the ENDOR transitions in the two electron spin manifolds. This is because the hyperfine enhancement reduces the effective y for the nucleus to an extremely small value. This amplitude asymmetry will also be observed in ENDOR spectra recorded at spectrometer microwave operating frequencies other than X-band. Of course, the relevant A value will depend on the value of 2v,, which is in turn determined by the spectrometer microwave operating frequency.
5.7. Choice of Radio Frequency and Microwave Operating Frequency Range It is highly desirable that the ENDOR spectrometer be capable of operation at several microwave frequencies. This is most useful to observe how the ENDOR frequencies shift between two magnetic field values but at constant g value. This information can be very useful for identifying the nucleus associated with given ENDOR lines in cases where many ENDOR lines overlap. The overlap between nitrogen with large hyperfine couplings (i.e., A > 2Vn) and protons with small hyperfine couplings (A < 2Vn) is effectively eliminated in ENDOR spectra recorded at Q-band microwave frequency. This overlap can also be eliminated in spectra recorded at X-band microwave frequency by suppressing the ENDOR signal for nuclei with small A values using hyperfine contrast selectivity (see Sections 4 and 6). However, this will also suppress the ENDOR signals from nuclei with small A values other than protons. Operation at other spectrometer frequencies is less effective as a method for identifying ENDOR lines from nuclei with small 3' values and large A values such as, for example, in distinguishing between 57Fe and 14N. In that case, another recently developed ENDOR method, hyperfine selective (HS)-ENDOR, described in Section 11.1, can be helpful in assigning overlapping ENDOR lines. The HS-ENDOR method is particularly useful for resolving overlapping lines from nuclei centered at A/2, that is, nuclei with hyperfine couplings A exceeding 2v,. Because
[6]
PULSED ELECTRON NUCLEAR MULTIPLE RESONANCE
153
the hyperfine coupling does not shift with applied magnetic field, operation at another microwave frequency will not be effective in removing the overlap. For the greatest versatility, the rf transmitter should be very broad banded, operating from 1 to 200 MHz. ENDOR from ligand nuclei are observed in the range from less than 1 to roughly 30 MHz at X-band frequencies, whereas proton ENDOR can be observed up to 70 or 80 MHz at Q-band frequencies. The ENDOR from the central metal nuclei can be observed at up to several hundred megahertz. The Cu ENDOR for a blue copper protein is an example discussed in Section 6. 6. Mims and Davies Electron Nuclear Double Resonance Studies of Metalloproteins The blue copper protein stellacyanin serves as a good illustrative model for demonstrating the pulsed ENDOR methodology discussed above. Copper ions in blue copper proteins are typically coordinated in a distorted tetrahedral geometry by two imidazole nitrogens from histidine residues, a thiolate sulfur from a cysteine residue, and a thioether sulfur from a methionine. 57-6° Stellacyanin is unusual among the blue copper proteins because the polypeptide is known to contain no methionine residues. 6~ Stellacyanin also exhibits several unusual properties for blue copper proteins, including the lowest redox potential among the blue copper proteins and a more rhombic EPR spectrum in contrast to the usual axial spectrum. Moreover, the protein exists in a reversible perturbed blue form between pH 8 and 1 1.5 that has slightly different properties but is still a blue copper protein. 61'62 The protein ligands in the high-pH form (pH > 8) of stellacyanin have been identified using pulsed ENDOR techniques.44 A spectrosopic model for the copper coordination structure of the high-pH form of stellacyanin is shown in Fig. 6. The electron spin echo detected EPR (ESE-EPR) spectrum of stellacyanin recorded at pH 11 is shown in Fig. 7a. ESEEPR spectra are recorded by plotting the ESE intensity while incrementing the magnetic field in a stepwide manner on successive pulse sequence iterations. Recording the EPR spectrum in this manner yields the absorption spectrum rather than the derivative (more correctly the first harmonic of the absorption) that is normally recorded on the conventional EPR 57 j. A. Fee, Struct. Bonding (Berlin) 23, 1 (1975). 58 E. T. Adman, R. E. Stenkamp, et al., J. Mol. Biol. 123, 35 (1978). 59 p. M. Coleman, H. C. Freeman, et al., Nature (London) 272, 319 (1978). 60 H. B. Gray and E. I. Solomon, "Copper Proteins." Wiley (Interscience), New York, 1981. 61 j. Peisach, W. G. Levine, et al., J. Biol. Chem. 242, 2847 (1967). 62 B. G. Malmstrom, B. Reinhammer, et al., Biochim. Biophys. Acta 205, 48 (1970).
154
PROBES OF METAL ION ENVIRONMENTS
[6]
.•,(18.2) 'k
c
Rb ~4
N / ~,,.CIl
/~""N3('9.o)
,o,7
/, H
~.
S
1~1(42) /
(21.4) ~,'~
a R4
~
a J
II
./,------NS
(4.62)H,2
TM
/a
(, 8,
~H
FIG. 6. Spectroscopic model for the copper coordination structure in the high-pH form of stellacyanin. Numbers in parentheses are the hyperfine couplings in megahertz.
spectrometer. For easy comparison with the conventional EPR spectrum, the digital derivative of the ESE-EPR spectrum is shown in Fig. 7b. When the nuclear modulation of the electron spin echo envelope is deep, amplitude distortions in the ESE-EPR spectrum can be observed. In favorable cases, such amplitude distortions can be minimized by using microwave pulses with weak magnetic field intensities or by superimposing ESE-EPR spectra recorded at several values of the interpulse delay time. In spite of these potential complications, the ESE-EPR spectrum serves as a useful guide for identifying the position in the EPR spectrum at which the E N D O R spectrum is recorded. The pulse sequences for the Davies and Mims pulsed ENDOR experiments are shown in Fig. la,b, respectively. In both the Mims and Davies experiments, the E N D O R spectrum is recorded by stepping the rf frequency on successive pulse sequence iterations. This is necessary because the excitation bandwidth of the rf pulse is small compared with the width of the ENDOR spectrum.
6.1 Pulsed Electron Nuclear Double Resonance Spectroscopy of Proton and Nitrogen Ligand Nuclei The two Davies ENDOR spectra of the blue copper protein stellacyanin shown in Fig. 8 were recorded at the magnetic field position corresponding to g = 2.20 (approximately gz) in the EPR spectrum. The markedly different appearance of the spectra in Fig. 8a arises from the suppression of E N D O R lines from nuclei with small hyperfine couplings by the hyperfine contrast selectivity mechanism described in Section 4. The spectrum in Fig. 8a was recorded using a preparation pulse with a bandwidth ofroughly
[6]
PULSED ELECTRON NUCLEAR MULTIPLE RESONANCE
155
a
I
I
2600
2800
I
I
3000 3200 Magnetic FiNd (G)
I
3400
FIG. 7. ESE-EPR spectrum at 1.6 K of the high-pH form of stellacyanin (a) and its first derivative (b). Experimental conditions: Umw = 8.884 GHz, tmw = 0.02 and 0.04/~sec, r = 0.57/zsec.
2.5 MHz, whereas the bandwidth was 25 MHz in Fig. 8b. The ENDOR lines from protons with small hyperfine couplings, which are the stronger peaks centered around the proton Larmor frequency identified by Un in Fig. 8a, are not observed in Fig. 8b. In ENDOR spectra of transition metal ion complexes recorded at Xband microwave excitation frequencies, the ENDOR lines from protons with small hyperfine couplings often overlap with the ENDOR lines from other nuclei, particularly 14N.63 Protons with small hyperfine couplings include those on the ligand pendant groups coordinating the metal ion, on the solvent molecules, on the polypeptide backbone near the metal ion, and possibly on substrates coordinated to the metal ion. Other nuclei that may have an ENDOR line overlapping with these weakly coupled proton ENDOR lines must have large hyperfine couplings. The overlap of ENDOR lines from protons with small hyperfine interactions with ENDOR lines from nuclei with large hyperfine couplings can be eliminated by suitable choice of the preparation conditions as discussed 63 j. E. Roberts, J. F. Cline, et al., J. A m . Chem. Soc. 106, 5324 (1984).
156
PROBES OF METAL ION ENVIRONMENTS
[6]
©
I
I
I
I
I
I
5
10
15
20
25
30
rf(Mnz) FIG. 8. Davies E N D O R spectra o f stellacyanin at g = 2.20 recorded under microwave inversion and detection pulse widths,/row, of 0.40, 0.20, 0.40/xsec (a) and 0.04, 0.02, 0.04 /~sec (b) illustrate hyperfine contrast selectivity (see text). Other experimental conditions: Vmw = 8.843 GHz, r = 0.52/zsec (a) and 0.51 /zsec (b), t~ = 5.50/xsec.
in Section 4.42,48E N D O R lines from protons with small hyperfine couplings can be suppressed if a narrow microwave pulse width is used in the preparation period. This suppression effect is illustrated in the Davies E N D O R spectrum of Fig. 8b. In the Davies ENDOR experiment, the necessity of using a finite preparation pulse width means that the amplitude for protons with very small hyperfine couplings will always be suppressed by the hyperfine contrast selectivity mechanism. In the Mims ENDOR experiment, the interpulse delay time r instead of the microwave pulse width(s) is the relevant factor that determines the relative amplitudes of the ENDOR transitions. ENDOR amplitudes from nuclei with very small hyperfine couplings can be observed by choosing large values of r in the preparation period. This creates a sawtooth pattern of electron spin polarization where the "teeth" are more closely spaced. The gradient of the polarization as a function of offset from the resonance center is then very large, so that small couplings can be detected without amplitude suppression. A direct comparison between the Davies and Mims ENDOR spectra recorded using similar microwave excitation pulse widths is shown
[6]
157
PULSED ELECTRON NUCLEAR MULTIPLE RESONANCE
O
I
I
I
I
I
I
5
l0
15
20
25
30
rf(MUz) FIG. 9. M i m s E N D O R s p e c t r u m of stellacyanin obtained with tp = 0.05 ~ s e c and r = 0.03 ~ s e c (a) c o m p a r e d with the s a m e Davies E N D O R s p e c t r u m s h o w n in Fig. 8b (b). Other experimental conditions are identical.
in Fig. 9. The Mims ENDOR spectrum in Fig. 9a was recorded using microwave excitation pulses of 0.05/xsec and r = 0.30/xsec. This Mims spectrum may be contrasted with the Davies ENDOR spectrum in Fig. 9b, which was recorded with a similar microwave excitation pulse width. Note that the weakly coupled protons dominate the Mims ENDOR spectrum, whereas the ENDOR signals from these protons are virtually completely suppressed in the Davies ENDOR spectrum. One complication of the Mires ENDOR experiment are the blind spots expected at A i r = n, where no ENDOR effect is observed. On the other hand, these blind spots can aid in the assignment of hyperfine coupling values. The n = 1 blind spots are indicated by the arrows in Fig. 9a. The blind spots can be easily identified by recording several spectra using different r values. The upper bound on r will be determined by the electron spin phase memory time, which is usually on the order of 2-3/xsec for metalloproteins. The lower bound on the usable r is determined by the spectrometer dead time. The suppression of the proton ENDOR lines centered near the proton Larmor frequency reveals two broad lines centered at roughly 8.5 and
158
PROBES OF METAL ION ENVIRONMENTS
[6]
17.5 MHz. and two somewhat narrower lines at 22.6 and 24.8 MHz. Based on the similarity of these ENDOR lines to those observed for other blue copper proteins, 63 the lines centered at 8.5 and 17.5 MHz are assigned to the imino nitrogens, denoted by N~ and N b in Fig. 6, on the imidazole ligands of protein histidine residues that coordinate the copper ion. For these nitrogen atoms, IAI -> 2Vn SO the ENDOR line is centered at A/2. The line splittings expected from the nitrogen Larmor frequency and from the quadrupole interaction (see Section 2) are not well resolved and serve only as line broadening mechanisms. The nitrogen Larmor splitting can, however, be observed under other experimental conditions (see below). At 9.5 MHz the laN ENDOR line also overlaps part of the proton ENDOR spectrum whose amplitudes have not been completely suppressed by the hyperfine contrast selectivity mechanism. The weak broad intensity between 12.5 and 14.5 MHz arises from the v+ branch of this residual part of the proton ENDOR spectrum. The v branch of the residual proton ENDOR spectrum overlaps the 14N ENDOR line centered at 8.5 MHz to give the asymmetric line observed. Based on comparative studies of blue copper proteins 63 and on isotope labeling studies, 64 the ENDOR lines at 22.6 and 24.8 MHz are assigned to the two-proton ENDOR transitions for the two methylene protons on a thiolate ligand. The thiolate methylene protons are identified as H~ and H~2 in Fig. 6. This assignment yields A = 18.2 MHz for H~1 and A = 21.4 MHz for H~2. The two ENDOR lines from the second electron spin manifold are expected at 3.0 and 1.3 MHz for H~1 and H~2, respectively. The intensity of these lower frequency ENDOR transitions are too small to be detected under the experimental conditions used to record the spectra shown in Fig. 8. The low intensity is a result of the small hyperfine enhancement factor (see discussion on amplitudes below). The amplitudes for both the ~4N and ~H ENDOR lines are also determined by electron nuclear coherence effects as discussed in Section 4. These effects are illustrated in Fig. 10, where two Davies ENDOR spectra of stellacyanin are shown. These spectra were recorded using identical experimental conditions except for the spin echo delay time in the detection period. The spin echo envelope modulation waveform recorded using the same microwave pulse conditions that were used in the detection period of the Davies ENDOR experiment is shown as an inset in Fig. 10. One pronounced difference between the two spectra in Fig. l0 is that the relative ENDOR amplitudes for the two methylene proton lines at 21.4 and 23.1 MHz are observed to depend on ~-. The low-frequency partners for these proton ENDOR lines are expected at 3.0 and 1.3 MHz, T. H. Stevens, C. T. Martin, et al., J. Biol. Chem. 257, 12106 (1982).
[6]
PULSEDELECTRONNUCLEARMULTIPLERESONANCE
~
159
4
5'
~ 10
1'5 rf (MHz)
' 20
2'5
30
FIG. 10. Davies ENDOR spectra of stellacyanin at g = 2.20 recorded at a two-pulse modulation minimum at r = 0.40 tzsec (a) and at a maximum at r = 0.51 tzsec (b) indicated in the inset. Other experimental conditions: T = 1.3 K, Vmw= 9.236 GHz,tmw= 0.03,0.05, 0.03 /xsec, trf = 2.00 ~sec.
respectively. F o r this small splitting, the m i c r o w a v e pulses used in the detection period have sufficient bandwidth to excite coherently the allowed and semiforbidden E P R transitions. If the nuclear modulation arises from the 1.3 M H z line, the minima and m a x i m a for the intensities of the 23.1 M H z line would be separated by roughly 0.38/zsec, which is consistent with the o b s e r v e d results. Another possibility is that the r - d e p e n d e n t amplitudes shown in Fig. 9 arise f r o m the excitation of semiforbidden E P R transitions associated with the 14N nucleus f r o m the remote amino nitrogen of the imidazole ligand. The shape of the 14N E N D O R line centered at 17.5 M H z (Fig. 10) is also a function of the echo delay time r in the detection period. This serves as an example of the E S E E M orientational selectivity effect discussed in Section 4. The 14N E N D O R line has been assigned to the histidine imidazole imino nitrogen, N] in Fig. 6. the dominant contribution to the modulation of the echo w a v e f o r m is f r o m the amino nitrogen, N~ in Fig. 6, on the same histidine imidazole ligand. The E S E E M orientation selectivity i m p r o v e s the resolution of the E N D O R line since a smaller n u m b e r of
160
PROBES OF METAL ION ENVIRONMENTS
[6]
0.4-
0.2-
0.0"--- 1.52 MHz -"
-0.2 O
-0.4 -
-0.6-
-0.8-
_/ 10
•
2.38 MHz
-
4.62 MHz
I
I
I
I
I
I
11
12
13
14
15
16
rf (MI-Iz) FIG. 1 1. Davies ENDOR spectrum at g = 2.10 of stellacyanin centered around the proton Larmor frequency obtained by reducing the rf step size from that used in Fig. 8b.
nuclei corresponding to a subset of the hyperfine (and quadrupolar) orientations contribute to a given spectral range in the ENDOR spectrum. The protons with smaller hyperfine couplings can also be useful in identifying the protein residues that ligate the transition metal ionY A high-resolution Davies ENDOR spectrum of stellacyanin centered at the proton Larmor frequency recorded at the gy position in the EPR spectrum is shown in Fig. 11. The hyperfine splittings for the protons with small hyperfine couplings can be measured with high accuracy in pulsed ENDOR spectra. This is a direct benefit of the fact that ENDOR lines in spectra recorded using pulsed techniques are not susceptible to the line broadening or frequency shift effects frequently encountered in spectra recorded using CW excitation techniques. The spectral assignments of the four proton couplings of 4.62, 1.52, 2.38, and 0.87 MHz are shown in Fig. 11. Using the measured, proton 65 H. Thomann, M. Bernardo, et al., J. A m . Chem. Soc. submitted (1993).
17
[6]
PULSED ELECTRON NUCLEAR MULTIPLE RESONANCE
161
hyperfine couplings for the methine protons on the imidazole ring of Cu(II)[(imid)4] 66 a s a reference, the hyperfine couplings measured for stellacyanin can be assigned to the protons on the imidazole methine carbons in the histidine imidazole ring that is coordinated to the copper i o n . 67 This assignment procedure assumes that the mechanism for the delocalization of the unpaired electron spin density from the copper atom on to the methine carbon protons in imidazole ring is similar in the model compound and the copper protein. The unpaired spin density on the nitrogen is delocalized onto the imidazole ring through the tr-Tr interaction on the nitrogen. The magnitude of the hyperfine coupling for the nitrogen directly bound to the Cu(II) ion is then a measure of the unpaired electron spin density in the imidazole ring. The ~4N hyperfine couplings for the imidazole imino nitrogens in stellacyanin can then be used as a scaling parameter to calculate the expected proton hyperfine couplings for the methine protons in the imidazole ring. The measured values for the imino imidazole nitrogen hyperfine coupling in Cu(II)[(imid)4] is A = 40 MHz, whereas the proton couplings for the C-2 and C-5 protons are 5.4 and 1.7 MHz, respectively. Using these references values, the proton couplings calculated for the C2 and C-5 protons for the imidazole ring with the imino nitrogen A = 35 MHz in stellacyanin are 4.73 and 1.40 MHz, respectively. For the imidazole ring with the imino nitrogen A = 17 MHz, the calculated couplings for the C-2 and C-5 protons are 2.30 and 0.72 MHz, respectively. These values are within the experimental error of the measured proton couplings shown in Fig. 11. This good agreement between the assignment of the proton and nitrogen hyperfine couplings serves as an internal serf-consistency check for the assignment of the proton and nitrogen ENDOR lines to an imidazole ligand. 6.2. Pulsed Electron Nuclear Double Resonance Spectroscopy of Central Metal Nuclei In favorable cases, the hyperfine splittings from the central metal nucleus can be observed directly in the EPR spectrum. However, this is the exception rather than the rule for metals coordinated in proteins and enzymes. Furthermore, the selection rules for the EPR spectrum generally prevent the detection of the quadrupole interaction for central metal nuclei with spin I > ½. The advantage of the ENDOR technique is that both the hyperfine and quadrupole interaction for the central metal nucleus can be determined with high precision. This is possible even when the hyperfine 66 H. L. van Camp, R. H. Sands, et al., J. Chem. Phys. 75, 2098 (1981). 67 H. Thomann and M. Bernardo, in Biological Magnetic Resonance,Vol. 13. Plenum Press, N e w York (1993).
162
PROBES OF METAL ION ENVIRONMENTS
[6]
splitting from the central metal nucleus is not resolved in the EPR spectrum. Pulsed techniques offer specific advantages over traditional continuous wave irradiation techniques in ENDOR studies of the central metal nuclei. These advantages are more readily appreciated when considering the general characteristics of ENDOR spectra for a central metal nucleus with spin I > ½. The large values of the hyperfine and quadrupole interactions spread the E N D O R lines over a wide frequency range in the ENDOR spectrum. In most cases, the ENDOR lines also tend to be broad. These characteristics of broad lines spread over a wide frequency range require high sensitivity and minimum spectral distortion for accurate measurement. These criteria are more readily fulfilled using pulsed techniques. The decoupling of the E N D O R signal from the detailed balance between the electron and nuclear relaxation rates results in spectra that are not frequency shifted or broadened by rapid passage effects. 69 In addition, the sensitivity for the detection of ENDOR lines with large hyperfine interactions is optimized by using preparation pulses with large excitation bandwidths (see Section 4). Significantly, these large excitation bandwidths in the preparation period do not introduce line distortion effects. Thus, pulsed methods are particularly well suited for studies of the central metal E N D O R especially if the hyperfine couplings are large such as for Cu(II) ions. Cu E N D O R spectra of stellacyanin recorded using the Davies pulse sequence are shown in Fig. 12. The wide ENDOR frequency sweep range, from 1 to 200 MHz, shown in Fig. 12 encompasses the proton and nitrogen as well as the Cu E N D O R signals. For the broad bandwidth excitation pulse used in the preparation period, the proton ENDOR lines for the imidazole ring protons do not contribute to the spectrum. However, the E N D O R lines for the two imino (i.e., directly coordinated to the cupric ion) nitrogens of the two histidine imidazole ligands and the proton ENDOR from the methylene carbon of the thiolate ligand have large hyperfine couplings and do contribute to the spectrum. These are the narrow lines (relative to the Cu ENDOR lines!) observed below 25 MHz in Fig. 12. The intensities of the nitrogen ENDOR lines for the imino imidazole nitrogen with A ~ 19 MHz in Fig. 12 are small owing to the short rf pulse widths used to record the spectra. The changes in intensity observed for the methylene protons in Fig. 12 is attributed to a combination of two effects. One is the anisotropy of the hypertine interaction. This anisotropy is manifest in the dependence of the amplitudes on the g value at which the E N D O R spectrum was recorded. Electron-nuclear coherence is the second phenomenon which can affect the relative intensities of the methylene proton E N D O R lines in Fig. 12. The electron-nuclear coherence is
[6]
PULSED ELECTRON NUCLEAR MULTIPLE RESONANCE
I
I
I
50
100
150
163
200
rf(Mnz) F1G. 12. Cu E N D O R spectra of stellacyanin recorded using the Davies pulse sequence near gx at g = 1.967 (a), near gy at g = 2.088 (b), and near gz at g = 2.25 (c). Other experimental conditions: T < 1.3 K, Umw = 8.884 GHz, tmw = 0.04, 0.02, 0.04/zsec, t~f = 2.00/zsec, r = 0.55/~sec.
manifest as the nuclear modulation of the electron spin echo envelope in the detection period (see Section 4). The broad lines at frequencies above 30 MHz in the Davies ENDOR spectra shown in Fig. 12 are assigned to the ENDOR transitions from the Cu nucleus. This assignment is consistent with previous CW-ENDOR studies of stellacyanin.68 However, in contrast to the CW-ENDOR spectra, in the pulsed ENDOR spectra all ENDOR lines have the same phase, consistent with the assertion that rapid passage effects 69 do not affect the pulsed ENDOR spectrum. This is significant because rapid passage results in line broadening and frequency shifts that can yield inaccuracies in the hyperfine and quadrupole couplings deduced from the CW-ENDOR spectra. Recording of the 1H, IaN, and 63'65CuENDOR transitions in one widefrequency spectrum has the advantage of making possible a more direct comparison of the relative transition intensities for these nuclei. The Cu 68 j. E. Roberts, T. G. Brown, et al., J. A m . Chem. Soc. 102, 825 (1980).
164
PROBES OF METAL ION ENVIRONMENTS
[6]
E N D O R transitions are very intense, actually comparable to the amplitudes of 'the strongly coupled nitrogen and methylene proton ENDOR transitions. As discussed in Section 4, a quantitative comparison of ENDOR amplitudes for the different nuclei must take into account the hyperfine contrast selectivity, the frequency dependence of the hyperfine enhancement factor, and the anisotropy of the g and hyperfine interactions on the ENDOR. For the cupric ion, the 63Cu and 65Cu nuclei, both with I = g, are expected to give rise to three ENDOR transitions in each of the two electron spin manifolds, so that up to six lines could in principle be observed in the E N D O R spectrum. The lines are rather broad, however, so that the ENDOR lines from the 63Cu and 65Cu nuclei are not separately resolved. At magnetic field strengths typical in X-band ENDOR studies, the hyperfine interaction is significantly larger than the nuclear Zeeman and quadrupole interactions. The Cu ENDOR transitions are therefore centered at [A[/2. Additional line splittings are expected from the nuclear Zeeman and quadrupole couplings (see Section 2). For I = ~, 41 = 6 lines are expected in the E N D O R spectrum. However, as seen in Fig. 12a, only two lines are resolved in the ENDOR spectra recorded at g = 1.967 (gx = 2.03). The value [A~[ = 176 MHz is obtained by assigning the center of the doublet to [A[/2. This is consistent with the hyperfine splitting observed in the EPR spectrum near gx. The splitting of the doublet is much larger than twice 2v c'' (which is approximately 7.30 MHz for 63Cu and 7.81 MHz for 65Cu at this magnetic field). This splitting is therefore assigned to the Cu quadrupole interaction which gives [Pxl = 5.8 MHz. The unresolved Cu Larmor frequency splitting results in the broadening of the two ENDOR lines centered at [A[/2 - 3[P[. Using a similar analysis, we find that [Az[ is 130 MHz and IPzl is 4,3 MHz for the ENDOR spectrum in Fig. 12c recorded at g = 2.25 (near gz)7. Comparison between Continuous Wave and Pulsed Electron Nuclear Double Resonance Studies The Davies and Mims ENDOR experiments are the pulsed analogs of the conventional CW-ENDOR experiment. In this section, we contrast the relative sensitivity of the two experimental approaches and discuss how the spectra obtained by the two methods depend on the experimental parameters and conditions. From the discussion in Sections 4 and 6, it would appear that spectra acquired using pulsed techniques are inherently more complicated because of the sensitivity to the detailed experimental parameters such as the microwave and rf pulse and timing conditions.
[6]
PULSED ELECTRON NUCLEAR MULTIPLE RESONANCE
165
These experimental conditions primarily determine the relative signal amplitudes in the ENDOR spectrum. In the CW-ENDOR experiment, an alternate set of experimental parameters determines the relative signal amplitudes. These include the magnetic field and rf modulation frequencies and amplitudes and the rf and microwave power levels. In both the pulsed and CW experiments, these parameters can be adjusted in order to define experimental conditions that enhance or suppress selected ENDOR lines. For example, in the CW-ENDOR experiment the use of large magnetic field modulation amplitudes can be used to suppress the ENDOR signals from nuclei with small hyperfine couplings. By far the major contrast between the pulsed and CW-ENDOR experimental approaches is a consequence of how the ENDOR signals, particularly the ENDOR amplitudes, depend on the electron and nuclear spin relaxation rates. The sensitivity of the CW-ENDOR signal to the detailed balance between electron and nuclear spin relaxation rates has been well documented. 5 This sensitivity has the consequence that the amplitudes in the CW-ENDOR experiment can in general not be related to the number of nuclei contributing to the ENDOR line. In some cases it has the consequence that the CW-ENDOR signal can only be observed over a narrow temperature range. Another important consequence is that the ENDOR frequencies, line shapes, and signal phases will be shifted if the rf sweep rate is comparable or greater than the spin relaxation rates. 69Rapid sweep rates are often used to enhance the signal-to-noise ratio since the sweep rate determines the signal acquired per unit time interval. 68 In the pulsed experiments, the process of electron and nuclear spin excitation and detection occurs on time scales short compared to the spin relaxation times. For coherent pulsed excitation of the EPR and NMR transitions, it is necessary that to~-2 ~ TleT2e and 092 - 2 0. The HS-ENDOR spectrum is recorded in a manner analogous to the Davies ENDOR experiment except that the microwave frequency in the detection period is offset from the preparation period by A. Each HSENDOR spectrum, corresponding to a given A, is then recorded by incrementing in a stepwise manner the rf frequency of the sublevel mixing pulse on successive pulse sequence iterations. A sublevel polarization transfer is only detected for those nuclei for which A = A. Because the mixing pulse transfers "negative" electron spin polarization from position Bp to BO, the polarization transfer will be observed as a decrease in the EPR susceptibility at B 0. Transitions in the HS-ENDOR spectrum therefore have the appearance of an "emission" line rather than an "absorption" line as observed in the Davies ENDOR spectrum. The ENDOR spectra for the high-pH perturbed form of the blue copper protein stellacyanin serve as a good example of the power of the HS-
[61
PULSED ELECTRON NUCLEAR MULTIPLE RESONANCE
179
a
b
C
d
5
I
I
I
I
I
10
15
20
25
30
,f(Mltz) FIG. 18. Davies ENDOR spectra for the native (pH 7) form (a) and the high-pH perturbed (pH 11) form (b) of stellacyanin. HS-ENDOR spectra with A = 19.0 MHz (c), 42.0 MHz (d), and 36.0 MHz (e) were used to assign the feature at 21 MHz in the spectra of the highpH form to a nitrogen. Other experimental conditions: T = 1.65 K, g = 2.07,/"mw 9.080 GHz (detection), tmw = 0.10, 0.05, 0.10/zsec, t~r = 8.00/.~sec. Reproduced with permission from reference 44. Copyright 1991 by the American Chemical Society. =
ENDOR technique. 44 The Davies ENDOR spectra (A = 0) for the native (pH 7) protein and for the high-pH perturbed ( p H I 1) form are shown in Fig. 18a,b, respectively. The two Davies spectra are identical except for the broad peak at 21 MHz observed in the high-pH form. This new ENDOR line is difficult to assign because of the strong overlap with the nitrogen line at 18 MHz and the proton line at 24 MHz. If the new line arises from a new proton cut'piing it would correspond to A = 20 MHz. If it arises
180
PROBES OF METAL ION ENVIRONMENTS
[6]
f r o m a new nitrogen coupling it would c o r r e s p o n d to A = 42 M H z . The new E N D O R line at 21 M H z is not o b s e r v e d in the H S - E N D O R s p e c t r u m with A = 19 M H z , s h o w n in Fig. 18c, but it is o b s e r v e d when A = 42 M H z , as shown in Fig. 18d, indicating that it arises from a nitrogen with A -~ 42 M H z . The imino imidazole nitrogen with A -- 35 M H z is o b s e r v e d in the H S - E N D O R spectrum, shown in Fig. 18e, obtained for A = 36 M H z . B e c a u s e the two imidazole imino nitrogens and cysteinyl methylene protons are o b s e r v e d with identical frequencies and amplitudes at p H 7 and 11, the r e s o n a n c e at 21 M H z m u s t arise from a third nitrogen (i.e., a fourth ligand). A second illustration o f the 2D E N D O R e x p e r i m e n t is shown in Fig. 19. The Davies E N D O R s p e c t r u m for the 57Fe-enriched oxidized h y d r o g e n a s e e n z y m e isolated f r o m the bacterium Clostridium pasteurianum is shown in Fig. 19a. Properties of this e n z y m e h a v e been discussed in Section 8. The two lines in the Davies E N D O R spectrum, shown in Fig. 19a, at 4.5 and 17.5 M H z are assigned to 57Fe E N D O R lines based on the characteristic 2v, splitting observed. T h e s e c o r r e s p o n d to 57Fe nuclei with central
!
!
I
I
5
10
15
20
rf (MHz) FIG. 19. HS-ENDOR spectra with A = 0.0 MHz (a), 30.0 MHz (b), and 34.4 MHz (c) for the oxidized hydrogenase enzyme enriched with 57Fe. Other experimental conditions: T = 1.6 K, Vmw= 9.085 GHz, tmw = 0.10, 0.05, 0.10/~sec, trf = 17.00/~sec, ~ = 0.49 p.sec.
[6l
PULSED ELECTRON NUCLEAR MULTIPLE RESONANCE
181
metal hyperfine couplings of A = 9.0 and 35.0 MHz. A broad weak line centered at 8.5 MHz in Fig. 19a is also assigned to an 57Fe ENDOR transition. As discussed in Section 9, the intensity of this line depends on the echo delay time used in the detection period. The 57Fe ENDOR line at 17.5 MHz is partially obscured by overlap with the proton ENDOR lines. Furthermore, the amplitude asymmetry of the proton ENDOR lines on the high-frequency side of the proton Larmor frequency (vu -~ 13 MHz) suggests that an additional 57FeENDOR line may be overlapping with these proton lines. This is in fact confirmed in the HS-ENDOR spectrum with A = 30.0 MHz shown in Fig. 19b. A fourth 57Fe ENDOR line, identified by the characteristic 2v n splitting for the 57Fe nucleus, is observed in the HS-ENDOR spectrum shown in Fig. 19b. The complete line shape for the 57Fe ENDOR line at 17.5 MHz, which is partially obscured by the proton ENDOR lines in the Davies ENDOR spectrum in Fig. 19a, is completely resolved in the HS-ENDOR spectrum with A = 34.4 MHz shown in Fig. 19c. Thus, using a combination of the Davies, ESEEM-edite~l ENDOR, and HS-ENDOR experiments, a total of four magnetically inequivalent 57Fe ENDOR lines are identified for the active FeS cluster in the hydrogen-activating enzyme hydrogenase isolated from the bacterium Clostridium pasteurianum. It is interesting to contrast the HS-ENDOR experiment with other methods for reducing the overlap of ENDOR lines. In the discussion on hyperfine contrast selectivity above, we have already demonstrated how the ENDOR amplitudes from the weakly coupled proton ENDOR lines can be suppressed by the appropriate selection of the microwave preparation pulse width. Another approach is to record the ENDOR spectra at several microwave excitation frequencies. 83-85 Recording the ENDOR spectrum at Q-band EPR is an effective method for eliminating the overlap of nitrogen and proton ENDOR lines, as demonstrated for copper proteins by Werst et al. 85 The weakly coupled protons will shift to the higher ENDOR frequency centered about the proton Larmor frequency, whereas the strongly coupled nitrogen nuclei will remain centered at A/2. The greatest advantage of the 2D ENDOR experiment is in cases where nuclei with large hyperfine couplings overlap. In pulsed ENDOR experiments the hyperfine contrast selectivity mechanism is not effective in eliminating the overlap of strongly coupled nuclei whose ENDOR fre83 O. Burghaus, A. Toth-Kischkat, et al., J. Magn. Reson. 80, 383 (1988). 84 H. C. Box, "Radiation Effects: ESR and ENDOR Analysis." Academic Press, New York, 1977. 85 M. M. Werst, C. E. Davoust, et al., J. A m . Chem. Soc. 113, 1533 (1991).
182
PROBES OF METAL ION ENVIRONMENTS
[6]
quencies are centered at A/2. Recording ENDOR spectra at higher microwave excitation frequencies is also not likely to reduce the spectral overlap since the nuclei with large hyperfine couplings will remain centered at A/2. Although a direct comparison between the pulsed 2D ENDOR and high-frequency E N D O R experiments has not yet been reported, it is likely that no one technique is the panacea for all spectral simplification problems. Because the 2D experiment is a pulsed experiment, it will have the advantage of being insensitive to the details of the electron and nuclear spin relaxation rates. The sensitivity of each HS-ENDOR spectrum is comparable to that obtained for the Davies experiment. However, the total experiment time required will be longer for the 2D experiment since it will be necessary to record HS-ENDOR spectra at multiple values of A. Another consideration is that implementation of the 2D experiment requires a relatively minor modification of the pulsed ENDOR spectrometer. However, the construction of a pulsed ENDOR spectrometer must be balanced against constructing a separate microwave probe and transmitter/receiver system for operation (either CW or pulsed) at the second microwave frequency. When the many parameters are taken into consideration, it is apparent that no one technique is the cure-all for all spectral simplification problems.
12. Pulsed Electron. Nuclear Nuclear Triple Resonance: Pulsed Double Electron Nuclear Double Resonance Studies Electron nuclear nuclear triple resonance experiments are ENDOR experiments in which a second rf irradiation field is applied. Two types of electron nuclear nuclear triple resonance experiments have been demonstrated in the continuous wave irradiation mode. 86 In one mode of the experiment, the two NMR transitions corresponding to the hyperfine sublevels in the two electron spin manifolds connected by the EPR transition are simultaneously irradiated by the two rf fields. This experiment, introduced by MObius et al.,86 who coined the term Special Triple resonance, primarily has the advantage of enhancing the sensitivity in the CW-ENDOR experiment. It also reduces the sensitivity of the CWENDOR amplitudes to the detailed balance of the spin relaxation rates. In the second type of electron nuclear nuclear triple resonance experiment, known as General Triple resonance, two nonequivalent nuclei are irradiated at their respective NMR transition frequencies. The experiment is performed by observing the intensity change for one ENDOR line 86 K. MObius and R. Biehl, "Multiple Electron Resonance Spectroscopy," p. 475. Plenum, New York, 1979.
[6]
PULSED ELECTRON NUCLEAR MULTIPLE RESONANCE
183
i I
t~w.,.I fl_
!I-- z 8-I
EPR
i
V
NMR1
NMR 2 I I
Preparation I
Mixing
Detection
F16. 20. Pulsed implementation of double ENDOR.
while saturating the NMR transition of the second nucleus. There are two important advantages of this experiment: (1) the relative signs of nonequivalent nuclei can be determined, and (2) the connectivity of the nuclear sublevels can be determined. General Triple resonance was first demonstrated by Cook and Whiffen, who originally coined the term double ENDOR to describe the experiment. 87 Here we adopt the original nomenclature (double ENDOR) in order to avoid confusion with the electron nuclear electron triple resonance technique described in this chapter. The pulsed implementation of double ENDOR, shown in Fig. 20, was first demonstrated on an organic radical by Mehring et al. 13The frequency for one of the rf pulses Oil, identified as NMR 1in Fig. 20, is set to irradiate a selected ENDOR line. The frequency of the second rf pulse %2, identified as NMR 2 in Fig. 20, is then incremented on successive pulse iterations analogous to the experimental procedure in the Davies ENDOR experiment. Intensity changes in the ENDOR spectrum that may result from the irradiation at COl2are more easily identified by taking the difference spectrum, that is, the double ENDOR difference spectrum, between the ENDOR and double ENDOR spectrum. In principle, the ordering of the two rf pulses in the pulse sequence shown in Fig. 20 is not significant; the pulse with fixed frequency can precede or follow the pulse that is swept, or the two can be applied concurrently. This assumes, however, that relaxation rates are negligible or that the relaxation rates effect the longitudinal polarization of all hyperfine sublevels equally. 87 R. J, Cook and D. H. Whiffen, Proc. R. Soc. London 84, 845 (1964).
184
PROBES OF METAL ION ENVIRONMENTS
[6]
ENDOR lines observed in the double ENDOR difference spectrum must have sublevels in common that are connected by the EPR and two NMR transitions. Thus, the observation of a peak in the double ENDOR difference spectrum indicates that the two ENDOR lines irradiated by the two rf fields must arise from two inequivalent nuclei coupled to the same electron. The relative sign of two hyperfine coupling constants, Ai and Aj, associated with these two inequivalent nuclei can be also be deduced from the double ENDOR difference spectrum. An increase in the ENDOR intensity, observed as an absorption line in the double ENDOR difference spectrum, indicates that A i and A~ are of opposite sign. A decrease in the ENDOR intensity, observed as an emission line in the double ENDOR difference spectrum, indicates that Ai and Aj have the same sign. An illustration of the pulsed double ENDOR experiment is shown in Fig. 21. The Davies ENDOR spectrum of the hydrogenase H cluster (see Section 8 for a discussion of the H cluster) is shown in Fig. 21a. The ENDOR lines centered at 4.5, 9.5, 14.5, and 17.5 MHz are assigned to 57Fe. As discussed in Sections 9 and 10, this assignment is based on the
I
I
I
I
5
IO
15
20
rf(Ml-lz) FIG. 21. Davies E N D O R s p e c t r u m for the oxidized h y d r o g e n a s e e n z y m e enriched with 57Fe (a) a n d double E N D O R difference s p e c t r u m with a second rf pulse at 17.8 M4-1z (b). O t h e r experimental conditions: T = 1.3 K, g = 2.008, Vmw = 9.214 G H z , tmw = 0.05, 0.03, 0.05/xsec, trfl = 10.00 g.sec, tn2 = 4.00/xsec.
[6]
PULSED ELECTRON NUCLEAR MULTIPLE RESONANCE
185
characteristic 2/,n splitting observed in spectra recorded in the Davies, HS-ENDOR, and ESEEM-edited ENDOR experiments. The ENDOR spectrum shown in Fig. 21a was recorded at the high-field extrema of the EPR spectrum. The pulsed double ENDOR difference spectrum observed when setting the fixed rf frequency to 17.80 MHz is shown in Fig. 2lb. When the two rf pulses in the mixing period of the pulse sequence in Fig. 20 are set to irradiate the same NMR transition, a decrease in the ENDOR signal intensity is observed because the second rf pulse effectively reverses the polarization transfer resulting from the first pulse. In this case the second rf pulse reduces the ENDOR signal intensity, which is observed as an emission line in the double ENDOR difference spectrum. This accounts for the negative peak at 17.80 MHz in Fig. 2lb. When the second rf pulse irradiates an NMR transition arising from the same nucleus but in the other electron spin manifold, the ENDOR signal intensity increases the analogy to the increase observed in the Special Triple experiment. This is observed as an absorption line in the double ENDOR difference spectrum and accounts for the positive peak at 16.85 MHz. Note that this peak is offset by 2vn from the peak at 17.80 MHz as expected if the two ENDOR lines arise from the same 57Fe nucleus. An additional weak and very broad negative peak is observed centered at 14.6 MHz. The observation of this broad peak at 14.6 MHZ suggests that the ENDOR line at 17.8 MHz has a level in common with the ENDOR line at 14.6 MHz. This implies that the two 57Fe nuclei must be coupled to the same electron and must therefore arise from the same FeS cluster. No change in the ENDOR intensities for the 57Fe lines at 4.5 and 9.0 MHz is evident in the double ENDOR difference spectrum. This suggests that the two 57Fe ENDOR lines do not share common hyperfine sublevels with the 57Fe line at 17.8 MHz. We conclude based on these results that the two low-frequency 57Fe ENDOR lines and the two high-frequency lines arise from two different FeS clusters whose EPR signals overlap at the magnetic field at which the ENDOR spectra are recorded. Further evidence for two overlapping EPR spectra is obtained in pulsed ENDORinduced EPR spectra as demonstrated in Section 13. 13. Pulsed Electron Nuclear Double Resonance-Induced Electron Paramagnetic Resonance Studies The ENDOR-induced EPR (EI-EPR) experiment, first demonstrated by Hyde, 88 generates an EPR spectrum by plotting an ENDOR transition 88 j. S. H y d e , J. Chem. Phys. 43, 1806 (1965).
186
PROBES OF METAL ION ENVIRONMENTS
[6]
as a function of the applied magnetic field. It is a particularly useful technique for separating overlapping EPR spectra arising from different radicals or different molecular conformations of a radical. The technique takes advantage of the fact that the magnetic sites which generate the overlapping EPR spectra may have nonoverlapping lines in the ENDOR spectrum. Tracking the amplitude for one of the ENDOR lines as a function of magnetic field will generate the EPR spectrum for only that magnetic site. Using CW-ENDOR excitation, the EI-EPR spectrum has been recorded using one of two methods. One approach is to take the difference between the normal EPR spectrum and the spectrum recorded with an rf field set to an E N D O R frequency. 88 This requires the use of Zeeman field modulation and either amplitude or frequency modulation of the rf field. An alternative approach is to use a frequency-modulated rf field without Zeeman field modulation. 89 Using this single modulation encoding, the EI-EPR spectrum is displayed directly as an absorption spectrum. Pulsed excitation methods offer a new experimental approach for recording EI-EPR spectra. Because the EPR spectrum is recorded using spin echoes, we identify these spectra as EI-SE/EPR spectra to distinguish them from experiments in which the EPR signal is recorded using CW excitation techniques. The EI-SE/EPR spectrum can be recorded using either the Davies or Mims pulsed ENDOR schemes by tracking the amplitude of the E N D O R line selected by the radio frequency as a function of the magnetic field. In the EI-SE/EPR experiment, the EPR absorption spectrum is recorded directly without taking the difference of two spectra and without using any modulation encoding methods. An example of EI-SE/EPR spectroscopy is shown in Fig. 22. In Fig. 22a the SE/EPR spectrum for the hydrogenase H cluster is shown. The SE/EPR spectrum is recorded by tracking the electron spin echo intensity as a function of magnetic field. This generates directly an absorption display as opposed to the derivative display observed by phase detection when using magnetic field modulation encoding. If nuclear modulation effects and spin relaxation effects do not significantly affect the spin echo amplitude, the digital derivative of the SE/EPR spectrum corresponds to the standard EPR spectrum. The SE/EPR spectrum of the hydrogenase H cluster shown in Fig. 22a is qualitatively consistent with the rhombic spectrum with g values of 2.00, 2.04, and 2.10 observed by conventional CW-EPR. However, the SE/EPR line shape is not quantitatively consistent with a single rhombic 89 R. J. Cook, J. Sci. lnstrum. 43, 548 (1966).
[6l
PULSED ELECTRON N U C L E A R M U L T I P L E RESONANCE
I
I
3100
3150
I
I
3200 3250 Magnetic Field (G)
I
I
3300
3350
187
Fie. 22. Spin echo EPR spectrum for the oxidized hydrogenase enzyme enriched with STFe(a) and corresponding ENDOR-induced SE/EPR (EI-SE/EPR) spectra with vre = 5.10 MHz and trf = 10.00/zsec (b), Vrf = 18.00 MHz and trf = 3.00/xsec (c), and Vrf = 24.00 MHz and ta = 3.00/~sec (d). Other experimental conditions: T = 1.3 K, Vmw= 9.214 GHz, tmw = 0.10, 0.05, 0.10 p, sec.
p o w d e r p a t t e r n . T h i s is m o s t e v i d e n t f r o m t h e a m p l i t u d e a s y m m e t r y in t h e high-field r e g i o n o f t h e s p e c t r u m . T h i s a s y m m e t r y c o u l d a r i s e f r o m n u c l e a r m o d u l a t i o n o r s p i n r e l a x a t i o n e f f e c t s . A l t e r n a t i v e l y , it c o u l d a r i s e f r o m t h e o v e r l a p o f a s e c o n d E P R signal. T h e s e p o s s i b i l i t i e s c a n be d i s t i n guished using EI-SE/EPR spectroscopy. The Davies ENDOR spectra of the hydrogenase H cluster recorded at t h e high-field e x t r e m a o f t h e E P R s p e c t r u m h a s b e e n d i s c u s s e d in
188
PROBES OF METAL ION ENVIRONMENTS
[6]
Sections 9-12. Four magnetically inequivalent 57Fe sites with hyperfine coupling values of approximately 9.0, 17.0, 28, and 32 MHz can be identified using a combination of the Davies ENDOR, HS-ENDOR, ESEEMedited E N D O R experiments. The EI-SE/EPR experiment can be used to determine whether these four magnetically inequivalent iron sites arise from the same radical site or from more than one radical site. The EI-SE/EPR spectra shown in Fig. 22b-d were recorded using the Davies pulsed ENDOR sequence. The spectrum shown in Fig. 22b was recorded with the rf mixing pulse frequency set to irradiate the 57Fe ENDOR line at 5.10 MHz. Note that the amplitude asymmetry observed at the high-field region in the SE-EPR spectrum shown in Fig. 22a is not observed in the EI-SE/EPR spectrum shown in Fig. 22b. The EI-SE/EPR spectrum in Fig. 22b displays the powder absorption pattern expected for a rhombic EPR signal arising from a single radical site with electron spin S=½. A completely different line shape is observed in the EI-SE/EPR spectrum, shown in Fig. 22c, obtained when the rf mixing pulse frequency is set to irradiate the 57Fe ENDOR line at 18 MHz. The line shape of the EI-SE/EPR spectrum in Fig. 22c has axial rather than rhombic symmetry. The most plausible interpretation of these results is that the two 57Fe E N D O R lines at 5. I and 18.0 MHz arise from two different radical species which have overlapping EPR spectra. This interpretation is also consistent with the results from the several other pulsed multiple resonance experiments discussed throughout this chapter. The E N D O R frequencies are not constant as the magnetic field is swept in an EI-EPR or EI-SE/EPR experiment. The nuclear Zeeman frequency is a function of the magnetic field. The ENDOR frequencies are also field dependent if the g factor or hyperfine interactions are anisotropic. Because the ENDOR frequency is field dependent, the radio frequency cannot match the NMR transition across the entire EPR spectrum. If the radio frequency is not adjusted during the field sweep, pronounced amplitude effects can be observed in the EI-EPR or EI-SE/EPR spectra. For nuclei with a large gyromagnetic ratio such as ~H or 19F, significant amplitude effects will be observed for even narrow field sweep widths. For nuclei with a small gyromagnetic ratio such as ~4N or 57Fe, these effects become significant only if the magnetic field sweep range exceeds 100 G. This is apparently the case for one of the iron sites with hyperfine coupling A = 9 MHz that was irradiated to generate the rhombic powder pattern observed in the EI-SE/EPR spectrum shown in Fig. 22b. If the hyperfine anisotropy is large, significant amplitude variations can be observed even over a narrow field sweep range. This is apparently the case for the second iron site with hyperfine coupling A -- 35 MHz
[6]
P U L S E D E L E C T R O N N U C L E A R M U L T I P L E RESONANCE
189
that was irradiated to generate the axial powder pattern observed in the EI-SE/EPR spectrum shown in Fig. 22c. Additional evidence for the greater magnetic field dependence of this 5VFe ENDOR line is obtained by recording the EI-SE/EPR spectrum with the rf mixing pulse frequency set to 24 MHz. Because no 57Fe ENDOR line is observed at 24 MHz in the ENDOR spectrum recorded at g = 2.00, no intensity is observed at the high-field edge in the EI-SE/EPR spectrum. However, an ENDOR signal is observed at 24 MHz for g > 2. The decrease of the EI-SE/EPR signal intensity with decreasing magnetic field observed in the spectrum of Fig. 22d originates from the frequency shift and broadening of the 57Fe ENDOR line observed with increasing g values. This suggests that the hyperfine interaction for this 57Fe nucleus is considerably more anisotropic than observed for the two 57Fe nuclei with smaller hyperfine coupling. This anisotropy is also evident in a series of Davies ENDOR spectra recorded at several magnetic field positions across the EPR spectrum. 14. Concluding Remarks The combination of the modern pulsed techniques in EPR spectroscopy with modern pulse techniques in solid-state NMR spectroscopy have already created a variety of new experimental methodologies for metaUoenzyme and metalloprotein studies. The impact that these new experimental methodologies will have in addressing problems in the biological sciences will certainly continue to expand as new laboratories enter the field. At the same time, new techniques and methodologies are currently under development that offer even greater and exciting potentials for structure and function elucidation. A potential limitation of both the crystallographic and spectrosopic methods discussed in this chapter are that the proteins must be in the solid state. For crystallographic studies, the protein must also obviously be in a crystalline form. For the spectroscopic studies frozen solutions can be studied and crystals are not necessary, but most experiments must be performed at low temperature. Structural data deduced from physical methods must be interpreted with the caveat that the data on the solid state must be related to the physiological state. Such a comparison can in fact provide insight into relevant physiological function. For example, a distribution of conformational states of the peptide side chains that coordinate a metal in the frozen solution state may reflect the conformational states dynamically accessed in the high temperature solution state.
190
PROBES OF METAL ION ENVIRONMENTS
[7]
[7] C o n t i n u o u s W a v e E l e c t r o n N u c l e a r D o u b l e Resonance Spectroscopy
By CHRISTOPHER J. BENDER and PHILIP AISEN Introduction and History The development of the transistor in the 1950s generated intense investigation into the properties of semiconductors. In the early years of electron paramagnetic resonance (EPR) spectroscopy considerable interest therefore focused on silicon crystals doped with donor atoms from Group Va of the periodic table. The doping atom, phosphorus, arsenic, or antimony, brought with it an unpaired electron and a resulting EPR spectrum. Because the natural abundance of silicon-29 (29Si) is 4.7%, each unpaired electron sampled the nuclear moments of many silicon atoms, both nearby and remote. Resulting hyperfine interactions were often too small, compared to the EPR line widths, to be resolved and analyzed by conventional EPR spectroscopy. This difficulty was circumvented by Feher L2 in the seminal work introducing ENDOR (electron nuclear double resonance) spectroscopy. The great insight of Feher was that nuclear magnetic resonance (NMR) transitions, inaccessible to conventional NMR spectroscopy, could be detected by EPR. 1.2 ENDOR spectroscopy soon made its own transition from solid-state physics to biology with studies of a photoinduced free radical in N A D P H dehydrogenase 3 and the copper protein stellacyanin. 4 Although X-band EPR showed no interpretable features in the radical signal, the ENDOR spectrum clearly revealed a characteristic "matrix line" centered at the free proton frequency (near 14.5 MHz), with poorly resolved structure suggestive of electron coupling to ring and aliphatic protons. A strong line at 19 MHz could be attributed, by comparison to spectra of free ravin radicals, to protons of the freely rotating 8-methyl group of the ravin ring. Origin of the radical in the ravin cofactor rather than the protein fabric of the enzyme was thereby established. In stellacyanin, well-resolved lines between 16 and 20 MHz were found. Because of their relative invariance to 10% shifts in observing field, these lines were attributed to coordinated J G. 2 G. 3 A. 4 G.
Feher, Phys. Rev. 103, 834 (1956). Feher, Phys. Reo. 114, 1219 (1959). Ehrenberg, L. E. G. Eriksson, and J. S. Hyde, Biochim. Biophys. Acta 167, 482 (1968). H. Rist, J. S. Hyde, and T. Vf.nng~u'd, Proc. Natl. Acad. Sci. U.S.A. 67, 79 (1970).
METHODS IN ENZYMOLOGY.VOL. 227
Copyright © 1993by Academic Press, Inc. All rights of reproduction in any form reserved.
[7]
CONTINUOUSWAVEENDOR SPECTROSCOPY
191
nitrogen. This early inference has been supported by spectroscopic and modeling studies with comparisons to blue copper proteins of known structure, 5 although it has not yet been verified by X-ray diffraction because of persistent difficulties in crystallizing the protein. With the application of ENDOR spectroscopy to the study of heine proteins 6 and iron-sulfur proteins 7 the power of the method in revealing hyperfine interactions invisible to conventional EPR spectroscopy was clearly demonstrated.
Instrumentation and Technique General
Feher 8'9 proposed a polarization phenomenon based on the Overhauser 1° description of coupled electron and nuclear spin states. This phenomenon, which became known as ENDOR, was initially verified by employing an EPR technique, adiabatic rapid passage, 1~ commonly used to monitor spin-lattice relaxation rates. An adiabatic rapid passage experiment entails forward and reverse magnetic field sweeps through an EPR line, so that on successive sweeps the spin population is alternately inverted so long as the sweep rate per field cycle exceeds the spin relaxation rate. In establishing the ENDOR effect, Feher used a modified superheterodyne EPR spectrometer that was equipped with a rectangular TEl01 cavity, around which was wound a radio frequency (rf) c o i l . 12'13 The radio frequency circuit consisted of an oscillator, power amplifier, the coil, and a 50 ohm (fl) termination. The dispersive EPR signal was detected during adiabatic rapid passage without modulation, and spin population dynamics were determined from the relative intensities of the EPR line on successive sweeps. A pictorial representation of the experiment, adapted from Feher, 9
5 S. Wherland, O. Farver, and I. Pecht, J. Mol. Biol. 2114, 407 (1988). 6 C. P. Scholes, R. A. Isaacson, T. Yonetani, and G. Feher, Biochim. Biophys. Acta 322, 457 (1973). 7 j. Fritz, R. Anderson, J. Fee, G. Palmer, R. H. Sands, J. C. M. Tsibris, I. C. Gunsalus, W. H. Orme-Johnson, and H. Beinert, Biochim. Biophys. Acta 253, 110 (1971). 8 G. Feher, Phys. Rev. 103, 500 (1956). 9 G. Feher and E. A. Gere, Phys. Rev. 103, 501 (1956). l0 A. Overhauser, Phys. Rev. 92, 411 (1953). It F. Bloch, Phys. Reo. 70, 460 (1946). 12 G. Feher, Bell Syst. Tech. J. 26, 449 (1957). 13 G. Feher and E. A. Gere, Phys. Rev. 114, 1245 (1959).
192
[7]
PROBES OF METAL ION ENVIRONMENTS
Hi
T~
_/ £ =::=b'
e:~
mb ma
~
aX'
==~:
=--
=
=
--b
--
= --
-
Im,m~
T ''~
T'*
Fl~. 1. Diagrammatic representation of Feher's original ENDOR experiment based on adiabatic rapid passage. H represents the swept dc magnetic field, dX '/dH is the EPR signal intensity, and ]msml) is a representation of the state diagram, where a, b, a', and b' represent the states of a system with S = ½and I = ½and filled boxes indicate most heavily populated energy levels. (Left) Conventional adiabatic rapid passage experiment; (Right) experiment varied by an NMR transition between states a' and b' before the second field sweep. (After Ref. 9.) describes the relationship b e t w e e n the spin dynamics and the o b s e r v e d signal (Fig. 1). In a later paper, F e h e r 13 described detection o f E N D O R f r o m its effect on the E P R signal o f a saturated portion of an inhomogeneously b r o a d e n e d r e s o n a n c e line. This m a n n e r o f performing E N D O R s p e c t r o s c o p y is now used almost exclusively, dynamical detection schemes being relegated to what is n o w k n o w n as dynamical nuclear polarization (DNP). The premise o f the E N D O R detection technique is that a portion of the E P R line is saturated, and hence the detected signal, which depends on the population difference b e t w e e n energy levels in resonance, is near zero b e c a u s e of spin population equilibration. A swept radio f r e q u e n c y field, by exciting transitions in nuclei coupled to the o b s e r v e d electron, depopulates one o f the states corresponding to the saturated E P R transition. This nuclear r e s o n a n c e is detected as an increase in the E P R signal intensity. The E N D O R s p e c t r u m is therefore r e c o r d e d as the change in E P R signal intensity (of a saturated line) as a function of the imposed radio frequency. F o r this r e a s o n E N D O R m a y be regarded as an E P R - d e t e c t e d N M R experiment. Modulation
Ordinarily, an E P R s p e c t r o m e t e r operates with phase-sensitive detection locked to a f r e q u e n c y that modulates the dc magnetic field. Poole 14 14c. P. Poole, "Electron Spin Resonance, A Comprehensive Treatise," 2nd Ed. Wiley (Interscienee), New York, 1983.
[7l
CONTINUOUS WAVE E N D O R SPECTROSCOPY
193
describes the field modulation technique in detail, and some of the salient features are repeated here. Under conditions of field modulation the detector of the EPR spectrometer receives a signal input from a small band of the spectrum. The detected signal oscillates from that observed at H o - H mto that seen at H o + H m, where H o is the dc field and H m is the modulation amplitude. When the field is off-resonance, the front end of the diode detector oscillates between two equal power levels, which is therefore transparent to the phase-sensitive components of the remainder of the detector circuit. As the dc field is swept, a region of the spectrum is entered where microwave power is absorbed. In this region the power level detected at the diode varies during the modulation cycle, and this modulated power is detected by the phasesensitive circuitry. The signal level of the phase-sensitive detector increases to a maximum at the inflection of the absorption peak, then decreases to pass through zero at the midpoint of the line, reaches a minimum at the inflection point of the falling edge of the absorption peak, and finally returns to baseline as the traversal of the EPR line is completed. An analogous analysis of the dispersion mode of detecting an EPR resonance detects maximum modulated power at the midpoint of the EPR line. In an ENDOR experiment observations are made on a saturated line that is "collapsed" by equilibration of the ground and excited spin states. If field modulation is used as part of the phase-sensitive detection scheme, a change in signal level is seen as the rf sweep through the NMR transition depopulates one of the electron spin states and lifts the condition of EPR line saturation. The resulting enhancement usually amounts to 5-10% of the amplitude of the unsaturated EPR line. A 10% change in signal intensity at the midpoint of the EPR line is a larger quantity in dispersion than in absorption mode. For this reason the EPR signal is usually detected in dispersion mode during an ENDOR experiment in which field modulation is used. The present-day commercial standard, in the implementation by Bruker Instruments, Inc., is frequency modulation (FM) of the rf source prior to amplification. A frequency-modulated rf source undergoes a timedependent variation of its output frequency; such a source is defined by its carrier wave, fc, a frequency deviation or modulation depth, Af, and a modulation frequency, fro- The parameters are defined pictorially in Fig. 2A. As an example, a 10 MHz carrier frequency that is modulated with a +-100 kHz frequency deviation at a fixed modulation frequency of 12.5 kHz (as on the Bruker ENDOR accessory) will vary in output between 9.90 and I0.10 MHz during an 80/~sec cycle. Its spectrum will feature side bands at frequencies above and below the carrier frequency. These
194
[7]
PROBES OF METAL ION ENVIRONMENTS
A
I~
~f.
|
J'--I
......
u.
_____;__ . . . . . .
~
fc
.......
Time
B Modulation
rf Carrier
i
Time
FIG. 2. Radio frequency modulation schemes for ENDOR spectroscopy. (A) Time domain representation of a frequency-modulated rf signal and the physical representation of the modulation parameters; (B) amplitude modulation of the rf carrier.
side bands o c c u r as an infinite set (f~ -+ nfm[n = 1, 2, 3 . . . . ), although only a few will h a v e significant amplitude. The n u m b e r of significant side bands, and hence the bandwidth of the signal, depends on the modulation amplitude (i.e., deviation) and frequency. Bandwidth increases as f r e q u e n c y deviation increases or modulation f r e q u e n c y decreases, in a relationship often e x p r e s s e d as a modulation index, A f / f m. Line width distortions can result f r o m an i m p r o p e r f r e q u e n c y deviation (modulation amplitude or depth) or modulation frequency, m u c h as line width distortions can o c c u r in a conventional E P R
[7]
CONTINUOUS WAVEENDOR SPECTROSCOPY
195
experiment when the field modulation is improperly used. 14 One source of line shape distortion unique to FM is the derivation of sideband amplitude (i.e., power) from the carrier frequency. Excessive modulation amplitude or inadequate modulation frequency will burn a hole in the output band of the rf source, leaving only side bands. Sweeping through the ENDOR transitions with such a distorted rf source will, in turn, distort the observed line shape. Distortion of the ENDOR line often occurs prior to achieving the maximum signal intensity by varying Af. For this reason FM was rejected in favor of other modulation schemes in early ENDOR spectrometers. Amplitude modulation (AM) of the rf, described in the early literature,15'16 is more often used in conjunction with a second field modulation. ~7Phase modulation of the microwave field in conjunction with AM has been employed for powder ENDOR.18 As the name suggests, the amplitude of the carrier frequency is modulated by an imposed waveform, usually an audio frequency. The audio frequency is heterodyned with the rf carrier to give the modulated waveform (Fig. 2B), with percent modulation determined from the~ratio of the peak-to-peak amplitude of the modulation and carrier signals: percent modulation = 100 × Vp.p(audio)/Vp.p(rf). A modulation percentage in excess of 100 (overmodulation) will lead to gaps in the signal. Side bands corresponding to the sum and difference of modulation and carrier frequencies are produced during amplitude modulation. Because only two AM side bands are generated, an AM signal has an inherently narrower bandwidth than an FM signal with the same modulation frequency. A second difference between AM and FM is the power distribution over the signal band. With AM the power is divided among the carrier and two sidebands, and the power distribution is dependent on the percent modulation. At 100% modulation the sideband powers are maximal, each delivering one-sixth of the total output power. This differs from FM, in which overmodulation enhances side bands at the expense of carrier. Amplitude modulation tends to be used in ENDOR only as a secondary modulation in conjunction with field modulation because the double modulation permits measurement of the ENDOR signal despite events such as drift that might otherwise cause artifacts. Rejection of AM as a sole modulation technique can be rationalized on the following basis. With AM the amplitude of the signal varies sinusoidally, and at 100% modulation nuclear transitions are switched on and off at the modulation frequency. 15 W. T. Doyle, Rev. Sci. Instrum. 33, 118 (1962). 16 H. Seidel, Z. Phys. 163, 218 (1963). t7 D. S. Leniart, in "Multiple Electron Spin Resonance Spectroscopy " (M. M. Dorio and J. H. Freed, eds.) p. 5. Plenum, New York, 1979. is j. S. Hyde, T. Astlind, L. E. Goran Eriksson, and A. Ehrenberg, Rev. Sci. lnstrum. 41, 1598 (1970).
196
PROBES OF METAL ION ENVIRONMENTS
[7]
The EPR detector level would then be oscillating between the power level of the saturated signal and the corresponding power of the normal EPR line when the condition of saturation is removed by the NMR transition. This, in theory, is a good feature for ENDOR, but the condition (27rfm) - l > Tl must still be met. For example, the Bruker ENDOR accessory operates with a modulation frequency of 12.5 kHz, so that AM ENDOR is constrained to spin samples with T1 shorter than 13 /zsec. The experimental limitation imposed by the audio frequency must be considered in studying the temperature dependence of an ENDOR line, since variations of T~ with temperature may result in T1 approachingfm -1. Amplitude modulation of an rf source in an ENDOR experiment may also result in baseline distortions. These distortions are presumably due to mechanical effects (e.g., microphonics) as the rf power is pulsed at high powers. For these reasons a double modulation scheme involving an audio AM and a low-frequency field or phase modulation is used; the second low-frequency modulation serves as a filter. A drawback in the use of Zeeman modulation for ENDOR is that the signal-to-noise ratio (S/N) is lost because signal is observed on only half of the cycle. Most test instruments and radio components are designed for operation at a fixed frequency. The ENDOR experiment, however, requires a modulated swept frequency. To achieve this, rf oscillators operating over discrete bands can be combined to cover a broad frequency range; a 0-100 MHz source might require several bands. The ENDOR spectral baseline may then distort as the rf source crosses two bands. The Illinois EPR Research Center (Urbana, IL) has devised a modified FM modulator based on a surface acoustic wave device that eliminates this distortion. 19 The modulator is compatible with standard frequency synthesizers and is available from the Illinois EPR Research Center.
Sensitivity Enhancement at Low Modulation Frequencies As already indicated, ENDOR experiments are usually performed with low-frequency modulation. Receiver noise figures of heterodyne and homodyne spectrometers are comparable at modulation frequencies of 100 kHz, but at lower frequencies a so-called flicker noise in homodyne receivers can overwhelm the normal diode noise. Flicker noise also arises from detector diodes in a manner inversely proportional to the modulation frequency. 18,20Noise in a homodyne receiver operating at 10 kHz may be four times greater than noise at 100 kHz. 2°
t9 R. B. Clarkson, R. L. Belford, and C. Reiner, Rev. Sci. Instrum. 61, 3356 (1990). s0 C. Hoentzsch, J. R. Niklis, and J. M. Spaeth, Rev. Sci. Instrum. 49, 1100 (1978).
[7l
CONTINUOUSWAVEENDOR SPECTROSCOPY
197
The problem of sensitivity loss owing to the low modulation frequency can be remedied by making a modification to the microwave bridge. 2°'21 This modification consists of inserting a low-noise preamplifier prior to the receiver. Normally, the microwave radiation from the klystron is fed via a circulator to the cavity and then on to the detector diode (i.e., receiver). A circulator is a three- (or sometimes four-) port ferrite device acting as a one-way distributor of microwave radiation. Radiation from the klystron enters the circulator at port 1. At port 2, radiation leaves and is reflected back from the cavity, with the reflected microwave radiation from the cavity exiting the circulator (bound for the receiver) at port 3. The amplifier should be placed between port 3 of the circulator and the input of the receiver. An isolator between the amplifier and the receiver is recommended to halt microwave power reflected by the receiver. The theory of the sensitivity enhancement gained as a result of this modification is described in detail by Hoentzsch et al., 2° but the gist of the idea is to boost the signal amplitude prior to detection by the diode with little penalty in added noise. The flicker noise is then favorably scaled relative to the amplified signal (with respect to spectrometer performance) and a sensitivity enhancement, typically a factor of four, may be gained. Low-noise amplifiers are available from LORAL/NARDA (Hauppauge, NY) or Miteq (Hauppauge, NY). Bruker will install amplifiers on their current spectrometers on request. Resonators and Electron N u c l e a r Double R e s o n a n c e Coil
In principle, the sole design requirement of a continuous wave (CW)ENDOR cavity is that it be possible to impose a sample simultaneous dc, microwave, and rf magnetic fields along mutually orthogonal axes. 21aThis condition is difficult to implement in practice because the engineering requirements of two high-frequency circuit components, namely, a tuned microwave resonator and an untuned NMR probe, must be reconciled. As discussed above, ENDOR detection is made as a measure of net change in EPR signal intensity during microwave power saturation. Any factor that causes a loss in EPR signal-to-noise ratios will, in turn, have deleterious effects on ENDOR sensitivity. Desirable attributes of a resonant cavity for EPR spectroscopy are reviewed by Poole. 14 Of these, the one most often affected by making cavity modifications for ENDOR is the Q or quality factor. For example, dielectric losses from the metal of an NMR probe inserted in a cavity will decrease the cavity Q factor with 21 G. Grampf, Rev. Sci. lnstrum. 56, 2050 (1985). 21a Despite the general rule regarding orthogonality of Hi and H2, Newton and Hyde describe S-band ENDOR studies using a loop-gap resonator and ff coil arrangement in which both fields are parallel [M. E. Newton and J. S. Hyde, J. Magn. Resort. 95, 80 (1991)].
198
PROBES OF METAL ION ENVIRONMENTS
[7]
a corresponding loss of signal intensity. Such a spoiled cavity may be useless for all but the most concentrated samples. The crux of the design problem, therefore, is to introduce the NMR probe with minimal perturbation to the electric field component of the resonant microwaves. Two strategies for modifying the microwave cavity without significantly spoiling Q can be devised: (1) an NMR probe is inserted within the resonant field in such a way that the electric field is minimally perturbed; (2) the NMR probe is positioned outside the resonant field, either as an integral component of the resonator itself or as an independent external structure. Each of these strategies is discussed in turn. Most commonly used ENDOR cavities (including commercial designs) are of the first type. In general, with this strategy a cavity with a very high Q factor is chosen, so that spoiling by the coil will be relatively unimportant. Widely used cavities that feature high Q factors are the rectangular TE~o2 and cylindrical TEo11, with resonant modes illustrated in Fig. 3. To minimize perturbation of the electrical component of the microwave field the metal wire of the probe must lie very nearly perpendicular to the electric field lines. For the two cavities illustrated in Fig. 3, this means the NMR probe is best fashioned as vertical posts parallel to the sample axis. The posts can be joined either externally or internally to form the loops supporting the rf field.
TElo 2
• •
XxX XxX
TEol I
Flo. 3. Mode diagrams and schematic drawings of two TE cavities used for ENDOR spectroscopy. Magnetic field lines are indicated by the dashed lines in the plane of the page; electric field lines are represented by the conventional dots and crosses which indicate vector lines perpendicular to the page. The four centrally located " p o s t s " in the accompanying schematics mark the position of the NMR probe described in the text.
[7]
CONTINUOUS WAVEENDOR SPECTROSCOPY
199
The simplest example of the parallel post design is a single loop of magnet wire that is cemented onto a quartz support (single wall tube or Dewar flask). The free leads of the magnet wire loop are connected to the remainder of the rf circuit, and the entire assembly is inserted into either of the two cavities mentioned above. This design can be elaborated by adding two more parallel posts and fashioning a Helmholtz coil; the posts/coil may be affixed to the side of a tubular support or permanently mounted within the cavity. ENDOR cavities so produced tend to have very high Q factors (10,000) owing to the inherently high Q of the starting cavity. The loop form of the rf probe or coil, however, is not efficient for generating an rf field because of its a large surface-to-current ratio. It is normally used for samples for which low rf field strengths (< 1 G) are adequate to drive the spin system. As the spin-lattice relaxation time of the sample decreases, higher rf current is required (see the following section for discussion of ENDOR enhancement and relaxation rates). Higher power can be attained using a coil wound with multistranded fine wire (e.g., Litz wire) to increase current capacity. As the number of wire strands increases, however, more metal is introduced into the cavity and further Q spoiling is risked. Powers greater than 100 W with such a coil system can generate higher rf fields but at the threat of melting the coil. The difference between analogous coils used in CW-ENDOR as opposed to NMR experiments is the manner in which they are used. An NMR Helmholtz coil is part of a tuned circuit that operates at a fixed frequency; power delivery is therefore efficient (and in modern spectrometers, pulsed), and heat losses are low. In a CW-ENDOR spectrometer the coil is not tuned and must be swept through a broad frequency range. An unmatched circuit (see below) tends to be inefficient in power handling, with resultant heating that can lead to catastrophic failure in coils of fine-gauge wire. A helical coil (solenoid) is a far better structure for generating a strong rf field at moderate power levels (100-300 W) but is not compatible with either of the two cavities discussed above. Biehl et al. z2 have incorporated a helical coil into a cylindrical T M l l o cavity so that the wire helix does not interfere with the electric field lines. This cavity/coil combination is ideal for general ENDOR spectroscopy because the coil may be elongated along its axis to provide a strong rf field over the entire active region of the microwave magnetic field of the cavity, that is, along the entire length of its central axis. It will accept a sample in a capillary tube, as well as an insert Dewar vessel and standard EPR quartz sample tube. z2 R. Biehl, W. Lubitz, K. M6bius, and M. Plato, J. Chem. Phys. 66, 2074 (1977).
200
PROBES OF METAL ION ENVIRONMENTS
[7]
The Q factor of the cylindrical TMHocavity is moderate (the unloaded Q of some commercial cavities were measured in the range of 5000 to 6000) and is spoiled to some degree by the finite pitch of the wire helix. Fanatical attention to detail in constructing helices for a Bruker 250ENB cavity is typically rewarded with loaded Q values of 1200-2000, depending on the quartz insert (C. J. Bender, unpublished observations, 1988); details of coil construction are outlined below. One useful feature of cylindrical cavities resonating in the TMHomode is that the resonant frequency is independent of the axial length, whereas the Q factor increases commensurately (up to a point). This feature allows optimization of cavity dimensions and Q for samples of a given volume. The Bruker ENDOR accessory is now the most commonly used commercial E N D O R unit. It employs a cylindrical TMHocavity, and a coil that can be wound and cemented onto a quartz Dewar flask or be a freestanding design. In the latter version the coil is wound on a Teflon template mandrel and held rigid with heat-shrink tubing. ~3 Once fabricated, the coil may be slid off the template and onto a cavity insert Dewar. A great advantage of the free-standing coil is that the design leaves the coil uncommitted to a single Dewar, thereby facilitating its handling, testing, and use. The typical coil consists of 16 turns of AWG 12 silver wire with an inside diameter of 10.0 mm (compatible with commercial Dewar inserts from Oxford Instruments and Wilmad Glass Co.) and a length (spacing between the brass end pieces) of 4.0 c m . 24 As the Bruker cavity has, for the most part, become an "industry standard," guidelines for preparing compatible coils follow. 1. The brass end pieces are generally fabricated first to ensure compatibility with both the cavity stacks and the Dewar insert. The inner diameter should be a close fit to the precision bore quartz tubing of the Dewar; the outer diameter must be adequate to make contact at the points where the BNC (or type N) spring contacts screw into the cavity stack. The remainder of the brass tube (i.e., below the region of electrical contact) is turned down to approximately the thickness of the wire that will be used to make the coil. 2. The template on which the coil will be wound is constructed of 0.25 inch (i.d.) by 0.50 inch (o.d.) Teflon tubing through which is forced a 0.250 inch (o.d.) brass rod. The brass core provides rigidity and prevents sagging during heating as the shrink tubing is applied (see Step 6). The template is then cooled at - 7 8 ° and turned on the lathe until the brass end pieces just slide onto the trimmed template when it is cold (several trimming 23 G. Hurst, K. Kraft, R. Schultz, and R. Kreilick, J. Magn. Reson. 49, 159 (1982). 24 C. J. Bender and G. T. Babcock, Rev. Sci. Instrum. 63, 3523 (1992).
[7]
CONTINUOUS WAVEENDOR SPECTROSCOPY
201
steps may be required). The idea is to have the template of such a diameter that the coil slides onto it when cold but is held tight when at room temperature. 3. With the brass end pieces positioned on the template, the coil is wound directly onto the template. Cowinding the wire with a heavy thread ensures a uniform spacing of the coil turns; optimal coil performance is achieved when the spacing between the individual turns is 1 to 2 times the wire diameter. The wire gauge selected will therefore depend on the number of turns in the coil. 4. Wire selected for coil construction may vary in composition and shape according to personal preferences. Round or square magnet wire may be used as described above; round wire may be flattened in a roller mill in order to minimize its tendency to creep. Phosphorbronze ribbon may also be used in place of wire; the pitch of a helix fashioned from the ribbon tends to be dictated by the width of the ribbon, so that interwinding spacing is best judged by eye. Current at radio frequencies is carried at a layer near the surface of the conductor (see standard tables of skin depth), and the composition of the wire can be selected from any number of metals, although economic constraints usually limit the choices to silver or copper. Because of the skin depth effect, it is important that the wire or ribbon used be free of surface imperfections and kinks. Long-term buildup of oxide also tends to limit lifetime of a coil, which may be extended by storing coils with an antitarnish pad ordinarily used for silverware. 5. The number of turns to an ENDOR coil depends on the frequency range that will be swept; 30-35 turns of narrow wire is adequate for frequencies below 6 MHz and 16-20 turns of larger wire above 5 MHz. Ribbon wire works well for constructing broad band coils because of its inherently low impedance, but it should be matched (see below) or operated in a manner to minimize heat radiation (the large relative surface area renders ribbon helices very good radiators of heat that will destabilize the tuned cavity). 6. Once wound, the coil leads are soldered to the brass end pieces. The coil can be held rigid during winding and soldering by overwrapping with Teflon tape. Best results have been achieved when the two ends are affixed at opposite sides of the coil. The thread spacer is then removed and heat-shrink tubing is applied. In the original description of free-standing coils, 23 the authors specify Kynar or Teflon heat-shrink tubing, but a word of caution is advised. Heat-shrinkable TFE Teflon does not flow well when heated and the individual turns of the coil may not be rigidly held in place. Kynar will flow well and grab the wire, but most grades of Kynar have dielectric constants too high for EPR applications. AIN Plas-
202
PROBES OF METAL ION ENVIRONMENTS
[7]
tics (Mount Vernon, NY) offers Kynar tubing suitable for use in the E N D O R cavity. SPC Technology manufactures a heat-shrinkable twolayer tubing consisting of an FEP Teflon inner tube that flows readily to encase the wire coil and an outer TFE Teflon layer that provides rigidity. The tubing is relatively thick, however, and may require turning on the lathe to make it conform to the ENDOR cavity. 7. Once the shrink tubing is in place, the coil and template are returned to the freezer, and the coil is removed for testing and use after the template has shrunk. Because the coil is prone to damage by rough handling, especially if pushed or pulled from the brass end pieces (the coil should always be mounted onto a Dewar flask by using a rotating motion, as though it were being screwed on), we recommend that the shrink tube be cemented to the brass end pieces. AIN Plastics sells a kit for chemically etching and cementing Teflon components; satisfactory results may also be obtained by abrading the edges of the Teflon heat-shrink tubing with a file and cementing the parts with cyanoacrylate. Other methods for modifying conventional EPR cavities for E N D O R spectroscopy or fabricating dedicated ENDOR cavities have been described.Z5, ~6 Last, the loop-gap resonator (LGR) has recently become popular in EPR studies, particularly for solution samples of limited size. z7 Although applications of the LGR to E N D O R were predicted, there have been few examples of a LGR-based ENDOR resonator, and these have been applied to pulsed experiments where the orthogonality requirement is lifted, zs'z9 Newton and Hyde have used the LGR design at S-band for CW-ENDOR studies, 3° but no X-band CW-ENDOR experiment that uses a LGR has been reported.
Impedance Matching of Electron Nuclear Double Resonance Coil The rf circuit that is used for ENDOR spectroscopy consists of a modulated source, an amplifier, and the coil. The source and amplifier are typically constructed to operate with a 50 ~ load, although most modern amplifiers (e.g., those made by ENI, Rochester, NY, and Amplifier Research, Souderton, PA) are built to accommodate any load imped25 j. S. Hyde, J. Chem. Phys. 43, 1806 (1965). 26 D. Schmalbein, A. Witte, R. R6der, and G. Laukein, Rev. Sci. Instrum. 43, 1664 (1972). 27 j. S. Hyde and W. Froncisz, in "Advanced EPR: Applications in Biology and Biochemistry" (A. J. Hoff, ed.), p. 277. Elsevier, Amsterdam, 1989. 28 j. Forrer, S. Pfenninger, J. Eisenegger, and A. Schweiger, Rev. Sci. lnstrum. 61, 3360 (1990). S. Pfenninger, J. Forrer, A. Schweiger, and Th. Weiland, Rev. Sci. lnstrum. 59, 752 (1988). M. E. Newton and J. S. Hyde, J. Magn. Reson. 95, 80 (1991).
[7]
CONTINUOUS WAVEENDOR SPECTROSCOPY
203
ance without failure. It is therefore common to operate an ENDOR spectrometer with an unmatched rf coil that is terminated with a 50 O dummy load. The impedance of the coil is typically lower than the nominal 50 fl value, but terminating with the load, in effect, clamps the total circuit impedance to some value near 50 fl. Because the load and line impedances are not exactly matched, the amplifier must be protected from rf power reflected from the coil. In a typical ENDOR circuit configuration a 50 lq line is connected to a coil of low impedance (-12 f~) that is then terminated with another section of 50 II line and the dummy load. Power reflections will occur owing to the mismatch in the cavity/coil. If inefficient power delivery were the only manifestation of operation in this manner, there would be little reason to match the ENDOR circuit since power can be simply increased. What is often overlooked, however, is the fact that the coil is a reactive circuit element, and its behavior may vary over the frequency range selected for a sweep of the ENDOR spectrum. At high frequencies inductive and capacitative circuit elements exhibit a frequency-dependent impedance. The characteristic impedance of an ideal capacitor or inductor will vary inversely or directly with applied frequency. Real circuit components, however, each possess resistive, capacitative, and inductive properties, and therefore may resonate at a specific frequency. At this resonant frequency the impedance characteristics of a circuit element will dramatically change; a capacitor will begin to behave as though it were an inductor, and vice versa. The dimensions of the rf coil used in ENDOR studies usually preclude self-resonance, but other parasitic reactances may lead to a spurious resonance condition. For example, the cavity wall is incorporated into the rf circuit when the coil is terminated with a 50 O load. The cavity wall is at ground relative to the coil, and a parasitic capacitance develops between the coil and ground. Measurements of this parasitic capacitance in a TM~o cavity indicate that the capacitance is on the order of 100 pF at 10 MHz, and a characteristic impedance plot of the ENDOR circuit reveals a resonance in the region of 30 MHz that can be attributed to the parasitic capacitance. 24 The spurious resonance can be associated with baseline artifacts that commonly appear at the same frequency. An impedance matching network can eliminate the problem of spurious circuit resonances while making rf power delivery more efficient. A servodriven impedance matching circuit (Fig. 4C) that continuously adjusts a trimmer capacitor in response to a phase measurement has been described. 3~ A broadband match can also be achieved with transformers or 31 j. Forrer, A. Schweiger, and H. H. Giinthard, J. Phys. E: Sci. lnstrum. 10, 470 (1976).
204
PROBES OF METAL ION ENVIRONMENTS ¢ . . . . .
C
i
[7]
13
D
FIG. 4. N e t w o r k s u s e d to m a t c h E N D O R coils to 50 f~ lines. See text for details and references.
a wideband (i.e., low Q) matching network. Ruthroff 32 and Sevick 33 offer expositions on the construction and use of transformers as matching components. The simplest example is a 1 : 4 transformer that consists of several turns of magnet wire wound on an iron-powder toroidal core (Micrometals, Inc., Annaheim, CA). A 1:4 ratio is used because the coil typically has an impedance of 12 ~ . Alternatively, a broadband matching network may be used to match the coil to the 50 f~ line. Peri6 and Dulcic 34 describe a circuit of two parallel branches, the first branch consisting of the coil and a 50 ~ resistor and the second of a variable capacitor and another 50 f/resistor. The two branches supply inductive and capacitive reactance, the resistors serving to clamp the impedance at or below 50 ~. Parasitic reactances of the coil/ cavity ensemble are, however, neglected. To eliminate these resonances, a matching network was devised by adding a capacitor in series and an inductive shunt to the circuit. 24 The resultant circuit makes up what is known as a zr network and showed none of the self-resonance properties found in the coil/cavity combination alone. Figure 4 illustrates four networks that describe the ENDOR coil and impedance matching circuit elements. The network of Fig. 4D is an adaptation based on an antenna tuner described by Brumbaugh 35 and provides a quick means of general matching to a nonspecific coil. The same multiple 32 C. L. Ruthroff, Proc. 1. R. E., 1337 (1959). 33 j. Sevick, " T r a n s m i s s i o n Line T r a n s f o r m e r s , " 2nd Ed. A m a t e u r Radio League, Newington, Connecticut, 1990. 34 M. Peri6 and A. Dulcic, J. Phys. E: Sci. Instrum. 14, 700 (1981). t5 j. F. B r u m b a u g h , Amat. Radio Today, 46 (1991).
[7]
CONTINUOUS WAVEENDOR SPECTROSCOPY
205
C
D
GSOURCE
RL FIG. 5. Circuit representation of the magic tee coupler, and its use for matching an ENDOR probe in situ.
tapped inductor (Radiokit) can be used in the matching network described by Bender and Babcock 24 (4D). The 50 12 resistors depicted in Fig. 4B,D correspond to the high power loads; in the Peric and Dulcic network (Fig. 4A), these are 50 12 noninductive wire-wound resistors. High-wattage wire-wound resistors are difficult to find but may be substituted by three 150 12 resistors in parallel. The measurement of impedance and the reactance parameters (L, C) of a component is not crucial to the design of an effective ENDOR coil and matching circuit. A simple method of matching a circuit has been described by Fukushima and Roeder. 36 Two transmission lines are balanced using a magic tee, a four-port device that splits an rf signal with phase coherence on all but one port, which is shifted by 180° (Fig. 5). A low-power 50 12 termination is attached to port A (Fig. 5); the frequency synthesizer is attached to port C, an oscilloscope to port D, and the ENDOR circuit to port B. The rf signal at port C is delivered at ports A and B with relative phase shifts of 180°. Because ports A and B (Fig. 5) are terminated, the rf signals on each arm are reflected back to the magic tee and recombined at the output, port D. If the impedance of both arms is the same, there will be no further phase shift of the signal and the two 36 E. Fukushima and S. B. W. Roeder, "Experimental Pulsed NMR: A Nuts and Bolts Approach." Addison-Wesley, Reading, Massachusetts, 1981.
206
PROBES OF METAL ION ENVIRONMENTS
[7]
signals combined at D should null each other because of the 180° shift imposed by the magic tee. Matching of the ENDOR network is therefore achieved by adjusting circuit components until the signal detected on the scope is minimized.
Triple Resonance Double ENDOR, or Triple resonance, spectroscopy is a technique often used to determine the relative signs of hyperfine coupling constants and establish the number of equivalent nuclei contributing to a given ENDOR transition. 37 In applying this technique, one or more ENDOR transitions are saturated; and the enhancement of other ENDOR lines is observed. There are two types of Triple resonance schemes, General and Special. During a General Triple experiment a single transition is saturated with a " p u m p " rf field as the ENDOR spectrum is swept. In Special Triple both components of an ENDOR pair are simultaneously driven while detecting the saturated EPR signal. Details of the Triple resonance phenomenon are covered in the theory section (see below). Instrumental requirements for Triple resonance studies include a second rf source and a device for combining two rf signals. A power combiner may be used for General Triple; a double balanced mixer is required for Special Triple. Modulation is usually applied to the scanning rf field, although sometimes the pump field is modulated. A Wavetek (Model 3000446, San Diego, CA) modulated rf source and a second programmed test source (PTS-160; PTS, Inc., Littleton, MA) source with a Bruker ER250 ENDOR accessory are used at Michigan State University (East Lansing, MI). For General Triple experiments the rf output of both rf sources is fed to a power combiner prior to amplification. Because the power meter cannot discriminate by frequency, the lowest power level (i.e., the sweep) is set first. Special Triple experiments are performed in a similar manner. The PTS source is programmed for the nuclear Larmor frequency37a and fed to the local oscillator (LO) port of a mixer. The modulated rf sweeper is then programmed to sweep upward from 200 kHz, and this output is fed to the rf (R) port of the mixer. At the X port of the mixer modulated rf fields of frequenciesfzrs -+ fsweepare obtained, and this port is connected to the input of the power amplifier. Care must be taken in selecting a mixer for Special Triple experiments because their specifications vary by a considerable amount. Triple requires an output of rf signals at frequencies fl -+ f2, free of harmonics (fl --+ nf2) and leaks (f~ and f2)- These requirements translate to a high isolation, 37 K. M6bius, M. Plato, and W. Lubitz, Phys. Rep. 87, 171 (1982). 37a In solid systems where g is anisotropic, the ENDOR spectrum is often asymmetric about the nuclear Larmor frequency, so that appropriate corrections should be made.
[7l
CONTINUOUS WAVE ENDOR SPECTROSCOPY
207
40-60 dB, between the X port and the R and L O ports. Two r e c o m m e n d e d mixers are the double-balanced Anzac 37(Burlington, MA) and the HewlettPackard (Cupertino, CA) Model 10514 or 10534, which perform well at low input frequencies. Unfortunately, the Hewlett-Packard mixers are now discontinued items, but they can often be found on the used equipment market. Triple resonance has been most successful in spin systems with E N D O R lines that are homogeneously broadened and easily saturated, particularly radicals in solution 37'38 and some crystalline solids. 39-42 E N D O R spectra of p o w d e r samples are inherently broadened inhomogeneously owing to the random orientation of individual spins relative to Ho. When a General Triple experiment is conducted on such a sample, the pump rf field will burn a hole in the spectral line rather than saturate it. The theory of inhomogeneous line broadening suggests certain properties of spin-spin relaxation p h e n o m e n a 43 that, in principle, may facilitate adjustment of experimental parameters to alleviate the so-called triple problem. An easier approach is to broaden the spectrum of the rf pump. This can be done by applying FM to the pump, pulse modulating the pump, or "clipping" the sine waves of the rf signal. The latter two methods broaden the spectrum of the rf signal by introducing additional Fourier components. The same effect can be achieved by mixing the rf carrier with a noise source to enhance sensitivity in powder E N D O R studies. Electron Nuclear Double Resonance Experiment: T h e o r y and Application In a static magnetic field, the population difference between electron energy levels in a paramagnetic system at thermal equilibrium is given by the Boltzmann distribution. When the paramagnetic system is irradiated with high microwave power at its resonant (Larmor) frequency in that field, the population difference between EPR levels specified by the Boltzmann distribution is reduced or obliterated if power is absorbed faster than it can be dissipated by nonradiative relaxation mechanisms. The spin system is then said to be saturated, and one observes a concomitant loss in EPR signal intensity. 38H. Kurreck, B. Kirste, and W. Lubitz, "Electron Nuclear Double Resonance Spectroscopy of Radicals in Solution." VCH, Weinheim, 1988. 39j. R. Niklas, R. U. Bauer, and J.-M. Spaeth, Phys. Status Solidi 171, 1196 (1983). 40N. S. Dalai and C. A. McDowell, Chem. Phys. Lett. 6, 617 (1970). 41W. Kolbe and N. Edelstein, Phys. Rev. B 4, 2869 (1971). 42D. A. Hampton and G. C. Moulton, J. Chem. Phys. 63, 1078 (1975). 43C. P. Poole and H. A. Farach, "Relaxation in Magnetic Resonance." Academic Press, New York, 1971.
208
[7]
PROBES OF METAL ION ENVIRONMENTS
In the CW-ENDOR experiment, the static magnetic field is fixed at or near the center of the EPR line of interest while the electron resonance is microwave power saturated. Should the electron spin be coupled to a nuclear spin, however, the loss of intensity resulting from saturation may be restored in part by inducing transitions between nuclear spin states. Such transitions open new relaxation pathways for the electron, thereby returning some of the lost population difference. In practice, the sample is swept over a continuous range of radio frequency fields encompassing nuclear transitions of interest. As the radio frequency field sweeps through a nuclear transition, the change in EPR intensity is detected by the EPR spectrometer, thereby generating the ENDOR spectrum. The E N D O R phenomenon is best explained by using a four-level energy diagram that represents a S = ½, I = ½spin system (Fig. 6). The lefthand side of Fig. 6 illustrates the effect of Zeeman splitting, and this pattern of four energy levels is spatially modified in the right-hand side of Fig. 6 in order to facilitate the discussion. Allowed radiation-induced transitions are denoted by arrows; dashed lines indicate relaxation pathways. In the absence of saturating microwave or radio frequency fields, the relative population of the four spin states is determined by the Boltzmann distribution. Ignoring, for the time being, relaxation pathways of Fig. 6, either of two EPR transitions can be saturated, and the corresponding nuclear sublevels will become equally populated. A subsequent sweep of the NMR spectrum will induce two transitions: I - - } ~ I - +} and I+ + } ~ I + - ) . These NMR transitions will depopulate one or the other
I+-> ,,_
fill
!r,o ,
i
/
\ /
,,_
?,
l]ir, o \
Jl.;
/ITx/~\ v,
I---->
,
~ONIC ZEEMAN
NUCLEAR ZEEMAN
I
I-÷>
FIG. 6. Electron a n d nuclear Z e e m a n splitting (left) a n d spectroscopic description o f the E N D O R p h e n o m e n o n in a s y s t e m with S = ½, 1 = ½ (right). D a s h e d lines indicated by T t e r m s are the relaxation p a t h w a y s that c o m p e t e with radiation-induced transitions (arrows).
[7]
CONTINUOUS WAVEENDOR SPECTROSCOPY
209
energy level associated with the saturated EPR transition, and there will be an enhancement of the detected EPR signal. The conceptual nature of the experiment is unchanged by taking into account the various relaxation routes. What now becomes important is the relative magnitude of the spin relaxation rates and the rate of the radiation-induced transitions. In short, the success of an ENDOR experiment depends to a great extent on balancing the kinetics of energy level transitions. The probability of a radiation-induced transition is proportional to the intensity of the radiation field, so that a necessary condition for a successful ENDOR experiment is that the NMR transition rate be greater than the spin relaxation rate, 44,44a l/Tle ( o r We). This means that factors such as the applied rfpower and temperature will be experimentally controllable variables that affect the success of observing an ENDOR enhancement. Somewhat less influential are the cross-relaxation pathways indicated in Fig. 6 by Tx and Txx. In general, cross-relaxation occurs because of the finite width of spectral lines, and when these lines overlap, mutual spin flips are possible. Txx is a process that only becomes relevant when the hyperfine interactions are anisotropic45; under such conditions the transition I+ + ) ~ I- - ) becomes partially allowed. Relaxation by these routes is relatively slow for most spin systems, hence their diminished role in determining whether an ENDOR experiment will succeed. Usually, the effect of cross-relaxation is seen in the intensity of a line corresponding to a single nuclear sublevel. For example, when one of the two transitions of an ENDOR spectrum are missing, cross-relaxation is typically blamed. 6 The effects of cross-relaxation on the intensity of ENDOR lines and experiments to verify this mechanism are covered in several texts and reviews.43, 45-48
One of the lessons of this relaxation-dependent analysis of the ENDOR enhancement is that the signal intensity of an ENDOR experiment will be strongly influenced by those factors that govern the relaxation rates 44 L. Kevan and L. D. Kispert, "Electron Spin Double Resonance Spectroscopy." Wiley, New York, 1976. 44a Spin lattice relaxation is a nonradiative process that returns the spin system to thermal equilibrium. 45 A. Abragam and B. Bleaney, in "Electron Paramagnetic Resonance of Transition Ions." Oxford Univ. Press (Clarendon), Oxford, 1970. 46 N. M. Atherton, in "Multiple Electron Spin Resonance Spectroscopy" (M. M. Dorio and J. H. Freed, eds.), p. 387. Plenum, New York, 1979. 47 j. H. Freed, in "Electron Spin Resonance in Liquids" (L. T. Muus and P. W. Atkins, eds.), p. 387. Plenum, New York, 1972. 48 j. Owen and E. A. Harris, in "Electron Paramagnetic Resonance" (S. Geschwind, ed.), p. 427. Plenum, New York, 1972.
210
PROBES OF M E T A L ION E N V I R O N M E N T S
[7]
of the spin system. The signal obtained in a steady-state ENDOR experiment is not analogous to the signal measured in a swept field NMR experiment, and line intensities are not simply proportional to the relative numbers of contributing nuclei. The relative intensity of the ENDOR lines corresponding to each of the nuclei will depend on the nuclear spin relaxation times. If these relaxation rates differ by a substantial amount, integrated line intensities will not reflect the number of contributing nuclei. For this reason, it is a risky practice to use spectral subtraction as a means to resolve hidden ENDOR lines. A further difficulty lies in guaranteeing a reproducible rf field from sample to sample; Triple resonance is required for reliable quantitative analysis. Experimental factors affecting the relaxation parameters of an electron-nuclear spin system will, in turn, influence the quality of the ENDOR spectrum. This means working with spin concentrations sufficiently small to eliminate Heisenberg exchange effects. Sometimes deoxygenating the sample improves ENDOR spectral quality. The secondary structure of a globular protein usually provides insulation that prevents spin-spin interactions between whatever paramagnetic species is located at its " c o r e . " It is often advantageous to concoct a solvent system that forms an isotropic, homogeneous glass on cooling. With protein samples this can be achieved with a supporting buffer solution that is 50% by volume in either glycerol or ethylene glycol, or 2.5-3.0 M in sodium perchlorate. Optimal conditions must be found by trial and error. The principal benefits of ENDOR over conventional EPR spectroscopy are the simplicity and greater resolution of the hyperfine spectrum. The number of lines in an EPR spectrum subject to nuclear spin-spin coupling are determined by a multiplicative law; this law is additive for the ENDOR experiment. Two ENDOR lines are observed for each set of equivalent coupled nuclei, and these pairs of ENDOR lines are typically denoted v_ and v+. The additive nature of ENDOR lines greatly facilitates the determination of hyperfine coupling constants, as can be seen by comparing the EPR and ENDOR solution spectra of the 1,4-naphthosemiquinone radical anion (Fig. 7). In the ENDOR spectrum, the three distinct proton groups (i.e., at ring positions 2,3; 5,8; and 6,7) yield three pairs of ENDOR spectral lines that are designated by letter in Fig. 7; labels a and a' denote paired E N D O R transitions v_ and v+, respectively. In contrast, these six protons would generate 64 EPR lines, not all of which would necessarily be resolved. The much greater resolving power of ENDOR can also be appreciated in Fig. 7. First, the widths of the ENDOR lines are of the order of 10 kHz, which is considerably narrower than those of an EPR spectrum. Second, the weak couplings of the protons at ring positions 5-8 are clearly
[7]
CONTINUOUS WAVE ENDOR SPECTROSCOPY
211
A FIc. 7. EPR and ENDOR spectra of the 1,4-naphthosemiquinoneanion radical. The much simpler ENDOR spectrum clearly resolves the hyperfine coupling constants of the three nonequivalent proton types. resolved in the E N D O R spectrum (labeled a and b, Fig. 7). Such small couplings ( 1½A[ or at v_+ = [½A -+ b,.l if vn ~- I½AI. If quadrupole interactions are a factor, an additional term is added (see below).
214
PROBES OF METAL ION ENVIRONMENTS
[7]
In the absence of quadrupole interactions the hyperfine coupling is read directly from the ENDOR spectrum according to the aforementioned rule. One can then compute the spin density of that nucleus by using a McConnell relation Aiso = Qp
(1)
where p denotes the spin density at the nucleus. The proportionality factor is called the Q value (distinct from the cavity Q value and quadrupole constant) and will vary among the types nuclei studied. Strongly coupled protons are classified by their proximity to the carbon bearing the unpaired spin density. One denotes these protons directly bound to that carbon as an a proton. Protons bound to a carbon that is itself bound to a carbon bearing unpaired spin density are denoted /3 protons, and so forth. For most cases, only o~ and/3 protons contribute to the hyperfine structure of an electron magnetic resonance solution spectrum. The value of Q in the McConnell relation for ot protons, Aiso = Qp, varies for the type of C - H fragment. The Q value represents an overlap of sorts between the molecular orbitals of the adjacent p and s orbitals57and for this analysis approximates - 7 0 MHz. 53 The/3 proton couplings are subject to an analysis similar to that of protons except that the Q value is dependent on the rotational angle about the C~-C~ bond axis. Neglecting a small constant factor, the isotropic coupling constant for/3 protons is Aiso =
Blp
COS 2 0
(2)
where 0 is the dihedral angle that is defined by the axis of the Pz orbital on which the spin density resides and the C~-H~ bond, 58 and B 1 is on the order of 160 MHz. 59The contribution for a rotationally averaged/3 proton would be Aiso = ½Blp. Analysis of spectra obtained from solid samples is complicated by the contributions of anisotropic terms. In the solid state the dipolar interactions between the unpaired spin and atomic nuclei are no longer motionally averaged out, and the resultant ENDOR powder spectrum contains the principal (i.e., diagonal) terms of the hyperfine tensor as the turning points of the powder pattern. In other words, the powder ENDOR line may be axial or rhombic and subject to analysis as with the analogous EPR line shape. 49 For ot protons, the dipolar contribution to the hyperfine tensor leads to a rhombic ENDOR line with turning points at approximately 57 H. M. M c C o n n e l l and D. B. C h e s t n u t , J. Chem. Phys. 28, 107 (1958), 58 W. Derbyshire, Mol. Phys. 5, 225 (1962). 59 R. W. F e s s e n d e n and R. H. Schuler, J. Chem. Phys. 39, 2147 (1963).
[7]
CONTINVOVS WAVEENDOR SPECTROSCOPY
215
1Also, Also, and ~z' o3A Xis .49'60A/3 proton appears as an axial line, and in certain cases, such as a methyl group, this axial line will further split into three axial lines as rotational averaging about the C~-Ct3 bond ceases. The highly resolved ENDOR spectrum now becomes very useful because it permits further analysis of the hyperfine tensor of a molecule to derive structural or electronic information based on the two models of dipolar interaction. The simplest analysis follows from the point dipole approximation, which applies to interactions between a nucleus and an electron in a spherical orbital or when the interaction distance is large (>3-4 ,~). Using this approximation, one obtains an axial dipolar contribution to the hyperfine tensor with one term
A.± =-pg/3/3nlzI-lR
3
(3)
where the subscript ~ denotes a dipolar hyperfine coupling component, /3 terms are the Bohr magneton of the electron and nucleus, R is the distance over which the interaction occurs,/x is the magnetic moment of the nucleus, and I is its spin. In units that are convenient for the analysis of ENDOR spectra (i.e., megahertz), A~± = - 14.1ptzI-1R -3
(4)
It follows that the second term of the axial dipolar interaction is A~,IL= - 2 A , ± . At shorter interaction distances (e.g., the proton adjacent to the p orbital in the C~-H~ fragment) the point dipole model must be replaced by one that corrects for changes in symmetry and effective distance of interaction. 61 In a molecular system the unpaired electron spin is often delocalized over more than one atomic center, and the dipolar interaction for a given nucleus is not limited to its nearest neighbor. For a delocalized spin system a method described by Heller and Cole 62 can be used. This procedure entails the independent computation of all dipolar interactions for a given nucleus, followed by rotation of each of the tensors onto a common axis. The coincident tensors are then diagonalized and summed to give the total dipolar hyperfine contribution. 5z,63 The utility of this procedure is that
6o H. M. McConnell, C. Heller, T. Cole, and R. W. Fessenden, J. Am. Chem. Soc. 82, 766 (1960). 61 W. Gordy, "Theory and Applications of Electron Spin Resonance." Wiley, New York, 1980. 62 C. Heller and T. Cole, J. Chem. Phys. 37, 243 (1962). 63 C. J. Bender, M. Sahlin, G. T. Babcock, B. A. Barry, T. K. Chandreshekar, S. P. Salowe, J. Stubbe, Lindstr6m, L. Petersson, A. Ehrenberg, and B.-M. Sj6berg, J. Am. Chem. Soc. 111, 8079 (1989).
216
PROBES OF METAL ION ENVIRONMENTS
[7]
it permits one to fine-tune the spin density distribution and therefore (indirectly) the Q value of an electron-nuclear interaction if one is provided with a good estimate of the molecular structure. It conversely allows one to predict a structure if one is given an accurate estimate of the spin density distribution. A detailed description of the procedure as applied to the first scenario has been given during the analysis of the ENDOR spectrum of the tyrosyl radical of ribonucleotide reductase. 63 The hyperfine coupling constant of nitrogen is subject to a similar McConnell-like analysis. The nuclear spin of ~4N, I = 1, leads to a triplet splitting of each electronic Zeeman level. As part of a r r system the unpaired electron spin is associated with a p orbital on the nitrogen, whose symmetry imparts an axial line shape to the anisotropic hyperfine tensor. The resultant spectral features occur at All = Aiso + 2A~, and A± = Ais o A~. The isotropic coupling constant is often related to the spin density on nitrogen in a manner similar to that of a proton, that is, A~soN = QNON, where the Q value of 14N is taken to be approximately 56 M H z . 61 The orbitals of atoms such as nitrogen and carbon hybridize in their molecular structures and hence are not described by pure hydrogenlike atomic orbital functions. The total spin density contribution may possess some s-orbital character. Spin polarization of the tr bonds and lone pair electrons will also affect the hyperfine coupling of an ~4N nucleus in an extended ~- system. The sign of the hyperfine interactions due to the polarization effects may differ from that of the principal contribution (i.e., the p orbital), which is why in many cases the simple McConneU relation given in the previous paragraph tends to overestimate measured nitrogen couplings. The analysis that corrects for the various inductive effects was first derived for the analogous problem of relating hyperfine coupling constants to the spin density of 13C. The concept is quite simple and entails a decomposition of the total isotropic coupling constant into a sum of individual McConnell-like relations; the first analysis of l a N hyperfine coupling constants 64 contains an extra constant, but in its simplified form the corrected McConnell relation for nitrogen couplings
is 61
Ai~o = QIp= + Qz ~ Pi
(5)
where the summation is taken over the various secondary interactions arising from spin polarization, hybridization, etc. The relevance of this decomposition scheme to the topic of the chapter is that the ENDOR 64 E. W. Stone and A. H. Maki, J. Chem. Phys. 39, 1635 (1963).
[7]
CONTINUOUSWAVEENDOR SPECTROSCOPY
217
technique greatly facilitates the analysis of ~4N couplings because anisotropic terms of nitrogen and proton hyperfine interactions can be picked out, and the latter used as a "check." 65 Single crystals of metalloproteins suitable for study by EPR and ENDOR are rarely available. Frozen solution spectra reflect a powder pattern of all molecular orientations relative to the applied magnetic field. Because the spin Hamiltonian terms are tensors, the spectroscopic parameters of the system are strongly dependent on orientation, often confounding unambiguous interpretation. Single-crystal-like ENDOR spectra may be obtained, however, by saturating the so-called turning points of the EPR powder spectrum,66-68 thereby selecting for resonance a small population of the sample in which spins are distributed along a narrow solid angle with a comparatively discrete orientation of the hyperfine tensor to the applied magnetic field. Under such conditions relatively narrow angleselected lines are obtained, which greatly facilitates the interpretations of hyperfine couplings. As demonstrated by Rist and Hyde, 67-69 singlecrystal-like ENDOR spectra of a nitrogen nucleus yields four lines with energies of v = 1½A -+ v. - Q'I, where v. is the nuclear Larmor frequency and Q' is the quadrupole interaction. Axially symmetric paramagnetic metal complexes yield a second case of powder ENDOR spectra amenable to simplified analysis. 53'69If hyperfine and quadrupole reference frames are colinear and corresponding tensors have axial symmetry, then the ENDOR resonant frequencies are given by v = I½A~cos 2 0 + ½A2 sin 2 0 -+ Q'(3 cos 2 0
--
1) ± vnl
(6)
where 0 represents the angle between the applied magnetic field and the z axis of the hyperfine and quadrupole tensor. 69 From the analysis of Eq. (6) by Rist and Hyde, 69 integral averaging at EPR turning points yield maxima from which it is possible to obtain the quadrupole, Zeeman, and hyperfine terms. A case study is provided in the analysis by Rist and Hyde of powder ENDOR spectra of planar copper complexes. 69 The Triple resonance technique can be used to glean further infor/'nation from the electron-nuclear hyperfine interactions. As described previously, there are two distinct experimental techniques: (1) General Triple, in which a single NMR transition is saturated while the ENDOR spectrum 65 W. H. Nelson, F. M. Atwater, and W. Gordy, J. Chem. Phys. 61, 4726 (1974). 66 T. Doyle, Phys. Rev. 126, 1421 (1962). 67 G. H. Rist and J. S. Hyde, J. Chem. Phys. 49, 2449 (1968). 68 G. H. Rist and J. S. Hyde, J. Chem. Phys. 50, 4532 (1969). 69 G. H. Rist and J. S. Hyde, J. Chem. Phys. 52, 4633 (1970).
218
VROaES OF METAL ION ENVIRONMENTS
[7]
is recorded, and (2) Special Triple, during which in the course of the rf sweep both the upper and lower NMR transitions of a given nucleus are driven simultaneously.37'7° General Triple is used to determine the relative signs of the hyperfine coupling constant. Although the sign of a given hyperfine coupling constant follows from the McConnell relation, there are times when experimentally determining the sign will aid in an assignment. For example, when the magnitude of the dipolar hyperfine terms exceeds the isotropic component one gets a mix of positive and negative principal hyperfine terms. The theory of Triple is simply explained for an S = ½ system with coupled nuclei. Energy levels are divided into an upper and lower spin manifold (m S = + ½, and m s I, respectively). If A > 0 for a given nucleus, then its low-frequency ENDOR line v_ comes from an NMR transition in the upper manifold; v+ for this nucleus arisies from the NMR transition in the lower spin manifold. The converse holds for nuclei with A ½ without simplifying assumptions, although to our knowledge simulations by direct diagonalization of E N D O R spectra from metalloproteins with S > ½ have not yet been reported. F o r systems with S = ½, the matrix diagonalization approach is relatively simple and powerful for extracting hyperfine coupling matrices from experimental spectra. TM Probably the most useful and used strategy for simulating and interpreting E N D O R spectra for systems with S = ½, or that can be represented with an effective spin S' = ½, is that advanced by Hoffman and colleagues. 79'8° At the heart of the method is the perturbation expression presented by Rist and H y d e 69 v+ = Ia/2 +- VNI
(7)
where vN is the nuclear L a r m o r frequency. Since A in Eq. (7) may not be constant along orientations of constant g, the task in simulation is to calculate the appropriate value of the hyperfine coupling, A. 73 F. K. Kneub0hl, J. Chem. Phys. 33, 1074 (1960). 74 R. Aasa and T. Vanngard, in "Paramagnetic Resonance" (W. Low, ed.), Vol. 2, p. 509.
Academic Press, New York, 1963. 75A. S. Yang and B. J. Gaffney, Biophys. J. 51, 55 (1987). 76C. P. Keijzers, E. J. Reijerse, P. Stam, M. F. Dumont, and M. C. M. Gribnau, J. Chem. Soc., Faraday Trans. 1 83, 3493 (1987). 77m. Kreiter and J. Htittermann, J. Magn. Reson. 93, 12 (1991). 78G. J. Baker and J. B. Raynor, J. Chem. Soc., Faraday Trans. 1 84, 4267 (1988). 79B. M. Hoffman, J. Martinsen, and R. A. Venters, J. Magn. Reson. 59, 110 ~1984). 8oB. M. Hoffman, R. A. Venters, and J. Martinsen, J. Magn. Reson. 62, 537 (1985).
[7]
CONTINUOUS WAVEENDOR SPECTROSCOPY
221
The initial step is to calculate the curve of points, S, as a function of the polar orientation angles 0 and ~b, corresponding to the value of g selected in the EPR spectrum by the fixed observing field. At any given frequency z,, an orientation along S will contribute to the ENDOR intensity if the hyperfine coupling at that orientation satisfies the resonance condition, u = /"-+ENDOR"The expected ENDOR intensity at frequency u will thus reflect the sum of probabilities that the hyperfine couplings taken over all points along S satisfy Eq. (4). In analogy to methods commonly used for the simulation of EPR spectra, 74'81 a shape function is defined for the probability that the hyperfine coupling assumes a particular value of A at the observing field defined by g: N(A+_)g =
[(SS/SA. )e[
(8)
The ENDOR intensity at frequency ~ is then the combined contributions from N ( A + ) g and N ( A _ ) g . The problem now is to calculate the shape functions N ( A _ )g. It is convenient to take the frame in which the g matrix is diagonal as the reference coordinate system. The orientation of the observing magnetic field must be specified in this frame, and the frame in which the hyperfine matrix is diagonal must be transformed to the reference coordinate system. 45'79 The principal values of the A matrix in its own frame, and the rotation angles, are then adjustable parameters in the simulation program. When the g and A matrices are coaxial, calculations are straightforward: ~ 2)1x 2 + (gy2 _ gz2)ly2 ( g 2 _ gz 2) = (gx 2 -- gz (A 2 -
A z 2)
(Ax 2
Az2)lx 2 + ( A y 2 - Az2)ly 2
(9) (10)
The polar angles 0 and th (or, equivalently, direction cosines) are obtained as functions o f g x , gy , gz , and g, and A x , Ay , A z , and A from the simultaneous Eqs. (9) and (10). Because S, the locus of points at constant g, also depends on 0 and qb, 1(SS/SA)gl becomes a calculable quantity. If the A and g tensors are not coaxial, the A tensor is rotated from the coordinate system in which it is diagonal to the g reference frame. The Euler angles involved in the transformation are then additional adjustable parameters in the simulation. Calculation of A, and of I(6S/3A)g I, becomes more tedious but is still tractable. In either case, the ENDOR spectrum is obtained by stepping through the range of A of experimental interest. The intensity calculated at each value of A is multiplied by a hyperfine or ff enhancement factor, z,/vN , reflecting the increase in effective radio frequency field perceived by the 81 A. D. Toy, S. H. H. C h a s t o n , J. R. Pilbrow, and T. D. Smith, lnorg. Chem. 10, 2219 (1971).
222
PROBES OF METAL ION ENVIRONMENTS
[7]
nucleus owing to its hyperfine interaction with the electron spin. 82 A persistent difficulty in simulating ENDOR spectra is the inability to compute transition probabilities reliably, as these depend on both EPR and NMR transitions, TM as well as on the physical characteristics of the ENDOR coil used for rf irradiation of the sample. The usual, and usually successful, approximation is to set all ENDOR transition probabilities to unity by using a constant line shape function in the convolution of 8 function spectra. An implicit assumption in the foregoing is that the components of EPR and ENDOR spectra are 8 functions arrayed over fields or frequencies in the simulations. To achieve a more realistic and useful simulation these restrictions must be relaxed. First, an ENDOR line shape function is used to convolve the calculated 8 function frequencies arising over the curve of constant g. A second convolution introduces broadening effects of finite EPR line widths. The net result is an overall broadening of the double-8 function simulation, although important details in simulated spectra usually survive such broadening. A difficulty in the first-order perturbation approach of Eq. (4) may arise when the hyperfine interaction of interest is dominated by dipolar coupling, rather than contact interaction, so that the A tensor is highly anisotropic and even asymmetric, although still diagonalizable with real eigenvalues, 83 In such instances electron and nuclear spins may be quantized along different directions, and the ENDOR frequencies may not be symmetric about the nuclear Larmor frequency at all g values represented in the EPR spectrum. This potential difficulty, which may be of greater theoretical than practical consequence, is circumvented when spectra are simulated by diagonalization of the matrix of the full spin Hamiltonian. 76'78 The general approach is to calculate ENDOR frequencies over the range of azimuthal angles 0 and ~b determined by the value of g at the observing field. Principal values of the A matrix are approximated from ENDOR at turning points of the EPR spectrum, then varied to optimize the fit of the simulated to experimental spectrum. The orientation of A and g tensors with respect to one another is similarly varied; the entire fitting procedure is essentially an interactive, iterative process. When a satisfactory fit is achieved, the 8 function (stick) spectrum may be convolved with a line shape function, usually a Gaussian. The result is a simulated ENDOR powder spectrum that takes on the characteristics of a single-crystal 82 S. Geschwind, in "Hyperfine Interactions" (A. J. Freeman and Frankel, R. B. eds.), p. 225. Academic Press, New York, 1967. 83 G. C. Hurst, T. A. Henderson, and R. W. Kreilick, J. A m . Chem. Soc. 1071 7294 (1985).
[7]
CONTINUOUSWAVEENDOR SPECTROSCOPY
223
ENDOR spectrum at appropriate turning points in the EPR spectrum. A general program for simulating EPR, ENDOR, and ESEEM (electron spin echo envelope modulation) spectra has been developed, 76 but it is so computationally intensive as to require a fast mainframe computer to run in reasonable times. In contrast, the perturbation approach taken by Hoffman and colleagues can be implemented easily on a personal computer. Lines predicted in simulation programs are not always evident in experimental spectra. Sometimes, the difficulty is experimental, when microwave or radio frequency power is not optimized to achieve proper saturation of transitions under study. Occasionally, the problem is one of cross-relaxation: two lines at the same frequency may broaden one another beyond detectability of either. 6 In such case, a judicious choice in experimental microwave frequency may relieve the disparity between experiment and prediction. 6
I l l u s t r a t i v e E x a m p l e s : E l e c t r o n N u c l e a r D o u b l e R e s o n a n c e Studies of M e t a l l o p r o t e i n s with S -- ½
Iron-Sulfur Proteins As already indicated, two-iron ferredoxins from a variety of sources, enriched with 57Fe, were among the first metalloproteins studied by ENDOR spectroscopy. EPR spectra of these proteins revealed g tensors of nearly axial to rhombic symmetry, with little or no resolved hyperfine structure apparent in spectra. TM Hyperfine interactions, however, were strikingly evident in X-band ENDOR spectra of the reduced state of the proteins and could be explained taking an S = ~ ground state, as expected of one high-spin Fe(III) antiferromagnetically coupled to a high-spin Fe(II). Difference ENDOR spectroscopy of proteins freed of iron and reconstituted with either 57Fe or 56Fe essentially restricted features to those generated by hyperfine interactions of the unpaired electron with the magnetic iron nucleus. Proof that observed ENDOR lines actually arose from 57Fe hyperfine couplings came from the invariance of line frequencies with 10,% shifts in EPR frequencies and corresponding observing fields, as well as from line splittings with twice the nuclear Zeeman frequency of 57Fe. In contrast, proton spectra, because of their dominant nuclear Zeeman terms, 84 y. I. Shethna, P. W. Wilson, R. E. Hansen, and H. Beinert, Proc. Natl. Acad. Sci. U.S.A. 52, 1263 (1964).
224
PROBES OF METAL ION ENVIRONMENTS
[7]
scaled with external field as microwave frequency was altered. Two distinct sets of 57Fe E N D O R lines, as expected from the two types of iron atoms in the spin-coupled Fe(II)-Fe(III) system, could thus be distinguished. Taking advantage of angle selection effects afforded by the anisotropic EPR spectra made it possible to extract components and the relative orientation of one of the 57Fehyperfine tensors. In all, the study provided a clear example of how detailed information may be extracted from ENDOR spectra. Extension of ENDOR spectroscopy to four-Fe clusters in iron-sulfur proteins was soon accomplished. 85 The high-potential protein from Chromatium showed two types of iron atoms, each with a nearly isotropic hyperfine tensor as expected of the relatively high symmetry in the cubanelike structure of the iron-sulfur cluster. A distinctly lower symmetry was found in the eight-iron protein of Clostridium pasteuranium, possibly because of intercluster spin-spin couplings. An unexpected and interesting finding was that the hyperfine couplings were appreciably smaller than those of the two-Fe protein, suggesting a greater electron delocalization onto the iron ligands. Advantages of ENDOR spectroscopy at Q-band microwave frequencies over that at traditional X-band frequencies were subsequently exploited to characterize hyperfine couplings in the [4Fe-4S] cluster of beef heart mitochondrial aconitase. 86 In addition to the obvious improvement in sensitivity accruing with higher frequency, Q-band spectroscopy offers two further advantages in delineating hyperfine interactions to ligand nuclei. First, confounding proton lines are shifted to higher frequencies, well apart from those of ligands (see above). At X-band frequencies, the proton Zeeman frequency is near 14 MHz, whereas at Q-band it is close to 40 MHz. Most ligand resonances, centered at frequencies largely determined by field-insensitive hyperfine energies, would be expected in a lower frequency range. Studies of solvent-metal interactions, using deuterated water, are facilitated at higher observing fields. Deuteron resonances at X-band typically occur between 0.5 and 3.5 MHz, where detection of E N D O R signals is difficult, but at Q-band extend from 6.5 to 9 MHz, where signals are easily recorded. The studies of aconitase reported by Hoffman and colleagues 86 represent a substantial achievement in the application of ENDOR spectroscopy to the study of active site structure and mechanisms in metalloenzymes. 85 R. E. Anderson, G. Anger, L. Petersson, A. Ehrenberg, R. Cammack, D. O. Hall, R. MuUinger, and K. K. Rao, Biochim. Biophys. Acta 376, 63 (1975). 86 M. M. Werst, M. C. Kennedy, H. Beinert, and B. M. Hoffman, Biochemistry 29, 10526 (1990).
[7]
CONTINUOUSWAVE ENDOR SPECTROSCOPY
225
The species examined included reduced active enzyme, enzyme-substrate complex, enzyme-[170]carboxyl-labeled substrate complex, enzyme-perdeuterated substrate complex, several enzyme-substrate analog and enzyme-inhibitor complexes, and 57Fe- and 33S-substituted iron-sulfur clusters. Angle selection and isotope substitution effects were correlated to extract principal values and relative orientations of hyperfine tensors in the free enzyme and substrate-enzyme complex. Perhaps most interesting, and of greatest relevance to the enzymatic mechanism, was the demonstration of solvent binding (as OH-) to a particular iron atom of the four-Fe cluster and its protonation on binding of a substrate carboxylate ligand to the cluster. Nitrogen ENDOR signals remained virtually unchanged on binding of substrate, substrate analogs, or inhibitors to the enzyme. Enzyme-catalyzed interconversion of citrate and isocitrate therefore does not appear to involve displacement of an endogenous ligand, but rather addition of substrate ligands to the F e 4 - S 4 cluster and a change in the protonation state of bound solvent. A detailed discussion of the catalytic mechanism of aconitase, and the insights gleaned from ENDOR spectroscopy, has been presented. 87
Copper Proteins Copper is among the most tractable metals for ENDOR spectroscopy. The anisotropic EPR spectrum of Cu(II), with its axial g tensor and relatively narrow EPR lines, lends itself well to exploitation of angle selection effects; use of isotopically pure 63Cu and 65Cu (each with a nuclear spin of ~) simplifies interpretation of copper hyperfine splittings; electron relaxation times of Cu(II) are favorable for the saturation demanded by ENDOR spectroscopy; and hyperfine couplings of copper to ligand nuclei are generally in a satisfactory radio frequency range for ENDOR detection. Cu(II) has therefore been widely used as a probe of metal-binding sites in proteins, and enzymes dependent on copper have been favorite subjects for ENDOR experiments. The most important information elicitable from ENDOR spectroscopy of a copper-bearing protein usually pertains to the ligands and solvent accessibility of the bound copper species. Studies with model Cu 2+ complexes demonstrated the potential of ENDOR in revealing superhyperfine splittings not resolved in EPR spectra, 88 in particular those attributable to the remote (nonligated) nitrogen nuclei of imidazole ligands first demonstrated in ESEEM spectroscopy. 89 Investigations of the blue copper pro87 H. Lauble, M. C. Kennedy, H. Beinert, and C. D. Stout, Biochemistry 31, 2735 (1992). 88 H. L. Van Camp, R. H. Sands, and J. A. Fee, J. Chem. Phys. 75, 2098 (1981). 89 W. B. Mims and J. Peisach, Biochemistry 15, 3863 (1976).
226
PROBES OF METAL ION ENVIRONMENTS
[7]
tein stellacyanin expanded work already cited 4 in demonstrating coordination of at least two nitrogen ligands to the active copper, although the amino acid source of the nitrogen could not be ascertained. 9°'9~The occurrence of two nitrogen ENDOR lines in spectra obtained at EPR turning points, originally thought to arise from two equivalent planar nitrogens with tensor orientations perpendicular to each other, was subsequently attributed to two inequivalent nitrogen ligands, each with a nearly isotropic h y p e r f i n e t e n s o r . 92"93 Such isotropy is said to be characteristic of copper coordination by histidyl nitrogen. 92 (It might be noted, in passing, that an anisotropic A tensor may produce a powder ENDOR pattern at a fixed field within the EPR powder pattern if many orientations are represented in this field. 94'95) For the first time, copper hyperfine splittings could be observed in the ENDOR spectrum of a copper protein; anisotropy of the copper hyperfine tensor was ascribed to substantial departures of the copper ligand field from tetragonal symmetry. Cytochrome-c oxidase has been the subject of copper ENDOR studies in a number of laboratories. The cytochrome oxidase molecule, of still uncertain polypeptide structure and molecular mass, 96 bears four distinct metal centers, arranged in two pairs. One pair, where dioxygen is bound and reduced during the catalytic cycle, consists of a binuclear cluster of a heme (heme a3) and a copper ion, CUB, and is inaccessible to EPR-ENDOR spectroscopy. The other pair, heme a and Cu A, participates in the flow of electrons from reduced cytochrome c to the dioxygen-binding binuclear center. Early work demonstrated an indeterminate number of weakly coupled protons with anisotropic hyperfine interactions and at least one nitrogen ligand to the EPR-visible "intrinsic" CUA of the enzyme. 97 Only a single pair of lines attributable to nitrogen could be identified, possibly because the partner pair was lost in the broad lump of matrix proton resonances. Final identification of the nitrogen resonances came
9o M. M. Werst, C. E. Davoust, and B. M. Hoffman, J. Am. Chem. Soc. 113, 1533 (1991). 91 j. E. Roberts, T. G. Brown, B. M. Hoffman, and J. Peisach, J. Am. Chem. Soc. 102, 825 (1980). 92 H. Yokoi, Biochem. Biophys. Res. Commun. 108, 1278 (1982). 93 j. E. Roberts, J. F. Cline, V. Lum, H. Freeman, H. B. Gray, J. Peisach, B. Reinhammar, and B. M. Hoffman, J. Am. Chem. Soc. 106, 5324 (1984). 94 S. P. Greiner and M. Baumgarten, J. Magn. Reson. 83, 630 (1989). 95 G. A. Rottman, K. Doi, O. Zak, R. Aasa, and P. Aisen, J. Am. Chem. Soc. 111, 8613 (1989). 96 S. I. Chan and P. M. Li, Biochemistry 29, 1 (1990). 97 H. L. Van Camp, Y. H. Wei, C. P. Scholes, and T. E. King, Biochim. Biophys. Acta 537, 238 (1978).
[7]
CONTINUOUS WAVEENDOR SPECTROSCOPY
227
from use of enzyme from yeast grown with 15N-substituted histidine98; at least one histidine was demonstrated to be a ligand of CuA. Another study identified copper hyperfine signals, thus establishing the participation of Cu(II), rather than the alternative possibility of a thiyl radical (R-S.) coordinated to Cu(I), in the heme a--CUA site of the enzyme. 99 The small copper hyperfine energies found, 68-90 MHz, were taken to indicate a high degree of covalency of the Cu(II) ion. During enzymatic turnover, the ordinarily invisible CuB generates an EPR signal which can be distinguished from that given by Cu A.~00ENDOR spectroscopy of this copper shows resonances attributed to three nitrogen ligands, of which at least one appears to be from a histidine residue. Studies of proton resonances of cytochrome-c oxidase have also been revealing. Comparative studies of native yeast cytochrome oxidase with enzyme in which deuterium was substituted for protons at the/3 carbon atoms of cysteine made possible assignment of specific lines to/3 protons of cysteine ligated to CUA.J°I On going from fully oxidized (a 3+" CUA2+" a33 +" CUB2+) or two-electron reduced CO-ligated enzyme (a 3+ • CUAz+ • aa2+ • CO" CuB+) to a more completely reduced species, the ENDOR splittings of the/3 protons was substantially reduced, suggesting that the methylene protons sense a reductive event remote from the CuA site. The value of copper as an ENDOR probe of metal-binding sites in proteins was shown in a study of 65Cu-substituted transferrin, l°z the iron transport protein of blood plasma. The transferrin molecule consists of a single polypeptide chain arranged in two lobes, each lobe bearing a metalbinding site that can accommodate a large variety of metal ions in addition to Fe(III). 1°3 Spectra obtained with the protein loaded with two Cu(II) ions were qualitatively identical to the spectrum from the protein selectively labeled at the A site in the C-terminal lobe, thus indicating similarity in the ligand structures of the sites. Nearly isotropic hyperfine splittings from a single nitrogen nucleus were identified and assigned to a ligand imidazole. The small principal values of the coupling tensor, 30.8-31.5 98 T. H. Stevens, C. T. Martin, H. Wang, G. W. Brudvig, C. P. Scholes, and S. I. Chan, J. Biol. Chem. 257, 12106 (1982). 99 B. M. Hoffman, J. E. Roberts, M. Swanson, S. H. Speck, and E. Margoliash, Proc. Natl. Acad. Sci. U.S.A. 77, 1452 (1980). 100j. Cline, B. Reinhammar, P. Jensen, R. Venters, and B. M. Hoffman, J. Biol. Chem. 258, 5124 (1983). 101 C. Fan, J. F. Bank, R. G. Dorr, and C. P. Scholes, J. Biol. Chem. 263, 3588 (1988). J0~ j. E. Roberts, T. G. Brown, B. F. Hoffman, and P. Aisen, Biochim. Biophys. Acta 747, 49 (1983). 103 D. C. Harris and P. Aisen, in "Iron Carriers and Iron Proteins" (T. M. Loehr, ed.), VCH, Weinheim, 1989.
228
PROBES OF METAL ION ENVIRONMENTS
[7]
MHz, were attributed to electron withdrawal by a coordinated tyrosine. A resolved copper hyperfine line, observed at the g± extremum of the EPR line, provided a value for the perpendicular component of the axial copper hyperfine tensor, which could not be obtained from the EPR spectrum itself. The ligand structure of the sites, revealed by X-ray crystallography, TM subsequently corroborated inferences about histidine ligation from ENDOR spectroscopy. Electron Nuclear Double Resonance Studies of Metalloproteins with S > ½ For paramagnetic metal ions with S > ½, the effects of zero-field (finestructure) terms in the spin Hamiltonian must be taken into account in interpreting ENDOR spectra. Two cases should be distinguished, depending on whether the zero-field tensor has near-axial or lower symmetry.
S > ~, Axial Symmetry In the first instance, the analysis of experimental spectra is usually a relatively straightforward extension of the analysis of spectra from systems with S = ½. The hyperfine Hamiltonian can be transformed from the true spin representation to an effective spin representation with S' = -.~105 Perturbation expressions applicable to S = ½ systems must be appropriately modified in the S' = ½representation, so that the ENDOR frequency is specified by I"ENDOR --
g'A g 2
---+ P i
(1 1)
where g' is the effective or apparent g value corresponding to the observing field, g is the free-electron g value which may be taken as 2, and A is the hyperfine coupling energy. As in the case of S = ½systems, the A tensor must be transformed to the appropriate reference frame, usually that in which the g tensor is diagonal. For systems with S > ½the presence of a zero-field splitting presents both difficulty and opportunity in the interpretation of ENDOR spectra. The interaction of energy levels from which resonance transitions are observed to close-lying but otherwise "silent" states can generate a large anisotropic "pseudonuclear Zeeman effect" (PNZE), present in addition to the true nuclear Zeeman interaction. Splittings produced by the pseudo104 C. A. Smith, B. F. A n d e r s o n , H. M. Baker, and E. N. Baker, Biochemistry 31, 4527 (1992). 105 A. E. True, M. J. N e l s o n , R. A. Venters, W. H. O r m e - J o h n s o n , and B. M. H o f f m a n , J. Am. Chem. Soc. 1111, 1935 (1988).
[7]
CONTINUOUS WAVEENDOR SPECTROSCOPY
229
nuclear Zeeman effect can be much larger than the scalar splitting of the nuclear Zeeman interaction. 45 The origin of the pseudonuclear Zeeman effect can be seen in the second-order perturbation expression obtained when the fine structure splitting energies are substantially greater than energies from electronic Zeeman and hyperfine terms. The eigenfunctions of the fine structure term are taken as the zero-order wave functions in the perturbation treatment, with the electronic Zeeman and hyperfine terms combined as a perturbation. Terms in ~2 and [2 then arising make no or little contribution to the ENDOR spectrum and may be ignored. Cross-terms involving the interaction of the electronic Zeeman term with the hyperfine term, however, give rise to the PNZE, which takes the form PNZE = ~ ((0IA(S" hli)(ilglz,(B" s)10) +
(0[g~a" (B. S)[i)(i4A(S • i)10)~ WoC~// }
(12)
Thus, if the zero-field separations of Kramers doublets (W0 - Wi) are sufficiently small, a splitting of ENDOR frequencies results that can be much larger than the splittings caused by the nuclear Zeeman term itself. The equation for the PNZE simplifies to PNZE -- CxB~[~ + CyBy[y + CzBz[ z
(13)
in which the Ci terms represent appropriate constants in an expression that has the form of an anisotropic nuclear Zeeman interaction. Because the denominators in the full expression for the PNZE [Eq. (12)] are the zero-field splittings, it becomes possible to estimate the components of the fine-structure term in the spin Hamiltonian from the observed ENDOR splittings. 95,1°5 This is the opportunity accompanying the PNZE. Information to be gleaned from ENDOR spectroscopy of metalloproteins with S > ½is illustrated in a study of the molybdenum-iron cofactor of Azotobacter vinelandii nitrogenase enriched with 57Fe.105Still uncertain when the study was undertaken, the EPR-active Mo-Fe-S cluster is now known from X-ray crystallography to have the overall composition MoFe7S81°6 with a total spin S = ~ and an EPR signal of near-axial symmetric (h = 0.053). The PNZE made it possible to estimate the zero-field separation between the two Kramers doublets with high precision, a value of 12.2 cm-~ being obtained. 107Because of the spread in ENDOR frequencies I06 j. Kim and D. C. Rees, Science 257, 1677 (1992). 107 R. A. Venters, M. J. Nelson, P. A. McLean, A. E. True, M. A. Levy, B. M. Hoffman, and W. H. Orme-Johnson, J. A m . Chem. Soc. 108, 3487 (1986).
230
PROBES OF METAL ION ENVIRONMENTS
[7]
brought about by the effect described in Eq. (I), it was possible to distinguish and characterize the 57Fe hyperfine tensors in five of the seven iron atoms of the cofactor cluster in a striking example of multisite polycrystalline ENDOR spectroscopy. Each of the resolved Fe sites was found to differ from its partners in hyperfine tensor components and orientation despite the strong electron delocalization within the cluster, indicating a remarkable complexity in electronic configuration yet to be related to functional activity. The possibility that the unseen iron atoms have hyperfine parameters identical to those of the observed iron atoms must now be considered in view of the seven-Fe structure of the Mo-Fe cofactors, but other possibilities are not excluded.
S > ~, Orthorhombic Symmetry In the second instance, when the fine structure tensor of the spin Hamiltonian has lower than axial symmetry, the simple eigenfunctions of Sz are no longer eigenfunctions of the full spin Hamiltonian. It is therefore necessary to diagonalize the matrix of the fine structure tensor in order to obtain the correct zero-order wave functions for perturbation calculations. (The shortcomings of the g tensor approach in the analysis of EPR spectra has long been appreciated.~°8) In one protein studied, transferrin, iron is bound to each of the two similar but not identical sites of the protein as high-spin (S = ~) Fe(III). The features of the EPR spectrum of each site are best described with a spin Hamiltonian dominated by the fine-structure term. Because the fine-structure tensor is almost completely rhombic (E/DI ~ 0.3 15), the EPR spectrum shows a prominent and nearly isotropic feature at g' = 4.3, arising from the virtually isotropic middle Kramers doublet of the S = ~ sextet. All orientations of the paramagnetic Fe(III) centers contribute to the g' = 4.3 EPR signal, and therefore to the ENDOR spectrum. Energies of the uppermost and lowermost Kramers doublets are orientation-dependent, however, so that the PNZE leads to an anisotropic powder-type ENDOR spectrum from the g' = 4.3 EPR line, even though that line is almost isotropic. Numerical diagonalization over all orientations of the matrix of the full spin Hamiltonian is then required for calculation of ENDOR frequencies. Zero-field splittings can then be obtained from the parameters of the spin Hamiltonian that give the best match of calculated to observed frequencies. A slight difference in D, distinguishing the two sites of transferrin, was thereby detected in the 57Fe ENDOR spectra of the protein selectively occupied at each site. Differences between the 57Fe ENDOR spectra of the two sites of transferrin were much ~06W. E. Blumberg, in "Magnetic Resonance in Biological Systems" (A. Ehrenberg, B. G. Malmstr6m, and T. V~inng~rd, eds.), p. 119. Pergamon, Oxford, 1967.
[7]
CONTINUOUS WAVEENDOR SPECTROSCOPY
231
more striking than differences between EPR spectra, but a further analysis of the ENDOR differences was not undertaken. Concluding Comments The rapidly accelerating progress in the biological applications of ENDOR spectroscopy seen since the 1970s reflects a combination of instrumental and conceptual advances. Structural information, and its functional implications, has been wrested from ENDOR studies of almost all magnetic nuclei coupled to the paramagnetic centers encountered in biological molecules. ENDOR spectroscopy, with the detailed insight it offers into the local structure of a paramagnetic centers in solution and the alterations of such structure during biological function, can often complement the tremendous power of X-ray crystallography in studies of metalloproteins. Interpretation of ENDOR spectra merges intuition with analytic rigor, with the limitations of the one often surmounted by the power of the other. Sensitivity problems persist but are yielding to studies at ever higher frequencies. Fruitful exploitation of Triple resonance in studying metalloproteins has yet to be accomplished. The wide availability of the personal computer, with its dramatically increasing speed and power, has enormously facilitated processing and interpretation of spectroscopic data. A persistent difficulty is to achieve understanding of the relaxation processes and pathways governing ENDOR spectroscopy; such understanding has yet to attain the peaks achieved by other, perhaps simpler, spectoscopies. In the end, the ingenuity and resourcefulness of experimenters remain the most powerful tools in the armamentarium of ENDOR spectroscopy. Acknowledgments Preparation of this chapter was supported in part by Grants GM-40168 and RR-02583 (J. Peisach), and DK-15056(P. Aisen)from the NationalInstitutes of Health, U.S. Public Health Service.
232
PROBES OF METAL
ION ENVIRONMENTS
[8]
[8] V a n a d y l ( I V ) E l e c t r o n N u c l e a r D o u b l e Resonance/Electron Spin Echo Envelope Modulation Spin Probes B y N. DENNIS CHASTEEN
Introduction The oxycation vanadyl(IV), VO 2+, has been historically used as an electron paramagnetic resonance (EPR) spin probe of metal binding sites in proteins. 1 More recently, VO 2+ has been employed as an E N D O R (electron nuclear double resonance) and E S E E M (electron spin echo envelope modulation) spin probe. These higher resolution resonance techniques provide more detailed information about the metal binding site than is possible with E P R spectroscopy alone. In particular, magnetic nuclei with couplings less than the natural width of 5-15 G of the EPR line can be identified and studied by E N D O R or E S E E M . In favorable cases, one can obtain information about the geometrical arrangement of magnetic nuclei in the vicinity of the electron spin as well. In this chapter we briefly review some of the salient features of the E P R spectra of vanadyl(IV)-protein complexes and then give a synopsis of some recent E N D O R and E S E E M work. The principles o f E P R , E N D O R , and E S E E M spectroscopies are discussed elsewhere in this volume and are not reiterated here. Some aspects of E N D O R and E S E E M spectroscopy of v a n a d y l - p r o t e i n complexes and small chelates have been recently reviewed. 2
Electron Paramagnetic Resonance Spectroscopy VO 1÷ is an S = ½paramagnet with a 3d 1 outer electron configuration. When complexed, VO 2÷ has an orbitally nondegenerate ground state with no excited states nearby in energy. These are the requirements for observing electron resonance at room temperature with solution samples as well as at low temperatures with samples in the frozen state, a situation c o m m o n l y encountered with biological EPR studies. i N. D. Chasteen, in "Biological Magnetic Resonance" (L. Berliner and J. Reuben, eds.), Vol. 3, p. 53. Plenum, New York, 1981; N. D. Chasteen, Struct. Bonding (Berlin) 53, 107 (1983). z S. S. Eaton and G. R. Eaton, in "Vanadium in Biological Systems" ~N. D. Chasteen, ed.), p. 199. Kluwer Academic Publ., Dordrecht, The Netherlands, 1990. METHODS IN ENZYMOLOGY, VOL. 227
Copyright © 1993 by Academic Press, Inc. All rights of reproduction in any form reserved.
[8]
VANADYL(IV) E N D O R / E S E E M SPIN PROBES
233
Parallel Lines -1/2
+100"
I
,
""'A'
I
r-I
1/
t-i E
0
//a
IT I1. LIJ
i/2 ~"+ 3/2 ,~
5•3, 2
Perpandicul
-100
I
s
i
2320
i
3320
Field
I
4320
{Gauss)
FIG. 1. F r o z e n solution spectrum (77 K) of VO 2-- complexed with apoferritin. Parallel and perpendicular hypertine lines are indicated. Two forms of VO 2+ binding, a and fl, are apparent.
The large moment of the 99.75% abundant I = ½ 51V nucleus causes EPR spectra of frozen solutions to be composed of overlapping patterns of eight lines. Such a spectrum is shown in Fig. 1 for the VO 2+ ion complexed with apoferritin, the iron storage protein. 3 To a good approximation, VO 2+ EPR spectra can be analyzed using the following spin Hamiltonian: '~ : fl(gxxHxSx + gyyHySy + gzzHzSz) - g.fln(H,:ix + nyiy + H J z ) + AVxx,~:,iv+ A vyySyI ^ ~vy Jr mVzzSziV z "~ ~ S . A L. i L
(1)
L
The g factor terms represent the electron Zeeman interaction, and the terms in AVx,:, AVyy, and AV~x denote the vanadium nuclear hyperfine interaction. The sum term includes all ligand nuclear superhyperfine interactions. Here x, y, and z represent the coordinate system for the g matrix, which is assumed to be coincident with that of the vanadium nuclear 3 N. D. Chasteen and E. C. Theil, J. Biol. Chem. 257, 7672 (1982).
234
PROBES OF METAL ION ENVIRONMENTS
[8]
hyperfine matrix. The coordinate systems for the nuclear superhyperfine interactions of the various ligands, Y~S • A L • i L, are not generally coincident with the g matrix coordinate system. VO 2÷ complexes typically show axial or pseudoaxial EPR spectra such that gzz = gll, gxx = gyy -- g±, AVzz = AVlland AVx~ = AVyy -- AV±. Thus, to a first approximation, the frozen solution EPR spectrum is a superposition of two sets of eight hyperfine lines with vanadium nuclear hyperfine couplings AVlland AV± (Fig. 1). The parallel and perpendicular lines in Fig. 1 arise from those molecules in the polycrystalline sample having their VO bond axis parallel or perpendicular to the direction of the applied magnetic field. The labeling of the hyperfine lines in Fig. I according to the m I values of the 51V nucleus assumes a negative coupling constant. Values for AvH range from (-)138 × 10 - 4 to (-)183 × 10 - 4 cm -1 (150 to 203 G) and AV± from (-)47 × 10 - 4 t o (-)71 × 10-4 cm -1 (51 to 77 G) in going from strong to weak ligand fields. 4 Similarly gll changes from 1.972 to 1.932 and g± from 1.985 to 1.972.1'4 The spin Hamiltonian parameters gll, g±, AVll, and AV± reflect the ligand environment of the metal. Multiple binding sites are often evident in EPR spectra of VO2+-protein complexes. In the case of VO2+-apoferritin, two forms of VO 2+ binding, labeled a and/3, are evident in the EPR spectrum of Fig. 1 and are attributed to two states of hydrolysis of the metal (see below). The identity of the coordinating ligands can be inferred from the values of the spin Hamiltonian parameters using additivity relationships1; however, a better approach is to observe ligand nuclei directly using E N D O R or ESEEM spectroscopy. Ligand nuclear superhyperfine couplings are not often observed in VO 2+ EPR spectra owing to the fact that the unpaired electron resides in a molecular orbital that is largely dxy in character and nonbonding, the x and y axes being approximately along the equatorial ligand-metal bonds. Ligand superhyperfine couplings typically less than the peak-to-peak EPR line widths, while not observable by EPR, can be measured by ENDOR and ESEEM. They generally fall in the range 2 MHz (e.g., 13C)to 16 MHz (e.g., 1H).5-7 Table I summarizes the proteins studied to date by EPR, ENDOR, or ESEEM spectroscopy and the nuclear spin couplings observed. 4 N. D. C h a s t e e n , R. J. D e K o c h , B. L. Rogers, and M. W. H a n n a , J. Am. Chem. Soc. 95, 1301 (1973). 5 p. A. Tipton, J. M c C r a c k e n , J. B. Cornelius, and J. Peisach, Biochemistry 28, 5720 (1989). 6 D. Mustafi and M. W. Makinen, Inorg. Chem. 27, 3360 (1988). 7 D. Mustafi, J. Telser, and M. W. Makinen, J. Am. Chem. Soc. 114, 6219 (1992); D. Attanasio, J. Phys. Chem. 90, 4952 (1986).
TABLE I PROTEINS STUDIED BY VO 2+ ELECTRON SPIN PROBES Protein
Resonance method(s)
Nuclei observed
Bromoperoxidase Calmodulin Carbonate dehydratase Carboxypeptidase A Collagen Ferritin Insulin Lactoferrin Ovotransferrin Pyruvate kinase
EPR~/ESEEM b EPR C EPR d EPR e EPR f EPRg/ENDORh/ESEEM i EPRJ EPRk/ESEEM l EPRm,n EPR°/ESEEM p
ATP : L-methionine s-adenosyltransferase Serum albumin Testicular S-100-1ike protein Transferrin Xylose isomerase
EPR q:
IH, 2H, 14N, 5Iv 51V 51V 5IV 51V IH, 2H, 14N, 51V 51V 1H, 2H, I3C, 14N, 5Iv 51V 13C, 14N, 170, 23Na, 51V, 31p, 133Cs 170, 31p, 51V, 203,205T1
EPR s't EPR" EPR"/ENDORh/ESEEM ~ EPR°/ENDOR °
5IV 5~V IH, 2H, 13C, 14N, 5iV IH, 14N, 51V
a E. de Boer, K. Boon, and R. Wever, Biochemistry 27, 1629 (1988). E. de Boer, C. P. Keijzers, A. A. K. Klaassen, E. J. Reijerse, D. Collison, C. D. Garner, and R. Wever, FEBS Lett. 235, 93 (1988). c R. H. Ahmed, J. Nieves, L. Kim, L. Echegoyen, and D. Puett, J. Protein Chem. 6, 431 (1987). d j. j. Fitzgerald and N. D. Chasteen, Biochemistry 13, 4338 (1974). e R. J. DeKoch, D. J. West, J. C. Cannon, and N. D. Chasteen, Biochemistry 13, 4347 (1974). f R. P. Ferrari, lnorg. Chim. Acta 176, 83 (1990). g N. D. Chasteen and E. C. Theil, J. Biol. Chem. 257, 7672 (1982). h p. M. Hanna, N. D. Chasteen, G. A. Rottman, and P. Aisen, Biochemistry 30, 9210 (1991). i G. J. Geffen, P. M. Hanna, N. D. Chasteen, and D. J. Singel, J. Am. Chem. Soc. 113, 9513 (1991). J N. D. Chasteen, R. J. DeKoch, B. L. Rogers, and M. W. Hanna, J. Am. Chem. Soc. 95, 1301 (1973). k A. Carmichael and J. S. Vincent, FEBS Lett. 105, 349 (1979). t S. S. Eaton, J. Dubach, K. M. More, G. R. Eaton, G. Thurman, and D. R. Ambruso, J. Biol. Chem. 264, 4776 (1989). m D. Casey and N. D. Chasteen, J. Inorg. Biochem. 13, l l l (1980). n D. Casey and N. D. Chasteen, J. lnorg. Biochem. 13, 127 (1980). o K. A. Lord and G. H. Reed, Arch. Biochem. Biophys. 281, 124 (1990). P P. A. Tipton, J. McCracken, J. B. Cornelius, and J. Peisach, Biochemistry 28, 5720 (1989). q G. D. Markham, Biochemistry 2,3, 470 (1984). r G. D. Markham and T. S. Leyh, J. Am. Chem. Soc. 109~ 600 (1987). s N. D. Chasteen and J. F. Francavilla, J. Phys. Chem. 80, 897 (1976). t N. D. Chasteen, J. K. Grady, and C. E. Holloway, Inorg. Chem. 25, 2754 (1986). u j. C. Cannon and N. D. Chasteen, Biochemistry 14, 4573 (1975). v R. Bogumil, J. Hiittermann, R. Kappl, R. Stabler, C. Sudfeldt, and H. Witzel, Eur. J. Biochem. 196, 305 (1991).
236
PROBES OF METAL ION ENVIRONMENTS
[8]
Electron Nuclear Double Resonance Spectroscopy VO 2÷ complexes have been investigated by ENDOR since the early 1980s. Some of the earliest and most definitive work was carried out by van Willigen and co-workers on model vanadyl complexes, s-ll One advantage of using VO 2÷ as an ENDOR spin probe is that its electron spin energy levels are relatively easy to saturate. Measurements can be carried out at I00 K with microwave powers of the order of 20 mW and radio frequency powers of 70-200 W. 6-11 However, stronger ENDOR signals are obtained around 5 K, the temperature where most protein work has been carried out. Concentrations of VO2+-protein complexes generally employed fall in the range 1-2 mM in order to minimize the amount of signal averaging required. A second advantage of VO 2÷ ENDOR spectroscopy is that the anisotropic EPR spectrum affords the opportunity of doing angle-selective ENDOR spectroscopy. The same is also true for VO z÷ ESEEM measurements. By placing the static magnetic field at "parallel" or "perpendicular" features of the EPR spectrum, one is able to make ENDOR measurements on a subset of molecules in the sample having their VO bond axes (the axis of gzz and Azz) approximately parallel or perpendicular to the direction of the applied magnetic field. Spectra gathered at the extreme ends of the spectrum, namely, at the ml = -½[[ and +½[[ lines (Fig. 1), represent true "single-crystal spectra" with the field along the VO bond axis of the complex. Spectra gathered at other parallel features, namely, at the m I = -----½[[, ±za[[, and ±~[[ lines, also have contributions from intermediate field orientations from neighboring hyperfine components; therefore, these spectra do not correspond to " p u r e " single-crystal spectra. Nevertheless, resonances from the subpopulation of parallel molecules corresponding to the m I = ± 11 field positions generally dominate the ENDOR spectrum. The ml = - 11 line rather than the mi = -Ill line is often used in ENDOR measurements because of its greater intensity (Fig. 1). In the case of perpendicular spectra, the m I = + ½ / and mi = +~J_ lines have fewer contributions from neighboring hyperfine components, but other lines have been used as well. Perpendicular lines, in addition to having contributions from intermediate orientations from neighboring hyperfine manifolds, contain signals from a range of in-plane orientations, 8 C. 9 B. 1o C. 11 H.
F. Mulks, B. Kirste, and H. van Willigen, J. Am. Chem. Soc. 104, 5906 (1982). Kirste and H. v a n Willigen, J. Phys. Chem. 86, 2743 (1982). F. M u l k s a n d H. v a n Willigen, J. Phys. Chem. 85, 1220 (1981). v a n Willigen, J. Magn. Reson. 39, 37 (1980).
[8]
VANADYL(IV) E N D O R / E S E E M SPIN PROBES
237
a fact that can complicate the analysis of the ENDOR spectrum, particularly in the case of 14N ENDOR (see below). The most intense feature in the EPR spectrum is due to near coincidence of parallel and perpendicular lines (Fig. 1). This feature corresponds to either the m I = +½ o r --½ hyperfine component, depending on the EPR spin Hamiltonian parameters of the complex. ENDOR measurements at this position have contributions from all orientations; however, the ENDOR spectrum in these cases is dominated by perpendicular features since there is statistically a higher population of perpendicularly oriented molecules in the sample. ENDOR spectra of VO2+-protein complexes have been limited to studies of ~H and 14N couplings, although 3Jp couplings have been observed in nucleotide complexes. 7 In the case of ~H ENDOR, the nuclear Zeeman energy at magnetic fields of X-band EPR is usually greater than the hyperfine coupling. In this case the ENDOR lines are given to a first order by VENDO R = I V . ±
Aii/21
(2)
where i equals x, y, and z. Equation (2) predicts a pair of proton ENDOR lines in the ENDOR spectrum centered about the free proton precessional frequency VH and separated by the hyperfine coupling constant Aii. Figure 2 shows the ENDOR spectra of VO2+-substituted D-xylose isomerase, an Mg 2+ enzyme that catalyzes the reversible isomerization of a-D-xylose to o~-Dxylulose/2 The ENDOR spectrum obtained with the magnetic field set on the m I = - 11 line is illustrated in Fig. 2a. Here differences from the free precessional frequency are plotted, and, therefore, VH corresponds to 0 MHz in Fig. 2a. Two pairs of IH lines with couplings under 1.5 MHz are apparent. In addition, there is a larger 3.5 MHz coupling labeled AA' (Fig. 2a). In Fig. 2b the ENDOR spectrum gathered at the ml = -~l[ EPR line is shown. The feature corresponding to AA' in the ml = - 11 spectrum is also observed in the ml = -~ll spectrum but is flanked by two other lines, presumably from orientations arising from the overlapping m~ = -½ hyperfine manifold. The presence of these additional lines as well as the asymmetry in intensity distribution in the two halves of the spectrum, the high frequency side of the spectrum being less prominent, suggest that the AA' coupling arises from a proton neither on the axis of the VO bond
12R. Bogumil, J. Hfittermann, R, Kappl, R. Stabler, C. Sudfeldt, and H. Witzel, Eur. J. Biochem. 196, 305 (1991).
238
PROBES OF METAL ION ENVIRONMENTS
°
Jk I/
--A -3
[8]
mr-"21.
//--A
-2 -1 0 .1 *2 Frequency (MHz]
I *3
-c -3
I/-'°2°'c,
-2 -1 0 *1 *2 Frequency (MHz)
+3
FIG. 2. IH E N D O R spectra o f four-VO2+-substituted D-xylose i s o m e r a s e (B site) in frozen solution at a b o u t 5 K. (a) Magnetic field set on the mi = -½11E P R line; (b) rn I = -~11 E P R line; (c) ml = - ~ ± E P R line; (d) m I = +½ll, ± E P R line; (e) m~ = +½11,± E P R line in D20. ( F r o m Bogumil et al. 12)
or perpendicular to it. ~2The range of couplings observed is designated by the A and A' bands in Fig. 2b. The identity of the proton is unknown, but presumably the signal is due to a proton residing on the protein. If the maximum observed coupling of 4 MHz corresponds to Arl of the proton and is attributed solely to an electron-proton magnetic point dipole interaction, then a vanadiumproton distance of approximately 3.4 A is estimated, a value expected for a proton located in the second coordination sphere. A rigorous analysis of the proton E N D O R of protein complexes is usually not possible because sufficient information on the origin of the resonances is not normally available. Protein samples with selectively deuterated amino acids are needed to assist in the analysis. In principle one can obtain detailed structural information from proton ENDOR coupling constants provided that the principal values of the superhyperfine coupling tensor are known in magnitude and sign. An analysis
[8]
VANADYL(IV) E N D O R / E S E E M
SPIN PROBES
239
of the rich IH ENDOR spectrum of the V O 2+ ion in methanol solution has been carried out within the point dipole framework to elucidate the structure of the vanadyl-methanol complex. 6 This method has also been used in structural studies of vanadyl-nucleotide and vanadyl-Schiff base complexes: ENDOR spectra of the VO2+-substituted D-xylose isomerase complex obtained at the m I = - ~ ± and +½_1_field positions are shown in Fig. 2c-e. Comparison of the m I = + 1 1 spectra in HzO and D20 (Fig. 2d,e) show an exchangeable proton denoted BB' with a coupling of 1.7 MHz assigned to the N H proton of imidazole of histidine. 12This value is higher than the value of approximately 1 MHz reported for the VO(imidazole)42+ complex 8 and for histidine coordination in VOZ+-apoferritin.13 The larger coupling with D-xylose isomerase is in keeping with the larger 14N coupling observed with this protein (see below). In the case of 14N ENDOR, the nuclear Zeeman energy at magnetic fields of X-band EPR is generally smaller than the hyperfine coupling. In this case the ENDOR lines are given to a first order by I"ENDOR :
IAii/2 +- VN +- ~Qiil
(3)
where i equals x, y, and z. Four lines centered about Aii/2 are predicted. Figure 3 shows the 14N region of the ENDOR spectra of voE+-D-xylose isomerase measured at the m I = +½_l_ and m I = -~H EPR lines. Figure 3b shows a tentative assignment of the parallel spectrum from which values of the hyperfine coupling Azz = 13.2 MHz and quadrupole coupling Qzz = 0.72 MHz are obtained using Eq. (3). The z axis in this instance refers to the principal axis of the g matrix. The 2vN separation between the two doublets aids in assignment of the spectrum (Fig. 3b). The values of Azz and Qzz for xylose isomerase and other vanadyl protein and small chelate complexes are summarized in Table II. The large value of Azz = 13.2 MHz for xylose isomerase relative to those of the other complexes has been attributed to imidazole coordination in a nonequatorial fashion. 12 The presence of at least two inequivalent 14N nuclei is evident in the ENDOR spectra of VO 2+ complexes with apoferritin, 13imidazole, and carnosine s and are assigned to the coordinating N-1 and remote N-3 nitrogens of the imidazole ring. The presence of a second 14N is not evident in the spectrum of xylose isomerase (Fig. 3b). Assignment of the perpendicular spectrum (Fig. 3a) is not straightforward. The analysis is complicated by the broad lines encountered in 14N ENDOR studies of proteins in comparison to those of small chelates, perhaps reflecting significant "A strain" from local disorder in the metal 13 p. M. Hanna, N. D. Chasteen, G. A. Rottman, and P. Aisen, Biochemistry 30, 9210 (1991).
240
PROBES OF METAL ION ENVIRONMENTS
[8]
l a
m z = +1/2
perpendicular
m r = -5/2 parallel L
~
I
2
3
4
5 6 7 Frequency (MHz)
8
T
9
10
FIG. 3. 14N ENDOR spectra of four-VO2÷-substituted D-xylose isomerase (B site) in frozen solution at about 5 K. (a) Magnetic field set on the mI = +½11,1EPR line; (b) m[ = -~I[ EPR line. The four-line pattern from a single 14Ncoupling is indicated. (From Bogumil et al) 2)
site of the frozen sample.13 Also, the marked variation in intensity of the E N D O R lines makes weak lines next to strong ones difficult to discern.13 The perpendicular spectrum is further complicated by the possibility of up to eight resonances, four from each of the x and y components described by Eq. (3). Difficulties in assigning perpendicular 14N E N D O R spectra are also e n c o u n t e r e d with small chelates. 9 Given the present level of sophistication of analysis, the principal value of 14N E N D O R lies in simply identifying nitrogen coordination in protein complexes. E N D O R measurements at more than one microwave frequency (e.g., X-band and Q-band), 14 should aid considerably in more rigorous assignment of E N D O R spectra in the future. Electron Spin Echo Envelope Modulation Spectroscopy A n u m b e r of properties of VO 2+ make it well suited for E S E E M measurements. The ability to obtain orientation information by selectively 14 M. M. W e r s t , C. E. D a v o u s t , and B. M. H o f f m a n , J. A m . Chem. Soc. 113, 1533 (1991).
[8]
VANADYL(IV) E N D O R / E S E E M
SPIN PROBES
241
TABLE II 14N ELECTRON NUCLEAR DOUBLE RESONANCE PARAMETERS FOR H o PARALLEL TO V ~ O BOND Ligand ApoferritinC D-Xylose isomerase d I midazole e Histidine e Carnosinee Pyridine f Ammonia f
Nitrogen a
Azz (MHz)
Qzz (MHz) b
N- 1 N-3 N N- 1 * N-3 N-3* N- 1" N-3 N* N*
7.14 6.36 13.2
0.24 0.85 0.72 0.23 0.80 0.76 0.24 0.79 0.85 0.51
7.40
6.64 6.00 7.10 6.67 6.50 5.63
N-1 and N-3 refer to the sp 3 and sp 2 nitrogens, respectively, of the imidazole ring, and the asterisk denotes the coordinating nitrogen. b Qzz is the quadrupole coupling where z is taken as the V ~ O bond direction and does not necessarily correspond the principal z axis of the quadrupole coupling tensor, which usually lies along the V - N bond direction [see C. I. H. Ashby, C. P. Cheng, and T. L. Brown, J. A m . Chem. Soe. 100, 6057 (1978)]. From P. M. Hanna, N. D. Chasteen, G. A. Rottman, and P. Aisen, Biochemistry 30, 9210 (1991). From R. Bogumil, J. Hiittermann, R. Kappl, R. Stabler, C. Sudfeldt, and H. Witzel, Eur. J. Biochem. 196, 305 (1991). e From C. F. Mulks, B. Kirste, and H. van Willigen, J. A m . Chem. Soc. 104, 5906 (1982). f B. Kirste and H. van Willigen, J. Phys. Chem. 86, 2743 (1982).
pulsing with the static field set on parallel and perpendicular features in the continuous wave (CW) spectrum has already been mentioned within the context of ENDOR measurements. Because the ground state is largely nonbonding in nature, 14N couplings from directly bonded nitrogen can be observed, 5'~5unlike the situation with Cu E+ where the remote uncoordinated nitrogen of imidazole is seen in the ESEEM.~6 The depth of modulation is greatest when the hyperfine coupling is comparable to the nuclear Zeeman energy, ~v a situation which is observed with VO 2+. Generally good modulation depths are obtained with a variety of nuclei. 5 Moreover, 15 G. J. Gerfen, P. M. Hanna, N. D. Chasteen, and D. J. Singel, J. A m . Chem. Soc. 113, 9513 (1991). 16 W. B. Mims and J. Peisach, in "Advanced EPR: Applications in Biology and Biochemistry" (A. J. Hoff, ed.), p. I. Elsevier, Amsterdam, 1989, and references therein. 17 W. B. Mims and J. Peisach, in "Biological Magnetic Resonance" (L. Berliner and J. Reuben, eds.), Vol. 3, p. 213. Plenum, New York, 1981, and references therein.
242
PROBES OF METAL ION ENVIRONMENTS
[8]
the spectra of this relatively simple S = ½system are usually quite amenable to analysis, but measurements at more than one microwave frequency are needed to avoid erroneous assignments. 5,15 Optimum concentrations for ESEEM measurements are in the 1-2 mM VO 2+ concentration range as for ENDOR. Both two- and three-pulse spin echoes are generally collected depending on the magnitude of the couplings and the modulation decay times of the observed nuclei. As a brief illustration, Fig. 4 shows the two-pulse ESEEM pattern and the corresponding frequency spectrum for VO 2+ complexed to apoferritin. ~5 An expanded portion of the low-frequency region is shown in Fig. 5. The collection of peaks below 10 MHz are assigned to laN. By a combination of frequency tracking, where the ESEEM measurement is made at more than one microwave frequency, and field sampling within the EPR spectrum, the ESEEM frequency spectrum can be assigned in some detail. For example, the broad weak feature near 11.5 MHz and above is assigned to the sum combination of the fundamental doublequantum frequencies of the upper and lower I = 1 manifolds of the Ms = ---½spin states. The peak at approximately 9 MHz is assigned to the higher frequency partner double-quantum transition and the negativephase peak at 6.7 MHz to the sum combination of the single-quantum
0.0
1.0
2.0
3.0
4.0
30.0
40.0
~sec
0.0
10.0
20.0 MHz
FIG. 4. Two-pulse E S E E M pattern (top) a n d corresponding f r e q u e n c y s p e c t r u m (bottom) o f VO2*-apoferritin ct c o m p l e x at 4.2 K with the field set on the m 1 = +½11line. (From Gerfen et al. 15)
[8]
VANADYL(IV) E N D O R / E S E E M i
SPIN PROBES
243
w
t"03
05
0.0
I
I
I
I
I
2.5
5.0
7.5
10.0
12.5
MHz 14
FIG. 5. Expanded view of the N region of the ESEEM spectrum of the VO 2+ -apoferritin a complex shown in Fig. 4. (From Gerfen et al. tS)
fundamentals. The feature at approximately 5 MHz comprises a number of overlapping peaks, namely, the lower frequency partner of the doublequantum transition, the double-quantum difference combination, and the higher frequency single-quantum fundamental. The lower frequency partner single-quantum transition appears at around 2 MHz. These assignments correspond to an 14N hyperfine coupling of around 6.7 MHz, a value typical of coordinated histidine cis to the vanadyl oxo group 8'~3,~5 and comparable to the value of approximately 7 MHz obtained from ENDOR studies of VO2+-apoferritin. 13 The ESEEM spectrum in Fig. 3 is very similar to that observed for vanadyl-transferrin, where histidine is a ligand. 18 The 14N quadrupole coupling constant Qzz is too small to be readily extracted from these spectra but has been obtained from ENDOR spectra. Normally ~H couplings are not observed in ESEEM spectra, and only a peak from "matrix" protons is observed at the Larmor frequency (16.3 MHz in Fig. 4). However, the feasibility of using the negative-phase dipolar-shifted 1H sum combination peak near 33 MHz in Fig. 4 for probing first-coordination sphere water protons has been demonstrated.15 In this study, it was shown that the differences between the a and/3 forms of VO z÷ bound to apoferritin (Fig. 1) is due to deprotonation of a first coordination sphere water molecule. ~5Analysis of the shifted 1H sum combina~s S. S. Eaton, J. Dubach, K. M. More, G. R. Eaton, G. ThurnSan, and D. R. Ambruso, J. Biol. Chem. 2,64, 4776 (1989).
244
PROBES OF METAL ION ENVIRONMENTS
[9]
tion peak should find application in the study of other S = ½ systems as well. The sum combination peaks of the aqua-VO 2+ complex has been analyzed in detail and should serve as a model for future work with proteins. 19 In general, assignment of ESEEM spectra of vanadyl complexes proceeds along similar lines as for other S = ½metal ions. The reader should consult the papers listed in Table I for additional examples of ENDOR and ESEEM assignments and references to the original literature. The ESEEM study of the vanadyl-pyruvate kinase complex shows examples of ESEEM spectra with couplings from a diversity of nuclei (Table I); the spectra of this protein complex are particularly rich in information. 5 i9 A. M. Tyryshkin, S. A. Dikanov, R. G. Evelo, and A. J. Hoff, J. Chem. Phys. 97, 42 (1992).
[9] M u l t i d i m e n s i o n a l N u c l e a r M a g n e t i c R e s o n a n c e M e t h o d s to P r o b e M e t a l E n v i r o n m e n t s in P r o t e i n s By G E R A R D W . C A N T E R S , CORNELIS W . H1LBERS, M A R T VAN DE K A M P , a n d SYBREN S. W I J M E N G A
1. Introduction This chapter deals with methods to obtain information about metal sites in proteins by means of nuclear magnetic resonance (NMR) techniques. NMR spectroscopy has developed into a powerful method to study structures both of metal environments in proteins and of proteins in general. Because its application in chemistry and biochemistry has been dealt with already in detail elsewhere, we refrain from introducing the basic principles of NMR; for the interested reader a number of excellent textbooks and up-to-date review articles are available (see Section 2). When considering metal sites in proteins, attention is given not only to metals that are naturally found in metal binding sites. It can be illuminating to replace the naturally occurring metal by another metal with better NMR properties. For example, calcium (Ca)- and zinc (Zn)-binding proteins can be advantageously studied by replacing the metal with cadmium (Cd). However, one should be prepared for possible deformations the replacement may cause at the metal site. Further, study of metals that do not naturally have a physiological function may be of interest, for instance, when these metals have therapeutic value, like platinum (Pt) in the wellknown Pt antitumor drugs. We also note that nuclei for which no physiologMETHODS IN ENZYMOLOGY,VOL. 227
Copyright © 1993by AcademicPress, Inc. All rights of reproductionin any form reserved.
[9]
MULTIDIMENSIONAL N M R OF METAL SITES IN PROTEINS
245
ical role is known may occur in proteins like the metallothioneins, which sequester hazardous metals such as mercury (Hg), Cd, or silver (Ag). The study of the polypeptide environment of these metals can also be of interest. Time and again the merits and drawbacks of the NMR technique for the study of structure and function of proteins have been contrasted with those of the X-ray diffraction technique. Suffice it to say that for detailed structural studies, NMR spectroscopy, in contrast to the latter method, is limited to proteins with a molecular weight of approximately less than 20,000, although advances in the technique [three- (3D) and four-dimensional (4D) NMR, isotope labeling] may shift the limit of its applicability up to molecular weights of 30,000 or higher. However, when considering only the metal and its immediate surroundings, this limitation is much less restrictive. Metal sites in proteins with molecular weights much higher than 30,000 have been studied to good effect by NMR spectroscopy. Moreover, the NMR method is well suited to study conformational equilibria and time-dependent processes. Finally, chemical shifts may provide information about electronic distributions, and thus reactivity, in the active sites of metalloproteins. In this chapter the following topics are dealt with. Section 2 contains an introduction to general NMR methodology used for protein structure determination. Section 3 is dedicated to the structure of metal environments in proteins. It starts with the use of pH variations to identify metal ligands. Subsequently, techniques to probe the environment of a metal inside a protein are discussed first for paramagnetic, then for diamagnetic metal ions. The last part of Section 3 is devoted to the study of extrinsic ligands. Section 4 deals with time-dependent phenomena, namely, conformational equilibria, N H exchange rates, and NMR relaxation times. Section 5 focuses on probing the oxidation state of a metal site and changes thereof. Section 6, finally, deals with the topic of modeling metal sites in proteins. 2. Nuclear Magnetic Resonance and Protein Structure Nowadays one- (1D), two- (2D), and three-dimensional (3D) NMR spectroscopy techniques are indispensable tools in the study of structure and function of biomacromolecules. The popularity of multidimensional NMR spectroscopy started by the end of the 1970s with the development of 2D NMR techniques, followed by the advent of 3D NMR spectroscopy and even 4D NMR spectroscopy in the late 1980s. Although the pulse schemes and multidimensional NMR spectra have become quite complex and involved, the determination of a protein structure by NMR spectros-
246
PROBES OF METAL ION ENVIRONMENTS
[9]
copy is still based on only two main types of information, namely, J coupling constants and nuclear Overhauser enhancement (NOE) intensities. When a paramagnetic metal is present, additional structure information can be obtained from resonance line widths and chemical shifts (see below). The J coupling between two nuclei provides information about their through-bond connectivity. In particular vicinal coupling constants, 3j, are of interest as they may yield torsion angles via the well-known Karplus equations.l'2 NOEs provide for distance information. 3 The NOE denotes the phenomenon that the intensity of the NMR signal of a nucleus is affected when the magnetization of a nearby nucleus is perturbed, for example, by selective irradiation. This intensity change is due to transfer of magnetization from the irradiated nucleus to the nucleus under observation. The magnetization transfer does not take place through covalent bonds, but rather directly through space, and is mediated by the nuclear dipole-dipole coupling; its effectiveness falls off with the sixth power of the distance between the nuclei. NOEs are routinely determined nowadays from so-called NOESY (2D NOE spectroscopy), although the 1D NOE variant is sometimes used in the case ofparamagnetic proteins (see below). NOEs thus give valuable structural information about a protein. To probe the two types of NMR information, two main classes of NMR experiments are in use. J coupling information can be obtained from correlated spectroscopy, for example, 2D correlation spectroscopy (COSY) and 2D total correlation spectroscopy (TOCSY) [or homonuclear Hartmann-Hahn spectroscopy (HOHAHA)], whereas NOEs can be effectively studied by NOESY. The theoretical basis of 2D NMR spectroscopy has been discussed in detail in the book by Ernst e t al. 4 Comprehensive reviews have been given of the application of 2D NMR techniques to study protein structures, 5-7 and the book by Wfithrich I gives a good introduction to this subject. Methodological aspects of 2D NMR spectroscopy have been described in two recent volumes of this series .8 Several exciting developments since the late 1980s promise to extend the NMR methodolI K. Wiithrich, " N M R of Proteins and Nucleic Acids." Wiley, New York, 1986. 2 D. Neff, G. Otting, and K. Wiithrich, J. Am. Chem. Soc. 112, 3663 (1990). 3 D. Neuhaus and M. Williamson, "The Nuclear Overhauser Effect in Structural and Conformational Analysis." VCH, New York, 1989. 4 R. R. Ernst, G. Bodenhausen, and A. Wokaun, "Principles of Nuclear Magnetic Resonance in One and Two Dimensions." Oxford Univ. Press (Clarendon), Oxford, 1987. 5 A. Bax, Annu. Rev. Biochem. 58, 223 (1989). 6 G. M. Clore and A. M. Gronenborn, Protein Eng. 1, 275 (1987). 7 K. Wfithrich, Acc. Chem. Res. 22, 36 (1989). 8 N. J. Oppenheimer and T. L. James (eds.), this series, Vols. 176 and 177.
[9]
MULTIDIMENSIONAL N M R OF METAL SITES IN PROTEINS
247
ogy with respect to both the size of the proteins that can be studied as well as the accuracy and precision of the structure determinations. These developments entail the extension of 2D NMR to 3D and 4D NMR spectroscopy, applied in a homonuclear fashion or used in conjunction with uniform 15N and ~3C labeling of proteins. The theoretical basis and early use of 3D NMR spectroscopy has been reviewed by Griesinger et al. 9 The utility of homonuclear 3D NMR methods has been demonstrated for several proteins. 1°-~3 The application of 3D and 4D NMR methods to structure determination has been reviewed by Clore and Gronenborn.14 The basic strategy for determining a protein structure by means of these types of NMR experiments is relatively straightforward and can be divided into three stages: (1) sequential assignment of main-chain and side-chain resonances; (2) derivation of a secondary structure based on a limited set of observed NOEs, coupling constants, and N H exchange rates; and (3) calculation of the 3D structure based on distance and torsion angle constraints derived from NOE intensities and the magnitude of J coupling constants, respectively, possibly supplemented with hydrogen bond constraints from NH exchange measurements. Stereospecific assignments greatly improve the quality of the distance and angle constraints. The first two stages of this strategy as applied to the blue copper protein azurin from P s e u d o m o n a s a e r u g i n o s a 13't5'16 are illustrated in Fig. 1, whereas two exemplary 3D solution NMR structures of metalloproteins, namely, P s e u d o m o n a s a e r u g i n o s a cytochrome c55~~7 and French bean plastocyanin, TMshown in Figs 2 and 3, illustrate the results of the final stage. The application of multidimensional NMR, possibly with 15N and/or 13C labeling, greatly improves the structure determinination procedure. 9 C. Griesinger, O. W. SCrensen, and R. R. Ernst, J. Magn. Reson. 84, 14 (1989). 10 H. Oschkinat, C. Cieslar, and C. Griesinger, J. Magn. Reson. 86, 453 (1990). 11 G. W. Vuister, R. Boelens, A. Padilla, G. J. Kleywegt, and R. Kaptein, Biochemistry 29, 1829 (1990). 12 S. S. Wijmenga and C. P. M. van Mierlo, Eur. J. Biochem. 195, 807 (1991). 13 M. van de Kamp, G. W. Canters, S. S. Wijmenga, A. Lommen, C. W. Hilbers, H. Nar, A. Messerschmidt, and R. Huber, Biochemistry 31, 10194 (1992). 14 G. M. Clore and A. M. Gronenborn, Annu. Rev. Biophys. Biophys. Chem. 20, 29 (1991). 15 H. Nar, A. Messerschmidt, R. Huber, M. van de Kamp, and G. W. Canters, J. Mol. Biol. 218, 427 (1991). 16 H. Nar, A. Messerschmidt, R. Huber, M. van de Kamp, and G. W. Canters, J. Mol. Biol. 221, 765 (1991). 17 D. J. Detlefsen, V. Thanabal, V. L. Pecoraro, and G. Wagner, Biochemistry 30, 9040 (1991). 18 j. M. Moore, C. A. Lepre, G. P. Gippert, W. J. Chazin, D. A. Case, and P. E. Wright, J. Mol. Biol. 221, 533 (1991).
248
PROBES OF METAL ION ENVIRONMENTS
[9]
~a
O
Q
""
g -~ .-=
~=
~=
.=_.~
~ Z ~
,T
.
.
.
.
K128
,,,
.
.
.
,-
.
.
.
.
o ~
.
E
.
"7-
So transition is much slower than the S~ ~ TOtransition because (1) the electronic orbitals of the initial and the final state are different, and (2) the latter transition presumably occurs through higher energy triplet states, which makes it easier to dispose of the excess energy as heat. The triplet state may decay directly to So under emission of radiation (phosphorescence) or without radiation. When the energy gap between the S~ and To states is comparable to kBT (kB is Boltzmann's constant and T is the temperature), the triplet may decay to So via $1 with emission of delayed fluorescence (Fig. 2). The energy of the TO state is usually appreciably lower than that of the S1 state. This is because the two unpaired electrons have the same spin quantum number and, according to the Pauli principle, cannot move in the same electronic orbital. On average the two electrons are farther apart in the triplet state than in the singlet state; hence, the energy of Coulombic repulsion is less and the state energy is lower. The decrease in repulsion energy is accounted for by introducing the electrostatic exchange energy, - J . For two unpaired spins on one molecule the exchange energy is usually negative ( J > 0), and the triplet state lies lower than the excited singlet state. This means that the wavelength of phosphorescence emission is longer than that of fluorescence emission.
ODMR OF TRIPLETSTATES
[10]
293
s2lc,I--T~r, i 7 "-a"a-~---t -ii'dT"~L---#--l--'l k,
[ P,-~/NR
"~'.~-O-z
12/
i t
"
FiG. 2. Energy level diagram of the singlet and triplet manifold. So, Singlet ground state; Sl and $2, singlet excited states; To and T1, first and second excited triplet states; SA and TA, singlet and triplet absorption, respectively; F and DF, fluorescence and delayed fluorescence, respectively; P, phosphorescence; NR, nonradiative transition; IC, internal conversion. Enlarged To levels: X, Y, and Z, eigen energies of the dipole-dipole interaction; D and E, zero-field splitting parameters. Downward arrows tending to the right, populating probabilities; to the left, decay rates; filled circles, equilibrium populations. Vl, v2, and v3 are the frequencies corresponding to the ([D[ + [Ei)/hand 2[El/h transitions, respectively. (From Ref. 2.)
1.2. Triplet Spin Hamiltonian in Zero Magnetic Field The triplet spin Hamiltonian without external magnetic field comprises interactions involving the magnetic moment of the electrons. These are 2-fold: spin-spin coupling and spin-orbit coupling. The main contribution to the spin-spin coupling o p e r a t o r , / t s s , is the classic magnetic dipoledipole interaction between two electrons: /lss
= ~3\~](g2fl2/z°] It(Si-S2r :3
(sl" r)(s2 r!)r s •
(1)
with g being the electronic g value, fl the electronic Bohr magneton, s I and s2 the magnetic moments of the two electrons, r their distance vector, a n d / x 0 the permeability of vacuum. Equation (1) can be rearranged to /~ss = S" ! ) - S
(2)
where !) is a tensor operator whose elements consist of integrals over the coordinates of the electrons and S is the total spin angular momentum operator S = sl + s2- !) can be diagonalized by a coordinate transformation to its principal axes, a n d / l s s becomes
Hss = _X~2_ r ~ 2 _ Z ~ z 2
(3)
where X, Y, and Z are the principal values of I) and Su (u = x, y, z) the components of S along the principal axes of I). Often, these axes coincide with the molecular symmetry axes.
294
PROBES OF METAL ION ENVIRONMENTS
[10]
In a two-electron approximation the triplet wave functions can be written in symmetry-adapted form ITx) = 2-1/2(fllfl 2 -- OtlOt2)
ITy) = 2-1/2i(fllfl 2 + a l a 2) ITz) = 2-1/2(o(1132 + flla2)
(4)
where ct and fl are the eigenfunctions of the component of the spin operator along the z direction, gz. The functions ITu) (u = x, y, z) belong to different irreducible representations of the point group C2~, which is assumed to be a subgroup of the symmetry point group of the molecule; they are eigenfunctions of g2 with eigenvalue 2 and are to a first approximation degenerate if we neglect the spin-spin interaction. The Hamiltonian [Eq. (2)] lifts the degeneracy, and it turns out that ITu) are eigenfunctions of Hss with eigenvalues X, Y, and Z. The ITs) functions have the property S~IT~) = 0,
SxITy) = -SyIT~) = i]Tz)
(5)
The second relation holds for cyclic permutation of the subscripts x, y, and z. Thus, the triplet component ITs) is an eigenfunction of the operator S~ with eigenvalue zero, that is ITu) corresponds to a situation where the spin angular momentum vector lies in the coordinate plane u = 0. From Eq. (5) it further follows that there is no net magnetic dipole moment associated with any of the triplet substates in zero magnetic field yh > ko and k , t ' >> 1 reduces to APpuI~ ~ = cf(k r - kr)N°o exp( - kot')
(31b)
Thus, by measuring the amplitude of the pulse-induced change in phosphorescence as a function of t', ko is easily evaluated. For k u >> ko the transient phosphorescence APpu~s~ decays with the fastest rate constant, ku, so that the MIDP experiment yields accurate values of both decay rates. When k, ~ kv a biexponental fit has to be carried out. Note that the microwave pulse need not be saturating, but must be short compared to the fastest decay time for the above simple analysis to apply. The method works best for rather disparate k~.v rates; the light switching has to be done much quicker than either of the decay times. The initial populations N°,o need not be the equilibrium ones, so in principle a laser flash may be used. 5 j. Schmidt, W. S. V e e m a n , a n d J. H. v a n der Waals, Chem. Phys. Lett. 4, 341 (1969). 6 j. G. W e e r s and A. H. Maki, Biochemistry 25, 2897 (1986).
[10]
ODMR OF TRIPLETSTATES
303
O t h e r s c h e m e s . A great many variants of the above schemes to measure the decay rates are possible, in some of which the spin-lattice rates are explicitly introduced (see, e.g., Refs. 1 and 2). Often, the treatment then gets more complex and one has to resort to numerical simulation along the lines discussed in Ref. 3 to evaluate the parameters of interest. 2.1.4. P o p u l a t i n g Probabilities. In the preceding section expressions are given to evaluate radiative and total decay rates from experimental kinetic traces. Here, a few experiments are discussed that allow the populating probabilities to be determined. We limit ourselves first to fluorescence, casu quo absorbance detection. R e s p o n s e to o n s e t o f illumination. The light is switched on at time t = 0 with saturating microwaves connecting two triplet levels in different ways, say, u ~ v and the double resonance x ~ y ~ z combination, while the fluorescence F is monitored. With Eqs. (13) and (15c) we then have 2 F"°(O)/F'°(~)- 1 FXyz(o)/FXyZ(°°) -
1
= (k/NK)NK ~Vps/k s
= k[2(p~ + po)/(k~ + ko) + pw/kw]
(32)
and similarly for F "w or F vw and F (no microwaves). The triplet excitation rate K is eliminated, and from a set of three equations the p values can be solved; as a check E, P,,exp should be close to unity. FXyZ(oo)and F'V(oo) are best measured by continuously irradiating the sample with u ~ v microwaves and switching the u -~ w (or v ~ w) microwaves on and off; the difference signal can be signal-averaged, yielding accurate relative values of F ( ° ° ) . 7 M i c r o w a v e switching u n d e r continuous illumination. The above method works only when the light can be switched on faster than the fastest sublevel decay rate. When this is difficult (e.g., for bacteriochlorophyll triplets), a variant may be used in which the relative fluorescence intensity under various conditions of saturating microwave irradiation is measured. For example, for low K [F~O(oo) - FXyZ(~)]/[ F,W(oo) - FXyZ(oo)] = (1 - kX~°ps/ks)/(1 - kX~Wps/ks)
(33)
with p~O = p~O = ½(Pu + Pv), k~ ~ = k~ ~ -= ½(k, + ko), etc., and similarly for F °w. With E, p , = 1, we again have three independent linear equations from which the p~ values are solved. Note that we now need all three ODMR resonances. 7 W. G. van Dorp, W. H. Schoemaker, M. Soma, and J. H. van der Waals, Mol. Phys. 30, 1701 (1975).
304
PROBES OF METAL ION ENVIRONMENTS
[10]
Simulation o f decay curves. With Eqs. (24c) and (24d) the experimental decay curves can be simulated for assumed values of k, and N O(the latter depend on the p,). Simulating (maximally) three decay curves simultaneously with five parameters (three k, and two p , , as E p, = 1), a best fit yields both the k, and the desired Pu. Note that this procedure works only if great care is taken that the factor f be the same for all three decay experiments. Phosphorescence detection. Dividing the phosphorescence response to a pulse of microwaves under continuous wave (CW) illumination for t = 0 [Eq. (24d)] by the MIDP response to an identical pulse for t = t' and k, >> kv [Eq. (31b)], we obtain AP"v(O)/AP"qt') ~ (N O - N ° ) / N ° exp( - kot')
(34)
and similarly for AP "w (provided k, >> ko). The prefactors are evaluated from a semilog plot versus t', and from them the relative populating probabilities p,/po and P,/Pw can be calculated for known sublevel decay rates. 8 2.1.5. Note o f Caution. A good many of the methods discussed in the previous sections rely on saturation, that is equalization of the populations of one or two transitions. This requires a very low temperature to inhibit spin-lattice relaxation and fairly large microwave powers to make the microwave-induced transition rate much larger than the fastest of the molecular decay rates. The latter requirement is often not met when the output of microwave sweepers (20-40 mW) is used without amplification. As a result large errors of more than a factor of 4 can be made in the evaluation of the molecular decay rates. 3'9 It is absolutely necessary to verify saturation by evaluating the decay rates as a function of applied microwave power. Preferably one should use pulse methods 5'7 to determine the k~ values. When randomly oriented samples are used, such as normally is the case for biological material, 100% saturation can never be achieved. This is a consequence of the polarization of the microwave transitions: the transition probability is proportional to cos 2/3, where/3 is the angle between the microwave field B~, and the transition moment. Hence, molecules whose transition moment is close to perpendicular to B 1 (this is a sizable fraction in view of the sin/3 distribution) have a low probability to be microwave-excited, and their sublevel population is not or is only 8 I. Y. Chan and B. N. Nelson, J. Chem. Phys. 62, 4080 (1975). 9 A. J. Hoff, in "Triplet State ODMR Spectroscopy" (R. H. Clarke, ed.), p. 367. Wiley (Interscience), New York, 1982.
[10]
ODMR OF TRIPLETSTATES
305
very slowly affected by the microwaves. This effect is quite noticeable, even at microwave powers exceeding 1 W at 1.2 K . 3 For such samples the pulse methods seem to be the only reliable way to measure the decay rates. Another pitfall in the determination of the k~ values is the dependence of the apparent decay rates on K, the rate of triplet formation, which is proportional to the light flux. This applies equally to equilibrium and pulse methods, except of course for the MIDP technique. As mentioned, extrapolation to K ~ 0 is not trivial because of the poor signal-to-noise ratio attendant with the requirement that K is much smaller than the slowest molecular decay rate (which can be less than 1 sec-l). Most workers prefer to fit a curve of ku versus K, using relations such as outlined in Ref. 3, but even then the fit in the K = 0 regime is often ambiguous.
2.2. Line Shape, Hole Burning, and Double Resonance The ZFS parameters of a triplet state are sensitive to its environment. The larger the interaction with the environment, the more spread one will find in the values of [DI and IEI. This translates into inhomogeneous broadening of the ODMR lines, which are often close to or even a perfect Gaussian. In molecular crystals ODMR line widths can be as narrow as 1 MHz, but in glassy matrices they often exceed 100 MHz. Such inhomogeneous broadening is demonstrated by so-called hole burning 1° in which a microwave transition, say, the IDI - IEI, is irradiated with constant power at a precisely defined, fixed frequency within the ODMR line, whereas the transition is simultaneously swept with a second modulated source of variable frequency. At the first frequency the ODMR will show a dip, because then the sublevel populations are already more or less equalized and additional power has comparatively little effect. An example is shown in Fig. 3C. The width of the " h o l e " is twice the homogeneous line width or equal to the frequency interval corresponding to the field intensity of the "burning" microwaves IB11, whichever is largest. (The latter situation is undesirable and should be avoided.) When a hole is found in the burned (e.g., IDI - IEI) transition, the IDI + IEI transition does not show a hole but is somewhat decreased in intensity. This is because the particular combination of [DI and IEI values that correspond to the precisely defined frequency of the hole in the IDI [El line sum to values that spread across the whole IDI + [El line. The ODMR line width is not very sensitive to the bandwidth of optical excitation. Usually a broad optical band corresponds to a broad ODMR 10 M. Leung and M. A. EI-Sayed, Chem. Phys, Lett. 16, 54 (1972).
306
~
182.8 193.6 209.1
MH£
[10]
PROBES OF METAL ION ENVIRONMENTS
467 MHz
.....
2
467
MHz
FiG. 3. (A) Double resonance (EEDOR) spectrum of the triplet state of Rhodobacter sphaeroides employing fluorescence detection. The first microwave field was set at 467 MHz, resonant with the IDI - [EI transition, while the second microwave field was scanned from 183 to 210 MHz. (B) IDI - IEI resonance of same, where crosses denote the computed Gaussian normalized to the experimental curve. The slight deviation to lower frequency is due to the ma~gnetic field of the earth. (C) Hole-burning experiment on the 467 MHz resonance of (B), One microwave field was set at 467 MHz while the frequency of a second field was slowly swept through the resonance. [From A. J. Hoff, Biochim. Biophys. Acta 440, 765 (1976).]
line because similar environmental interactions are at work. l 1-13H o w e v e r , selecting a narrow bandwidth of optical excitation (e.g., by using a laser) does not produce significant narrowing of the ODMR line, 14because generally there is little correlation (the effect of a similar perturbation in electronic m o l e c u l e - s o l v e n t interactions on the triplet wave function is different from that on the singlet wave function). In contrast to this lack of correlation, there are slight correlated shifts o f the ZFS values when the wavelength of detection is scanned across the p h o s p h o r e s c e n c e band. 15-17 When this correlation shows a discontinuity, it is indicative of the presence of more than one triplet site (e.g., tryptophans in a protein). In addition to the hole-burning double resonance experiment performed on one O D M R transition, one may carry out a double resonance experiment at two different O D M R frequencies, which is known as elect r o n - e l e c t r o n double resonance (EEDOR). Saturating one, say, the u v, transition equalizes the N ,"v and No"° populations. The population difference N ,"v - N °, is then increased or decreased compared to N O - N ° (or II j. p. Lemaistre and A. H. Zewail, Chem. Phys. Lett. 68, 296 and 302 (1979). n j. van Egmond, B. E. Kohler, and I. Y. Chan, Chem. Phys. Lett. 34, 423 (1975). 13 A. L. Kwiram, in "Triplet State ODMR Spectroscopy" (R. H. Clarke, ed.), p. 427, Wiley (Interscience), New York, 1982. i4 R. L, Williamson and A. L. Kwiram, J. Phys. Chem. 83, 3393 (1979). 15 j. U. von Schlitz, J. Zuclich, and A. H. Maki, J. Am. Chem. Soc. 96, 714 (1974). 16 A. L. Kwiram, J. B. A. Ross, and D. A. Deranleau, Chem. Phys. Lett. 54, 506 (1978). 17 R. L. Williamson and A. L. Kwiram, J. Chem. Phys. 88, 6092 (1988).
[10]
ODMR OF TRIPLETSTATES
307
vice versa for No), with a concomitant change in the intensity of the u -~ w or v ~ w transition. This is often useful to enhance the ODMR line corresponding to two sublevels whose equilibrium populations in the absence of microwaves are nearly equal. An example is shown in Fig. 3A. In addition E E D O R allows one to discriminate between ODMR resonances belonging to the same triplet state (the same site) when in a single resonance experiment more than three ODMR lines are recorded. The latter double resonance experiment is usually carried out by irradiating one transition with amplitude-modulated microwaves at fixed frequency and measuring with CW microwaves the other transitions while applying lockin detection at the modulated frequency. Only those transitions belonging to the same triplet as the first transition will then show up. 2.3. O p t i c a l M i c r o w a v e D o u b l e R e s o n a n c e
Once the ODMR lines of a triplet have been determined, the resonance frequencies are known precisely, and one can investigate the dependence of the intensity of a particular resonance line on the probing wavelength. Thus, one irradiates the sample with (amplitude-modulated) ~8 resonant microwaves of sufficient, preferably saturating intensity, and monitors the (lock-in detected) photodetector output as a function of the probe beam wavelength. The resulting spectra may be called microwave-induced phosphorescence, fluorescence, or absorbance spectra (abbreviated as MIP, MIF, and MIA spectra, respectively). For one particular triplet state, the shape of the spectra does not depend on the selection of the resonance frequency (i.e., v1,2 or v3). Obviously, if more than one triplet state is present, the microwave-induced spectra provide another means to sort out which resonances belong to the same triplet state. Conversely, microwave-induced spectroscopy allows the unraveling of complex optical spectra. MIF spectra are useful for discriminating between various triplet states and for identifying the triplet-carrying molecule, as exemplified by the studies of Beck et al. 19,20on photoinduced triplet states in bacterial photosynthetic membranes. MIA spectra are a case apart, since the~, provide much more information than the MIP or MIF spectra. As discussed in the next section, they represent the difference of the singlet ground state, " n o r m a l , " absorbance spectrum and the spectrum for the system when a triplet state is present. T h e y have therefore been labeled triplet-minuses M. A. E1-Sayed, D. V. Owens, and D. S. Tinti, Chem. Phys. Lett. 6, 395 (1970). 19j. Beck, G. H. Kaiser, J. U. von Schi)tz, and H. C. Wolf, Biochim. Biophys. Acta 634, 165 (1981). 2oj. Beck, J. U. von Schfitz, and H. C. Wolf, Z. Naturforsch. C: Biosci. 38, 220 (1983).
308
PROBES OF METAL ION ENVIRONMENTS
microwaves off
microwaves
[10]
on
FIG. 4. Principle of absorbance-detected magnetic resonance. Filled circles denote relative equilibrium populations of the triplet sublevels, open circles that of the ground state. A saturating microwave field connecting two triplet sublevels (wavy arrow) leads to a new (here, higher) equilibrium value of the singlet ground state population, hence to a change in the absorbance. The same principle holds for fluorescence detection, whereas the phosphorescence is also enhanced by the microwave field. (From Ref. 2.)
singlet absorbance difference (T - S) spectra, rather than by the MIA acronym. 21 2.3.1. Triplet-Minus-Singlet Absorbance Difference Spectra. When a triplet state is present, the absorbance spectrum contains the following contributions: (1) the unperturbed singlet ground state absorbance spectrum (S, ~ So transitions) of all molecules that are not in the triplet state and that do not interact with the molecule that is in the triplet state; (2) the perturbed singlet ground state spectrum of those molecules in a molecular aggregate (comprising proteins) that are not in the triplet state but do interact with the triplet-carrying molecule (generally this interaction will be different when this particular molecule is in the triplet state from that when the molecule is in the singlet ground state); and (3) the absorbance spectrum of the triplet state itself, consisting of Tn ~-- TOtransitions. With square-wave, on-off amplitude-modulated microwaves, the MIA spectrum represents the difference in absorbance of the sample for microwaves on and microwaves off (Fig. 4). It can be shown 21that this difference is proportional to the difference in absorbane with and without the triplet state present. In other words, the MIA spectrum represents the difference of the absorbance of the sample with all molecules in the singlet ground state and that when all molecules of one particular type are excited into the triplet state whose ODMR resonance is being monitored. It is important to note that other triplet states with different values of IDI and IEI and consequently different ODMR resonance frequencies may be present without showing up in the MIA (T - S) spectrum. Their absorbance is not changed by the microwaves, and therefore their contribution to the absorbance cancels in the ADMR-monitored T - S difference spectrum. On the other hand, recording T - S spectra for different ADMR 21 H. J. den Blanken and A. J. Hoff, Biochim. Biophys. Acta 681, 365 (1982).
[10]
ODMR OF TRIPLETSTATES
309
resonance frequencies provides a means to discriminate the resonances belonging to one and the same triplet states, since in general contributions (2) and (3) will be different for different triplet states. The ADMR-monitored T - S spectrum has several features of interest. For noninteracting triplet states it provides a very accurate triplet absorbance spectrum, since that spectrum is given by adding the " n o r m a l " singlet ground state spectrum to the T - S spectrum. For interacting triplet states, for example, those present in a photosynthetic pigment-protein complex, it records these interactions very sensitively and thus provides a unique means to study pigment configuration.
2.3.2. Linear Dichroic Triplet-Minus-Singlet Absorbance Difference Spectroscopy. The microwave transitions between the u and v triplet sublevels are polarized along w -- u x v. This is analogous to an optical transition, whose transition dipole moment usually has a well-defined direction in the molecular frame. Often, the direction of the triplet magnetic resonance transition moments are not as well-known. In chlorophylls, for example, one may be reasonably certain that the z transition moment is perpendicular to the molecule and that the x and y transition moments lie in the plane of the macrocycle, but the precise direction in the plane of the latter was until recently not known. As will be shown below, linear dichroic (LD)-(T - S) spectroscopy provides a means to ascertain the directions of the magnetic transition moments. With this knowledge one may then derive from the LD-(T - S) spectra precise structural information on molecular aggregates. In optical spectroscopy, the transition probability for a transition with transition dipole p is proportional to [E[2lp[2 COS 2 /3, where /3 is the angle between p and the E electric vector of the (polarized) incident light. A similar relation holds for the magnetic microwave transitions between the triplet sublevels. Thus, for a microwave transition moment t~w and an angle /3 between tXr~w and the B1 magnetic vector of the (polarized) microwave field, we have a transition probability IBllZlt~mwl z cos 2/3. It follows that molecules oriented with /Zmwmore or less parallel to B 1 have a much higher transition probability than those oriented about perpendicular to B1. (Of course, for /3 = 90 °, the transition probability is exactly zero.) Hence, for random excitation to the triplet state, molecules oriented in an angular interval d/3 close to/3 = 0 ° will experience a much higher change in their relative triplet concentration on the application of (polarized) resonant microwaves than molecules in an interval d/3 close to /3 = 90 °. Consequently, the distribution of triplet states, which was isotropic before the application of the microwaves, becomes axially anisotropic with the axis parallel to B1 when resonant microwaves are switched on.
310
PROBES OF METAL ION ENVIRONMENTS
fl-----..~ tamp
"~),/
/
Lo/(,.~
]
i]mw :
/x' ,
.I. sample
[I0]
t..'r_M
chromator
I
,
FIG. 5. Schematic drawing of the LD-ADMR experiment. !11, Microwave field vector; prow, microwave transition moment; ~o, optical transition moment; x', y', z', laboratory frame; PEM, photoelastic modulator. Unpolarized light becomes elliptically polarized because of the anisotropic transmittance of the sample induced by the microwave field resonant with an ODMR transition. The ellipticity is analyzed by the PEM and the polarizer. [Adapted from E. J. Lous, Doctoral Dissertation, University of Leiden, The Netherlands (1988).]
The microwave-induced anisotropy in the triplet state distribution can be interrogated with a beam of polarized light. F o r example, let us assume that the optical transition m o m e n t p is parallel to/.tmw, that the microwaves decrease the triplet concentration, and that we interrogate at a wavelength where the singlet ground state has an absorption band and the triplet state does not absorb. Then, for light polarized parallel to BI we will measure a lower transmittance than for light polarized perpendicular to B l . (Along B~ there are fewer triplets, hence more singlet ground states, than perpendicular to B~.) Obviously, the difference in transmittance (which for small changes can be taken equal to the difference in absorbance AA 21 will depend on the angle a between p and Pmw" In the above example, the sign of AA = All - A L would be reversed if ot is not 0 ° as assumed, but 90 °. Going from a = 0 ° to ot = 90 °, at a given angle AA must b e c o m e zero. This is the magic angle ot = 54.7 ° [for which 3 cos 2 a - 1 = 0, see Eq. (35)]. Thus, from the magnitude of AA relative to the magnitude of A we should be able to directly derive ot (Fig. 5). It will be recognized that the above description of the microwaveinduced selection in the triplet state distribution is very similar to that of photoselection. We can therefore partake of the formalism derived for that technique (see, e.g., Ref. 22) to calculate the functional relationship between AA and a. In doing so, we must of course average over all positions of the molecules with respect to B1, assuming a random initial distribution. To simplify this averaging we further assume that the triplets 22 A. Vermeglio, J. Breton, G. Paillotin, and R. Cogdell, Biochim. Biophys. Acta 501, 514 (1978).
[10]
ODMR OF TRIPLETSTATES
311
~I-""'----~R-LD-IT-S)~,-~,--,- " lb"
z'o" '
-0.2
' o
.;-
! c
,gg
i i _J
w
I
I
~
Z
o
vv
Z,
II'
'~® ~
'
o
Tvv_,vv
i
,d
[10]
ODMR OF TRIPLETSTATES i
I
I
i
327 I
i
P700 (960 MHz)
A
g
600
|
I
I
I
625
650
675
700
725
Wavelength (nm) FIG. 11. T - S spectra at 1.2 K of reaction center particles of photosystem I (P700) and photosystem II (P680). The spectra were recorded at the IDI + IE[ transitions at the indicated frequencies and normalized on the major bleaching. (Courtesy Dr. R, van der Vos.)
coupling is much weaker in the triplet state of 3D, so that in a localized 3D state part of the BChl absorption is bleached and part shifts back to the "normal" wavelength of BChl absorption in a protein matrix, giving rise to the large positive band at about 830 nm. The two smaller features at the long- and short-wavelength side of the positive band are attributed to band shifts of the two accessory BChls induced by the change D 3D.21 The small positive band at 872 nm is a triplet-triplet absorption of 3D, whose t m is oriented along the NII-NIv axis in the BChl macrocycle.
FIG. 10. T - S spectra and LD-(T - S) spectra at 1.2 K of Rps. viridis for the two A D M R transitions at ]D[ - IEI (A) and IOl + IEI (B). Dots mark the measured spectra, the solid line are simulations assuming the triplet state of D localized on the D A monomer, and the dashed lines are simulations assuming 3D to be localized on D e . (From Ref. 76.)
328
PROBES OF METAL ION ENVIRONMENTS
[10]
The absence of significant bands in the 790 nm region indicates that the two • pigments, qbA and ~B, are only weakly coupled to D. In addition to the above conclusions, the spectral simulations allowed the investigators to infer that the y spin axis of the localized triplet state is very close to the NI-N m axis at an angle of I0 °, with the x and y spin axes lying approximately in the plane of the BChl macrocycle (sublevel ordering y, x, z for D, E > 0). The calibrated T - S and LD-(T - S) spectra allowed calculations of the position of the Qy tm of all coupled BChls and • molecules in the x,y,z spin axes coordinate frame, and consequently all their mutual angles. With minor differences the qualitative aspects of the above picture hold for all purple bacteria investigated. 9° The T - S spectra of green photosynthetic bacteria and of Heliobacterium chlorum are more complex and have only been tentatively interpreted, 66,9~,92 with the exception of the green gliding bacterium Chloroflexus (Cfl.) aurantiacus, whose RC is very similar to that of purple bacteria. 93'94 The above results show that, once the crystal structure is known, one can draw very detailed conclusions from a simulation of the T - S and LD(T - S) difference spectra. Now that the (fairly simple) exciton treatment appears to be good enough to simulate accurately optical spectra, one might ask whether the reverse is also possible, namely, predicting from a simulation of optical (difference) spectra the crystal structure. For a completely unknown RC this is obviously a tall order, in view of the very large parameter space. For RCs closely related to those of Rps. viridis and Rb. sphaeroides R-26, however, this can indeed be done, as was demonstrated by Scherer and Fischer, 89'95Vasme169'94 and H. Vasmel (unpublished simulations, 1986), who were able to simulate and predict remarkably well the T - S and LD-(T - S) spectra of Cfl. a u r a n t i a c u s 89'94 and of a chemically modified RC ofRb. sphaeroides R-26. 95-97 This opens the prospect of interpreting the T - S spectra of the RC of photosystem 9o j. A. Dijkman, H. J. den Blanken, and A. J. HolT, Isr. J. Chem. 28, 141 (1988). 91 A. J. Hoff, H. Vasmel, E. J. Lous, and J. Amesz, in "Green Photosynthetic Bacteria" (J. M. Olson, J. G. Ormerod, J. Amesz, E. Stackebrandt and H. G. Triiper, eds.), p. 119. Plenum, New York, 1988. 92 j. Vrieze, E. J. van de Meent, and A. J. Hoff, in "The Photosynthetic Bacterial Reaction Center II" (J. Breton and A. Vermrglio, eds.), p. 67. Plenum, New York, 1992. 93 H. Vasmel, R. F. Meiburg, J. Amesz, and A. J. Hoff, in "Progress in Photosynthesis Research" (J. Biggins, eds.), Vol. 1, p. 403. Nijhoff, Dordrecht, The Netherlands, 1987. 94 H. Vasmel, Doctoral Dissertation, University of Leiden, The Netherlands (1986). 95 p. O. J. Scherer and S. F. Fischer, Chem. Phys. Lett. 137, 32 (1987). 96 D. Beese, R, Steiner, H. Scheer, B. Robert, M. Lutz, and A. Angerhofer, Photochem. Photobiol. 47, 293 (1988). 97 A. Angerhofer, D. Beese, A. J. Hoff, E. J. Lous, and H. Scheer, in "Applications of Molecular Biology in Bioenergetics of Photosynthesis" (G. Singhal, ed.), p. 197. Narosa Publ., New Delhi, 1989.
[10]
ODMR OF TRIPLETSTATES
329
II, which is believed to be closely related to that of the purple bacteria (see below). P l a n t r e a c t i o n c e n t e r s . The T - S spectra of RC of the plant photosysterns are characterized by a strong bleaching of donor bands at 703 and 682 nm for photosystems I and II, respectively (Fig. 11). In photosystem I a positive band appears at the blue side of this bleaching, close to the wavelength of the absorption of Chl a in vitro. 67 Analogously to the interpretation of the T - S spectra of the purple bacteria, this band was attributed to the appearing absorption of a monomeric Chl a molecule belonging to a primary donor dimer on which the triplet state was localized on the second Chl a , 67 supporting the notion that in photosystem I the primary donor is a dimeric Chl a complex. The above-mentioned positive component is much smaller in the T S spectrum of photosystem II, 68,99,1°° rendering assignment to a dimeric primary donor complex tenuous. More information was sought by LD(T - S) spectroscopy. 98 It turns out that the t m of both the bleaching and the small positive contribution make about the same angles with the triplet x , y axes, which are practically the same as the angles measured for monomeric Chl a in vitro. This makes it very unlikely that the primary donor of photosystem I! is composed of two Chl a molecules with a sizable exciton interaction. It thus appears that even though two Chl a molecules may be bound to the RC protein of photosystem I! in locations similar to those o f the two primary donor BChls in the bacterial RC protein, only one functions as the primary donor. 4. Prospects of Optically Detected Magnetic Resonance Spectroscopy of Metalloproteins Some of the proteins discussed in previous sections contain metals and are technically metalloproteins. This does not mean that they are normally classified as such. This is especially true for the photosynthetic reaction centers that contain a divalent Fe ion. The function o f this ion, however, is not clear; it does not appear to play a significant role in early electron transport. Possibly it functions in setting the redox potential of secondary quinone acceptors, regulating electron transfer between them. It is tempting to envision the application of ODMR to metalloproteins containing a functional metal. It is unlikely that the metal itself can be 98j. Vrieze, P. Gast, and A. J. Hoff, in "Research in Photosynthesis" (N. Murata, ed.), Vol. I, p. 553. Kluwer Academic Publ., Dordrecht, The Netherlands, 1992. 99R. van der Vos, P. J. van Leeuwen, P. Braun, and A. J. Hoff, Biochim. Biophys. Acta in press (1992). i00D. Bernlocher, A. Angerhofer, and B. Robert, Proceedings of the International Symposium on MagneticField and Spin Effects in Chemistry, in press. Konstanz, Germany, 1992.
330
PROBES OF METAL
ION ENVIRONMENTS
[11]
studied, as few metals can be excited to a metastable triplet state. E v e n then, fast rates of relaxation and decay may not allow the detection of O D M R signals. More likely, the metal ligands will be amenable for study by O D M R . F o r example, metals are often liganded to histidine residues, and although these are not favorable for O D M R , triplets generated on the histidines m a y be detectable on tyrosines or tryptophans through energy transfer (Section 3.1). It m a y be anticipated that the h e a v y metal effect (Section 3.1. l) will be of importance, providing a clue to the distance between the metal site and a liganded c h r o m o p h o r e . In addition, fastrelaxing paramagnetic metal centers will influence the spin-lattice relaxation time o f the triplet manifold o f nearby aromatic amino acids, which can be verified by temperature-dependent ODMR. This again will provide distances and perhaps in favorable cases the orientation of the chromophore with respect to the metal. Thus, although presently O D M R is not much applied to metalloproteins, the future may see more activity in this field. Acknowledgments This chapter was written during my tenure as a Visiting Fellow at Corpus Christ! College, Oxford. I gratefully acknowledge the hospitality provided both by the College and by the Physical Chemistry Laboratory of the University of Oxford. I am indebted to Profs. J. H. van der Waals and J. Schmidt of the Leiden Centre for the Study of Excited States of Molecules, who over the years assisted with equipment, laboratory space, and stimulating interest. Much of the work carried out in Leiden was performed by Drs. H. J. den Blanken, E. J. Lous, R. van der Vos, and J. Vrieze with skill and unstinting enthusiasm under the auspices of the Netherlands Foundation for Chemical Research (SON), financed by the Netherlands Foundation for Scientific Research (NWO). Finally, I am indebted to Elsevier Science Publishers for allowing me to quote several sections of Ref. 2.
[11] Electron Paramagnetic
Resonance
By JOHN R. PILBROW and GRAEME R. HANSON Introduction Electron paramagnetic resonance (EPR) and electron spin resonance (ESR) are s y n o n y m o u s terms I for describing the resonant absorption o f m i c r o w a v e radiation by a paramagnetic substance in a static magnetic i The International EPR Society recommends that EPR be used as the preferred acronym.
METHODS IN ENZYMOLOGY, VOL. 227
Copyright © 1993 by Academic Press, Inc. All rights of reproduction in any form reserved.
[11]
ELECTRON PARAMAGNETIC RESONANCE
331
field. A paramagnetic substance consists of weakly interacting ions or free radicals that possess permanent magnetic moments originating from electron spin and also, in most cases, including contributions from the electron orbital angular momentum, z-3 In metalloproteins these constituents are usually present as cofactors involving transition metal ions, multiatom clusters, or free radicals, which may have a structural role or more impotantly are intrinsically involved in enzymatic catalysis and/ or electron transfer. Because the tertiary structure of metalloproteins is normally diamagnetic, EPR is a powerful method for characterizing the structure of the paramagnetic cofactor in the resting enzyme, enzyme-substrate intermediates, and product complexes. Apart from scandium and titanium, all of the first row transition metal ions and the second and third row elements molybdenum and tungsten have been found in a wide range of metalloproteins. 4 Sometimes it is possible to replace the catalytically essential diamagnetic, and spectroscopically silent, metal ion such as zinc(II), calcium(II), or magnesium(II) by one that is spectroscopically active, notably cobalt(II) or manganese(II). This provides additional scope for the investigation of a wide range of proteins and enzymes with EPR spectroscopy. 5'6 In many cases magnetic coupling between two or more paramagnetic centers can be observed in the EPR spectra of metalloproteins, which is suggestive of the existence of either metal clusters or an electron transfer chain. Finally many transition metal ions such as copper, manganese, and vanadyl ions are found to bind extrinsically to proteins. This is advantageous because their EPR spectra can often be observed at room temperature. 7 In restricting this chapter to transition metal ions, major areas of EPR in biology concerning spin labeling, spin trapping, and radiation-induced radicals are not considered. This chapter concentrates on basic principles 2 j. R. Pilbrow, "Transition Ion Electron Paramagnetic Resonance." Clarendon Press, Oxford, 1990. za A. Abragam and B. Bleaney, "Electron Paramagnetic Resonance of Transition Ions." Oxford Univ. Press (Clarendon), Oxford, 1970. 3 H. M. Swartz, J. R. Bolton, and D. C. Borg (eds.), "Biological Applications in Electron Spin Resonance." Wiley (Interscience), New York, 1972. 4 j. j. R. Fratlsto da Silva and R. J. P. Williams, "The Biological Chemistry of the Elem e n t s - T h e Inorganic Chemistry of Life." Oxford Univ. Press (Clarendon), Oxford, 1991. 5 B. L. Vallee in "Metal Ions in Biological System" (S. K. Dahr, ed.), p. 1. Plenum, New York, 1955. 6 B. L. Vallee and B. Holmquist, in "Methods for Determining Metal Ion Environments in Proteins, Structure and Function of Metalloproteins" (D. W. Damell and R. G. Wilkins, eds.), Vol. 2, p. 27. Elsevier, New York, 1980. 7 R,C. Sealy, J. S. Hyde, and W. E. Antholine, i n " M o d e m Physical Methodsin Biochemistry" (A. Neuberger and L. L. M. Van Deenen, eds.), p. 69. Elsevier, New York, 1985.
332
PROBES OF M E T A L I O N E N V I R O N M E N T S
[11]
of continuous wave EPR (CW-EPR) as applied to metalloproteins. Other chapters in this volume are devoted to a range of specialized topics, such as pulsed electron nuclear double resonance (ENDOR), CW-ENDOR, vanadyl ENDOR spin probes, electron spin echo envelope modulation (ESEEM), iron EPR Spectroscopy, intrinsic and extrinsic paramagnets as probes of metal clusters, and EPR spectrochemical titrations. The information obtained from an EPR spectrum can be divided into two classes: (I) structural information obtained from the spin Hamiltonian parameters and (2) the quantification of the EPR signal intensity. Although most researchers use EPR spectroscopy for the elucidation of structural information, spin quantitation can be used to determine (1) the number of EPR active centers present and the spin state, (2) the redox potentials of a paramagnetic center, and (3) the rate constants for biochemical reactions. Electron Paramagnetic Resonance of Transition Metal Ions The basis for understanding the properties of paramagnetic ions in proteins is the set of closely spaced electronic energy levels that are dependent on the number of d electrons, the symmetry arrangement, and the number and type of neighboring ligand atoms or ions.2-3 Later, we give a brief, largely descriptive, introduction to the most commonly occurring electronic d configurations. Rather more detail than is possible here may be found in a book by one of the authors. 2 In the meantime a general introduction to EPR follows. In the simplest system to introduce EPR, one has an electron spin of ½ and two degenerate energy levels in the absence of a magnetic field. These two levels diverge linearly in an applied magnetic field, and resonance occurs when the microwave quantum of energy exactly equals the spacing between the levels (Fig. 1). Line broadening from neighboring spins, unresolved electron nuclear hyperfine interactions, and relaxation effects means that there is no longer a unique resonance, but an overlapping family of them. This is termed inhomogeneous broadening. There are various possibilities. Sometimes the interactions are isotropic, that is, they do not vary with orientation of the magnetic field relative to the molecule and the resonance is unchanged as the magnetic field is rotated in the case of a crystal. However, anisotropy occurs in most paramagnetic systems and arises from the interactions between the paramagnetic electrons and the surrounding anisotropic electron distributions associated with the neighboring ligand atoms or ions. The energy of interaction (U) between a paramagnetic ion, with magnetic moment ~, and a magnetic field B is U = -g,.a
(1)
[11]
ELECTRON PARAMAGNETICRESONANCE
333
'~C ~0.3cm -I
s=½
Bo~O.3T
Kramers Doublet
Ms = - ~ / ~ ~ 'X, II
dB
ABSORPTION FIRST DERIVATIVE
MAGNETIC FIELD
J~__ ~,~/~
L
/ Bo
~
}.
B
FiG. 1. EPR in a Kramers doublet (spin ½). [Reproduced with permission from T. D. Smith and J. R. Pilbrow, in "Biological Magnetic Resonance" (L. J. Berliner and J. Reuben, eds.), Vol. 2, p. 85. Plenum, New York, 1980.]
In paramagnetism it is assumed that the magnetic moments of the paramagnetic centers are only weakly coupled and that, to a very good approximation, they can be assumed to be isolated from one another. This is true for low concentrations of single transition metal ions or for paramagnetic metal ion clusters where each cluster possesses a net magnetic moment. The relation between the magnetic moment, it, and associated electron spin, $, where both # and S are considered to be quantum mechanical operators, is tz = -g/3S
(2)
where/3 is the Bohr magneton and g is the electronic splitting factor. The latter is characteristic of the environment in which the unpaired electron is located. In contrast to nuclei, the gyromagnetic ratio for free electrons, 3/, that is, the ratio o f angular m o m e n t u m to magnetic moment, is negative. In the case of free radicals, g is close to the free electron value of 2.0023 and nearly isotropic. The potential energy of the dipole in the magnetic field now becomes -- gBS. B
(3)
334
PROBES OF METAL ION ENVIRONMENTS
[11]
Actually it is customary to use the symbol ~ in place of U. ~ is known as the Hamiltonian and in EPR it is usually referred to as the spin Hamiltonian. For a two-level system, in which the electron spin is S = 4, the energies of the two levels obtained by solving the eigenvalue problem ( ~ = E ~ ) with the spin Hamiltonian given in Eq. (3) are E + = +--½gflB
(4)
An EPR transition at a fixed frequency, vc, occurs when the magnetic field is varied until the resonance value of B 0 is reached. Therefore, AE
= E+ -
E_ = hv c = gBB o
(5)
In the two-level example shown in Fig. 1 the levels are described by Ms = ---4. Resonant absorption can be explained as follows. The transition rate for induced transitions (4 ~ -4) and (-4 ~ 4) can be calculated using the rules of quantum mechanics. These are magnetic dipole transitions and occur only when the sample is placed in a magnetic field, B, and where there is a component of the microwave magnetic field, B1, perpendicular to B. The selection rule for the quantum number Ms is [AMs[-- ---1
(6)
In thermal equilibrium, the number of paramagnetic ions in the upper and lower energy states can be calculated from the Boltzmann formula. Because an excess population exists in the lower state, the EPR signal intensity must depend on this Boltzmann population difference. In continuous wave EPR the absorption process disturbs the system from equilibrium only by a very small amount. Spin-lattice relaxation processes, which result from an indirect coupling of the electron spins to the surrounding crystal or molecular lattice, remove the excess energy nonradiatively and maintain the near-equilibrium or steady-state situation. This is characterized by the time T1. Spin-lattice relaxation is very much dependent on temperature (T). The relaxation rate for a number of situations can be written as follows: T1-1 = a T + b T n + c A 3 e a/kr
(7)
where a, b, and c are constants and k is the Boltzmann factor. Equation (7) is one of the very important equations in EPR theory for it underpins considerations as to whether a spectrum can be observed. The first term is very important at very low temperatures. The second term arises from Raman relaxation processes and is important at higher temperatures. For odd-electron ions n = 9, whereas n -- 7 for even-electron ions. The final term (Orbach process) involves relaxation transitions to excited electronic
[11]
ELECTRON PARAMAGNETIC RESONANCE
335
states at an energy A above the ground state. It applies, for example, to high-spin d 5 heme proteins and also to high-spin cobalt(II) (S = ~) centers in cobalt-substituted zinc enzymes. For low-spin d 5 heine proteins the relaxation depends on a fractional dimension of ~, consistent with the dimensionality of the protein backbone. In most cases TI is so short at room temperature that EPR cannot be observed, and experiments often must be performed at the temperature of liquid helium. Insertion of the values of fl and h in appropriate units into Eq. (5)8,9 gives the resonance condition B0 (mT) =
71.448 × vc (GHz) g
(8)
At X-band microwave frequencies, for example, 9.248 GHz, the resonant field position for a free electron (g = 2.0023) will be 330 mT (3300 gauss). The SI unit of magnetic induction is the tesla (T) which is equivalent to 10,000 gauss.
Spin Hamiltonian and Effective Spin The concept of the spin Hamiltonian has been known for a long time ~°-~3 and allows the determination of the energies of the spin states responsible for EPR spectra. It can be written in the conventional way for an ion with effective spin S and nuclear spin ! as = ~FS + flB.g.S + S.A.I + I.Q.I
-
gnflnB.l
(9)
where ~FS represents various second-order and higher terms in electron spin components which give rise to fine structure in the spectrum. Here 13 is the Bohr magneton, as before, fl~ is the nuclear magneton, and S and ! are the electron spin and nuclear spin operators, g is the electron Zeeman interaction matrix, and A is the hyperfine coupling matrix for the interaction between S and the nuclear spin I of the central metal ion. Q (sometimes called P) is the quadrupole tensor, and the last term represents the nuclear Zeeman effect. There can also be an equivalent set of hyperfine, quadrupole, and nuclear Zeeman terms from one or more ligand nuclei. The spin Hamiltonian is another of the important equations in EPR. The condition in Eq. (5) does not always strictly hold, for example, when S > ½or when 8 E. R. Cohen and B. N. Taylor, CODATA Bull. 63, 1 (1986). 9 E. R. Cohen and B. N. Taylor, J. Res. Natl. Bur. Stand. (U.S.) 92, 85 (1987). i0 A. Abragam and M. H. L. Pryce, Proc. Phys. Soc. London, Sect. A 205, 135 (1951). it A. Abragam and M. H. L. Pryce, Proc. Phys. Soc. London, Sect. A 206, 173 (1951). 12 M. H. L. Pryce, Phys. Rev. 80, 1107 (1950). ~3 M. H. L. Pryce, Proc. Phys. Soc. London, Sect. A 63, 25 (1950).
336
PROBES OF M E T A L I O N E N V I R O N M E N T S
[11]
hyperfine coupling, including quadrupole and nuclear Zeeman interactions, are present or at low magnetic fields. The effective spin, S, may be calculated from the number of low-lying paramagnetic energy levels (2S + 1) responsible for the EPR spectrum and which are split up in an applied magnetic field. When S is greater than ½, the ~FS term in the spin Hamiltonian for symmetries lower than cubic is = D [ S z 2 - S ( S + 1)/3] + E(S~ 2 - Sy 2)
(10)
where D and E, which determine the zero-field splittings, arise from axial and rhombic distortions of the ligand field, respectively.
Orientational Dependence
of g Factors and Hyperfine Splittings
In contrast to nuclear magnetic resonance (NMR), the magnetic moments of electrons, and hence g factors, of transition ions in crystalline and molecular environments are frequently very anisotropic; in other words, the EPR properties depend on the orientation the applied magnetic field makes with the molecular framework. For ions in sites of 3- or 4fold symmetry, two g factors, gll and g±, are required to describe EPR spectra. In general, three g factors are needed, and the orientational dependence of the g factor is given by g2 = lx2gx 2 + ly2gy2 + iz2gz 2
(11)
where Ix, ly, and Iz are the direction cosines relating B to the principal g axes. With regard to the electron nuclear hyperfine interaction, in general, three components are needed, and the orientational dependence of the hyperfine interaction is given by a slightly more complicated relation: A2g 2 = Ix2Ax2gx 2 + ly2my2gy 2 + lz2Az2gz 2
(12)
In this chapter only the first-order resonance equation is given, although interpretation of transition metal spectra requires the inclusion of higher order terms, 2 B = B o - A M I / g fl
(13)
where B 0 and g are related by the resonance condition [Eq. (5)]. Hyperfine lines are separated, to a first approximation, by an equal amount A / g f l in field units such as gauss or millitesla. We now consider the commonly occurring d electronic configurations and coupled systems found in biological systems.
[11]
ELECTRON PARAMAGNETIC RESONANCE
337
dr: Vanadium(IV), Molybdenum(V), and Tungsten(V). The d I configuration is more complicated than might first appear since the original electron orbital states, even if not mixed by low-symmetry ligand fields, experience state mixing owing to the spin-orbit coupling of the orbital and spin magnetic moments. In the case of axial symmetry the spin Hamiltonian requires two g factors (gll and g±) and two hyperfine constants (All and A±). In the absence of oxo or sulfido ligands coordinated to the metal ion, the ligands produce a trigonal distortion with the unpaired electron in a metal-based dz2 orbital. However, this situation is uncommon in metalloproteins, and oxo or sulfido ligands usually impose a tetragonal distortion on the metal ion with the unpaired electron in a metal-based dxy orbital. For metaUoproteins containing an oxovanadium(IV) center [stVO(II); S = ½, I = ~], typical anisotropic g and A values are gll "~ 1.94 and g l ~ 1.98-1.99, whereas Aib, assumed negative, is typically around 0.02 cm-1 and A± -~ 0.006 cm -1.14 Naturally occurring molybdenum consists of a mixture of isotopes. The even isotopes, with a total natural abundance of 75%, have I = 0, and the remaining 25%, consisting of 95Mo and 97Mo, have I = ~ and essentially equal hyperfine splittings. Typical values of the hyperfine principal values (All and A±) lie in the ranges 0.004-0.008 and 0.0020-0.0025 cm -~, respectively. It is generally found that gll > g± with gll ~ 1.99 and g± ~ 1.95-1.96, although sulfur coordination can produce gll values equal to or greater than 2. Molybdenum sites in enzymes such as xanthine oxidase are not axially symmetric, and, in many cases, evidence for symmetry lower than orthorhombic is obtained from experiments and associated computer simulations carried out at more than one microwave frequency. ~5 Formate dehydrogenase 16'17 has been shown to contain a tungsten cofactor with a structure similar to that found for the molybdenum cofactor in mononuclear oxomolybdenum enzymes. dS : Low- and High-Spin Iron(Ill) and Manganese(II). The d 5 configuration is an interesting case as it has a half-filled d shell. There are two main possibilities, high spin and low spin. EPR spectra have identified both high-spin (S = ~) and low-spin (S = ½) sites in heme proteins. The review by Palmer TM on the EPR of heine proteins provides a readable introductory account of the theory. 14 N. D. Chasteen, in "Biological Magnetic Resonance" (L. J. Berliner and J. Reuben, eds.), Vol. 3, p. 53. Plenum, New York, 1981. 15 G. L. Wilson, R. J. Greenwood, J. R. Pilbrow, J. T. Spence, and A. G. Wedd, J. Am. Chem. Soc. 113, 6803 (1991). 16 S. Mukand and M. W. Adams, J. BioL Chem. 265, 11508 (1990). i7 S. Mukand and M. W. Adams, J. Biol. Chem. 266, 14208 (1991). is G. Palmer, in "The Porphyrins" (D. Dolphin, ed.), p. 313. Academic Press, New York, 1979.
338
[11]
PROBES O F M E T A L I O N E N V I R O N M E N T S
E/D=0
E/D=113
gY
9x g..L
i8~"'-"O'~ 3,530
0
Zg~. 9967
0.6
J
3.53D~ g,~
o
0.6
0.86 1=,
B(//)
1=_
B(xl
B(z)
11
B(xl B(y7
b FIG. 2. Schematic energy level diagrams for high-spin Fe 3+ in the weak magnetic field limit where resonance is observed only within and not between doublets. (a) E/D = 0; (b) E/D = ]. The effective g factors are indicated. (Reproduced from Ref. 19, with permission.)
To understand the high-spin case, 19 observed, for example, in some heme proteins, g [Eq. (9)] is in all cases nearly isotropic, and the effective spin is the same as the real free ion spin of~. The spin Hamiltonian requires additional terms that are fourth-order polynomials in the components of the spin including ~Fs given by Eq. (10). For some high-spin heme proteins, the three paramagnetic (Kramers) doublets are separated by energies of approximately 20 and 30 cm -1, respectively (see Fig. 2). Consequently resonance is only observed in the lowest of these doublets, yielding glJ -2 and g l = 6, corresponding to axial symmetry (E/D = 0). The condition E/D -- ] leads to g factors ranging from 0.6 to 10.0 (see Fig. 2), though this case is most usually identified by the g ~ 4.3 isotropic resonance from the middle doublet. The high-spin case is also important for mononuclear and magnetically coupled manganese(II) ions. EPR spectra of the 19T. D. Smith and J. R. Pilbrow, in "Biological Magnetic Resonance" (L. J. Berliner and J. Reuben, eds.), Vol. 2, p. 85. Plenum, New York, 1980.
[11]
ELECTRONPARAMAGNETICRESONANCE
339
mononuclear sites consist of a six-line hyperfine splitting of each transition arising from the manganese hyperfine coupling of approximately 9 mT. The low-spin d 5 configuration may be described by the theory for d ~ with some minor sign changes in the equations for g and A principal values. The g factors are anisotropic, lying typically in the range 1.5-3.0. EPR spectra of nitrile hydratasez° consist of two components each having three main features corresponding to the principal g factors. Such spectra are usually observed only at fairly low temperatures. dT : Low- and High-Spin Cobalt(II). Low-spin cobalt(II) has a single unpaired electron in a metal-based dz2 orbital and is found as an intrinsic constituent of the coenzyme vitamin B12 in its reduced form. 21 Identification of ligands axially coordinated to the cobalt ion can be readily identified from ligand hyperfine interactions. High-spin cobalt(II) ions can occur in a range of geometries ranging from octahedral to tetrahedral with five-coordinate geometries in between. The ligand field theory describing the energy levels for cobalt(II) in these geometries has been reviewed by Banci et al. 22 For octahedral high-spin cobalt(II) a doublet is lowest in energy which is very anisotropic. EPR spectra are only observed in the lowest doublet, a situation that can be described by an effective spin of ½. Because of the rather complex interactions involved, the g factors are far removed from 2. In the case of a purely octahedral field, g = 4.3, but in anisotropic cases the values may lie somewhere between 2 and 8. So in this case, the true spin of for the free ion and the effective spin of ½are quite different. Octahedrally coordinated cobalt sites have been found in cobalt(II)-substituted zinc phospholipase C . 23 Distorted tetrahedral cobalt(II) sites have long been identified in cobaltsubstituted enzymes such as carboxypeptidase and carbonate dehydratase. The theory required for the interpretation of EPR spectra from tetrahedral cobalt ions is in principle similar to that for chromium(III) in near octahedral surroundings. For cobalt(II) in a tetrahedral crystal field an orbital singlet is the lowest state with S = ~. In axial symmetry, the spin Hamiltonian consists of the electron Zeeman interaction and ~FS. Zero-field splitting produces two Kramers doublets (separated by 2D), which are further split by a magnetic field B. The g factors are found to 20 y . Sugiura, J. Kuwahara, T. Nagasawa, and H. Yamada, J. Am. Chem. Soc. 109, 5848 , (1987). 21 j. R. Pilbrow, in "BI2" (D. Dolphin, ed.), Vol. 1, p. 431. Wiley (Interscience), New York, 1982. 22 L. Banci, A. Bencini, C. Benelli, D. Gatteschi, and C. Zanchini, Struct. Bond. (Berlin) 52, 37 (1982). 23 R. Bicknell, G. R. Hanson, B. Holmquist, and C. Little, Biochemistry 25, 4219 (1986).
340
PROBES OF METAL ION ENVIRONMENTS
[1 1]
be a little larger than 2, the deviation from 2 arising from the effect of spin-orbit interaction and the low-symmetry ligand field. When the electron Zeeman interaction is very much larger than the zero-field splitting, the system can still be described as spin a. z On the other hand, when the microwave energy is small compared with the zero-field splitting, then each doublet must be considered as having its own spin of ½ and has effective g factors that can be very anisotropic, ranging from about 10 to less than I. Little hyperfine structure is ever observed for distorted tetrahedral cobalt(II), in contrast to octahedral high-spin cobalt(II). The latter situation is what occurs for cobalt(II) replacing zinc in carboxypeptidase and carbonated hydratase. Typical doublet splittings are usually less than 13 cm-l. 24-26The effective g factors from these are not easily distinguishable from those of octahedrally coordinated high-spin cobalt(II) ions referred to previously but are characterized by relatively small hyperfine splittings, when observed, and in this respect are distinguishable from the other case. The resonances are observed only at temperatures near that of liquid helium, and relaxation to the upper doublet causes loss of the signal at about 15 K. Marked differences are found in the EPR spectra on binding of substrates and inhibitors. 27 dS: High-Spin Nickel(II). There are a number of proteins known to contain nickel including urease, nickel hydrogenases, and carbon-monoxide dehydrogenase. The ground state is an orbital singlet with 3-fold spin degeneracy, which is removed by the ligand field and leads to large zerofield splittings. Consequently, nickel(II) is ordinarily EPR silent. However, oxidation or reduction of the nickel(II) ion produces nickel in the oxidation states of +3 and + 1, respectively, producing S = ½ ground states. Use of 61Ni (I = a) has shown that the EPR signals arising from the hydrogenases and carbon-monoxide dehydrogenase structure contain nickel. 33S isotope substitution has shown the presence of sulfur ligands in the coordination sphere of the nickel ion. d9: Copper(lI). Copper(II) is the archetypical example for transition metal ion EPR. In crystals, spectra show a characteristic four-line hyperfine structure since I = ~. There are two isotopes, 63Cu and 65Cu, that have slightly different magnetic moments, and this means that for naturally abundant copper, the spectra from the two isotopes overlap. Characteristic 24 M. B. Yim, L. C. Kuo, and M. W. Makinen, J. Magn. Reson. 46, 247 (1982). 25 L. C. Kuo and M. W. Makinen, J. Am. Chem. Soc. 107, 5255 (1985). 26 M. W. Makinen, L. C. Kuo, M. B. Yim, G. B. Wells, J. M. Fukuyama, and J. E. Kim, J. Am. Chem. Soc. 107~ 5245 (1985). 27 R. A. Martinelli, G. R. Hanson, J. S. Thompson, B. Holmquist, J. R. Pilbrow, D. S. Auld, and B. L. Vallee, Biochemistry 28, 2251 (1989).
[11]
ELECTRONPARAMAGNETICRESONANCE
341
but generally poorly resolved spectra are observed for frozen solutions of copper enzymes. There are a great many copper-containing proteins and enzymes, which are generally grouped into three main classes according to EPR characteristics rather than function. Type I copper(II) is recognized by an intense blue color correlated by the absorption spectrum in the 600 nm region. It has an extinction coefficient about 100 times that commonly encountered in simple copper(II) chelates. The type 1 sites are now understood to be distorted four-coordinate, "tetrahedral-like." Although the g factors appear normal, with gll > g± > 2, the resolved parallel hyperfine splitting, All, has an unusually small value, namely, less than 0.01 cm-1. 28 Type 2 copper(II) possesses visible absorption and EPR spectral properties compatible with those of simple copper(II) amino acid and peptide chelates and is an essential constituent of the multicentered copper(II) proteins. It has been argued that the designation, type 2, should be reserved for cases where type 1 copper(II) is also present. Typical g factors are gLI ~" 2.2 and g . ~ 2 . 0 2 . 29 Type 3 copper centers are thought to consist of pairs of copper(II) ions in close proximity that are strongly antiferromagnetically coupled. Examples include so-called type 3 copper found in the multicopper oxidases and the nondetectable coppers in hemocyanin. Solomon e t al. 3° have reviewed this field extensively with particular emphasis on the hemocyanins. Both ceruloplasmin sl and hemocyanin show evidence for dipolar coupled pairs of copper(II) ions after treatment with nitric oxide. The dipolar interaction produces a zero-field splitting of the triplet state and separates the singlet state from the "center of gravity" of the triplet state, For copper(II) ion pairs, the dipolar splittings are approximately 0.1 cmwhen the internuclear distance r is about 0.3 nm and approximately 0.01 cm -~ when r is around 0.7 nm. This may be compared with the magnitudes of the typical electron Zeeman interaction at 10 GHz and g = 2 of approximately 0.3 cm -~ and the typical copper nuclear hyperfine interaction of approximately 0.015 cm -~. Poorly resolved lines for the allowed and forbidden transitions (sometimes called half-field lines) usually occur when exchange coupling is weak. Studies of cases in which two metal ions share a common ligand include copper(II)-copper(II) pairs following migration of copper(II) ions to the vacant zinc binding site of bovine erythrocyte 28 K. W. Penfield, R. R. Gay, R. S. Himmelwright, N. C. Eickman, V. A. Norris, H. C. Freeman, and E. I. Solomon, J. Am. Chem. Soc. 103, 4382 (1981). 29 j. A. Fee, Struct. Bond. (Berlin) 23, 1 (1975). 30 E. I. Solomon, K. W. Penfield, and D. E. Wilcox, Struct. Bond. (Berlin) 53, 1 (1983). 31 F. R. Van Leeuwen, R. Wever, and B. F. van Gelder, Biochim. Biophys. Acta 315, 200 (1973).
342
PROBES OF METAL ION ENVIRONMENTS
[11]
superoxide dismutase 32 and the binuclear copper active site of mollusc and arthropod hemocyanin or Neurospora tyrosinase. 33,34
Magnetically Coupled Systems In general there are two types of magnetic interactions between metal centers, namely, dipole-dipole coupling and superexchange coupling. The former interaction is a through-space interaction and varies as the inverse cube of the distance between the magnetic centers. The observation of dipole-dipole coupling in xanthine oxidase has allowed the relative disposition of the redox centers to be determined and provides direct evidence of an intramolecular electron transfer chain. 35 A model of the subunit of xanthine oxidase showing the relative disposition of the redox centers determined from magnetic interaction measurements is given in Scheme I.
Mo lI~3_A. [2Fe-(2S] (I) . .14. . --4 . . . . [2Fe7-2S] (II)
o".,'~,,
16-+4A
/
%% %
•
/
16-+ 4"~
•
"FAD • SCHEME I
Superexchange can be further classified into antiferromagnetic and ferromagnetic coupling and involves the overlap of molecular orbitals on each metal center with a bridging ligand. The isotropic exchange coupling constant J (negative for antiferromagnetic coupling) is a measure of the extent to which the electrons are coupled and can be determined in favorable circumstances with variable-temperature EPR spectroscopy. When multiple centers become paramagnetic the coupling is via spin-spin coupling and is inferred from splittings, half-field transitions, and loss of microwave power saturation. A detailed analysis of magnetic interactions and the determination of J couplings is provided in the book entitled EPR of Exchange Coupled Systems by Bencini and Gatteschi. 36 32 j. S. Valentine, M. W. Pantoliano, P. J. McDonnell, A. R. Burger, and S. J. Lippard, Proc. Natl. Acad. Sci. U.S.A. 76, 4245 (1979). 33 R. S. Himmelwright, N. C. Eichman, C. D. LuBien, and E. I. Solomon, J. Am. Chem. Soc. 102, 5378 (1980). 34 R. S. Himmelwright, N. C. Eichman, C. D. LuBien, K. Lurch, and E. I. Solomon, J. Am. Chem. Soc. 102, 7339 (1980). 35 M. J. Barber, J. C. Salerno, and L. M. Siegel, Biochemistry 21, 1648 (1982). 36 A. Bencini and D. Gatteschi, " E P R of Exchange Coupled Systems." Springer-Verlag, Berlin, 1990.
[11]
ELECTRONPARAMAGNETICRESONANCE
343
The most common examples in which these interactions occur are the iron-sulfur-containing metalloproteins, and, consequently, we concentrate on these. However, there are many other examples of exchange coupling of metal centers in metalloproteins, for example, the binuclear iron oxo-proteins of which hemerythrin and uteroferrin are good examples, the type 3 copper centers, the molybdenum-iron cofactor in nitrogenase, and the nickel-iron-sulfur clusters in hydrogenase. A large number of ferredoxins have been purified to homogeneity and have been characterized with a wide range of spectroscopic techniques, 37-39 including EPR spectroscopy. To date the following types of iron-sulfur clusters have been identified: [Fe-Cys4] ~-,2- (S = ~, 2); [2Fe-2S] 2+'1+ (S = 0, ½); [3Fe-4S] 1+'° (S = ½, 2); and [4Fe-4S] 3+'2+;z÷'1+ (S = ½, 0, ½). In clusters with more than a single iron atom, there are two or more tz-sulfido bridges with cysteine completing the tetrahedral coordination geometry about the iron atoms. Histidine, aspartic acid, or serine may also provide the terminal ligating atoms rather than cysteine. An example of this is where one histidine coordinates to each iron in the [2Fe-2S] cluster in the Rieske center. 4° The facile interconversion of [3Fe-4S] I+'° and [4Fe-4S] 3+,2+;2+'1+ has also been demonstrated by EPR spectroscopy. Proteins containing these clusters have been shown to be involved not only in electron transfer, but also in catalyzing biochemical reactions of, for example, aconitase41 and lactoyl-CoA dehydratase. 42 Representative spectra from the paramagnetic spin states are shown in Fig. 3. Spectra of the [Fe-Cys4] ~- sites in rubredoxins consist of resonances around g = 4.3, typical of highspin iron(Ill) in a tetrahedral environment where the resonance occurs within the middle paramagnetic doublet state (see Fig. 2). Antiferromagnetic coupling between the iron(II) (S] = 2) and iron(Ill) ($2 = ~) ions in the [2Fe-2S] ~+ cluster yields the following spin states, ST = 1S1 + s21,1sl+s2 II, . . . , Is -s l,=½, 2, ~, -z, ' and ~, the lowest state being S = ½. For the [2Fe-2S] 1+ clusters, the energy of first excited state (~J > 200 cm -1, for the plant proteins) is sufficiently large that thermal population of the excited spin states does not complicate the EPR spectrum. For these systems, g factors ranging from approximately -
37 R. Cammack, D. S. Patil, and V. M. Fernadez, Biochem. Soc. Trans. 13, 572 (1985). 38 H. Beinert, Biochem. Soc. Trans. 13, 542 (1985). 39 R. Cammack, Adv. Inorg. Chem. 38, 281 (1992). 4o R. J. Gurbiel, C. J. Batie, M. Sivaraja, A. J. True, J. A. Fee, B. M. Hoffman, and D. P. Ballou, Biochemistry 28, 4861 (1989). 4l H. Beinert and M. C. Kennedy, Eur. J. Biochem. 11t6, 5 (1989). 42 R. D. Kuchta, G. R. Hanson, B. Holmquist, and R. H. Abeles, Biochemistry 25, 7301 (1986).
344
PROBES OF METAL ION ENVIRONMENTS 2.2 1
g factor 2.0 1.9
2.1 I
1
1
r
l
I
[1 1]
1.8 1
I
I
(a) 2 [4Fe-4S] I+
\ (b) [3Fe-4S] ~+
-
~
-
[4Fe-4S]l+
(d) [4Fe-4S] 3÷
2Fe-2S]l +
I
0.30
a
J
0.32
I
J
0.34
I
i
0.36
I
a
0.38
B(T) FIG. 3. Representative EPR spectra for iron-sulfur clusters in ferredoxins. (a) CIostridium pasteurianum; (b) Desulfooibrio gigas; (c) Bacillus stearothermophilus; (d) Chromatium oinosum high potential iron-sulfur protein (HIPIP); and (e) Mastigocladus laminosus. All spectra were recorded at X-band frequencies at temperatures between 10 and 20 K. (Adapted from Ref. 37, with permission.)
1.8 to 2.2 are found. The reader is referred to the article by Bertini e t ai. 43 for a description of the antiferromagnetic coupling in the more
complex [3Fe-4S] 1÷'° and [4Fe-4S] 3+'2+;2+'1+ clusters. There have been reports of a new [6Fe-6S] 6+'5+;5+'4+'4+'3+ cluster in 43 I. Bertini, F. Briganti, and C. Luchinat, lnorg. Chim. Acta 175, 9 (1990), and references therein.
[11]
ELECTRONPARAMAGNETICRESONANCE
345
ferredoxins purified from Desulfovibrio vulgaris 44 strain Hildenborough and Desulfovibrio desulfuricans 45 (ATCC, Rockville MD, strain 27774). The fully oxidized protein (+6 state) appears to be diamagnetic. In the +5 state the cluster exists in two magnetic forms: 10% is low-spin S = ½, and the remainder is in a high-spin S = g spin state. A one-electron reduction yields a g ~ 16 resonance, presumably from an S = 4 spin state. Further reduction to the +3 state yields a mixture of two S = 1 ground states. EPR spectra of the iron-sulfur clusters are observed only at temperatures below about 50 K because of rapid spin-lattice relaxation at higher temperatures. In addition, higher spin multiplets will be populated at higher temperatures. At low temperatures the signal strength is proportional to 1/T, as may be inferred from Eq. (7) for isolated paramagnetic doublets. In proteins with more than one cluster, resolution of the signals from each cluster often requires variation of the temperature, microwave power, and redox potential. Experimental
Instrumental Factors To observe EPR the sample is placed in a resonant microwave cavity in an electromagnet and irradiated with microwaves. EPR has traditionally been carried out by fixing the microwave frequency, usually X-band or 9-10 GHz, and by varying the magnetic field. Historically, the second major frequency used in EPR was 35 GHz (Q-band) as it was traditionally believed it would always provide greater g factor resolution. However, at Q-band microwave frequencies the spectral line widths are frequently larger than those observed at X-band frequencies. The line width variation as a function of microwave frequency has been interpreted in terms of a statistical distribution of spin Hamiltonian parameters. 46'47 A correlated g and A strain 48-5° model provides a simplified picture of the line width variation as a function of the nuclear spin quantum number and the micro44 A. J. Pierik, W. R. Hagen, W. R. Dunham, and R. H. Sands, Eur. J. Biochem. 206, 705 (1992). 45 I. Moura, P. Tavares, J. J. G. Moura, N. Ravi, B. H. Huynh, M.-Y. Liu, and J. LeGall, J. Biol. Chem. 267, 4489 (1992). 4~ W. R. Hagen, D. O. Hearshen, R. H. Sands, and W. R. Dunham, J. Magn. Reson. 61, 220 (1985). 47 W. R. Hagen, D. O. Hearshen, R. H. Sands, and W. R. Dunham, J. Magn. Reson. 61, 233 (1985). 48 W. Froncisz and J. S. Hyde, J. Chem. Phys. 73, 3123 (1980). 49 j. R. Pilbrow, J. Magn. Reson. 58, 186 (1984). 50 j. S. Hyde and W. Froncisz, Annu. Rev. Biophys. Bioeng. 11, 391 (1982).
346
PROBES OF METAL ION ENVIRONMENTS
[11]
wave frequency for S = ½ and I > 0 systems. In a simple form of the theory, the important equation describing the anisotropic line width o-i, ( i = x , y , z ) is z ori2 = O'Ri2 + [Agi/g i ~,o(n) + AAiMI]2
(14)
The O-Riterm represents residual line widths arising from dipolar broadening and/or unresolved metal and ligand hyperfine interactions, whereas A g / g and AA terms represent the half-widths of the strain-induced distributions of the g and A values. An important consequence of Eq. (14) is that increased resolution can be obtained at lower microwave frequencies. In particular, it is found that the best resolution for many type 2 copper proteins and inorganic compounds lies somewhere in the range 2-6 GHz. There are a number of experimental and instrumental aspects that can affect the line shape of an EPR spectrum. These include the choice of the modulation frequency and modulation amplitude, microwave power, quality factor of the cavity, sample temperature, and sample preparation. Although adequate descriptions of these effects have been provided in the books by Swartz et al. 3 and Pilbrow, 2 it is pertinent to provide a brief description of the optimum conditions for measuring EPR spectra. Normally a modulation frequency of 100 kHz is employed in EPR. However, when the line width of the paramagnetic resonance is very small, side bands can occur that can be eliminated by reducing the modulation frequency. Optimum resolution is obtained when the modulation amplitude is no larger than one-tenth of the line width. Unfortunately, for very weak spectra with poor signal-to-noise ratios higher modulation amplitudes must be employed to improve the signal-to-noise ratio. Clearly there is a trade-off between spectral resolution and the ability to detect the spectrum in the first instance. For most detectors the signal intensity is proportional to the square root of the microwave power (P). On increasing the microwave power the population difference between the two levels in a Kramers doublet decreases, causing a decrease in the signal amplitude. PI/2 is defined as being half the microwave power required to saturate an EPR resonance and is characteristic of the paramagnetic species. Under certain conditions P1/2 c a n be related to the spin-lattice relaxation time T1.24 The quality factor Q0, for a cavity, or other microwave resonator, is defined as the ratio of microwave energy stored over the amount energy dissipated and is directly proportional to the signal intensity. Typically for X-band rectangular cavities Q is of the order of 2000-5000. The predominant factor affecting the magnitude of Q is the introduction of dielectric materials into the cavity that can absorb the electric component ol" the microwave energy. Clearly, this presents a problem for measuring aqueous solutions, which have a significant microwave dielectric constant at room
[11]
ELECTRON PARAMAGNETIC RESONANCE
347
temperature. The use of "flat cells" or 1 mm sample tubes at X-band microwave frequencies reduces absorption of microwaves to an acceptable level, though Q will be reduced causing a decrease in the ultimate sensitivity. Dielectric loss is not a problem at low temperatures or at lower microwave frequencies. The factors governing the choice of temperature have already been mentioned.
Sample Preparation Sample preparation is not generally a problem for biological materials as aqueous solutions yield good glasses when frozen. Moreover, it is almost impossible to have protein concentrations greater than 2 mM where intermolecular dipole-dipole broadening can occur. Even at these high concentrations the diamagnetic protein backbone will prevent these magnetic interactions from occurring. It is important that samples be frozen outside the magnet because, in highly anisotropic systems, the electron magnetic moments can be partially aligned, leading to artifacts in the spectrum owing to unknown spatial distributions of the molecules. When dealing with frozen samples researchers should be aware that EPR tubes can explode as a result of ice expansion or trapped liquid oxygen. In our laboratories, samples are frozen gradually so that on thawing the sample the ice expands up the tube and not outward. Even with these precautions it is possible for tubes to explode, and in these cases it is necessary to plunge the tubes into boiling water for an instant to thaw the sample against the walls of the tube.
Rapid Freeze Quenching Rapid freeze quenching is a technique by which a reaction mixture can be frozen very quickly ( - 3 msec) and subsequently characterized by a range of spectroscopic techniques, including EPR spectroscopy. This technique has proved to be a very useful method for trapping enzyme-substrate intermediates. The basic instrumentation includes a stop-flow instrument equipped with an exit jet where the solution is sprayed onto the surface of an isopentane-liquid nitrogen slush bath. The frozen droplets are collected and packed into an EPR tube for subsequent study. This method has allowed various intermediates [very rapid, rapid type I, and rapid type II molybdenum(V) signals] to be characterized in the oxidation of xanthine to uric acid catalyzed by xanthine oxidase.
Isotope Substitution The observation of both metal and ligand hyperfine coupling can greatly aid the characterization of metal binding sites in metalloproteins. For
348
[1 1]
PROBES OF METAL ION ENVIRONMENTS
9.1125 GHz
I 3080
I
I
~
i 3180
I
I
r
r
I 3280
I
I
I
I 3380
I
I
I
I 3480
Gauss
FIG.4. Rapidtype 1 signalgeneratedfrom l-methylxanthinerecordedat 150 K, showing the signalfrom native xanthineoxidase. [Reproducedwith permissionof Dr. G. L. Wilson from Ph.D. Thesis, Latrobe University(1988).]
instance, the relative abundance of molybdenum isotopes with a nonzero nuclear spin (I = ~) is 25%, and consequently the intensity of the hyperfine lines is less than 10% of that for the I -- 0 isotopes (Fig. 4). 95Mo isotope enrichment (to -80%) provides greater sensitivity and resolution of the hyperfine resonances (Fig. 5a). Multifrequency EPR in conjunction with computer simulation studies (Fig. 5a-c) has identified a monoclinic molybdenum site for the rapid type I intermediate with the following g and A principal values: gl, 1.9890; g2, 1.9699; g3, 1.9647; Aj, 61,7; A2, 24.8; A 3 , 24.8 × 10 -4 cm-]; with the angle between the g] and A 3 directions, a]3, being 20°. The spectra in Fig. 5 also show coupling to two distinct deuterium (I = 1) exchangeable protons. The use of ]70, ]3C, and 338 isotopes in the characterization of molybdenum(V) intermediates and model complexes {[MoO2L]-, cis-[MoO(OH)L], [MoOSL]-, and cis-[MoO(SH)L], where L H 2 = N,N'-dimethyl-N,N'-bis(2-mercaptophenyl)ethylenediamine} for these sites has provided the structures and reactions (Scheme II) for the intermediates observed during the oxidation of xanthine to uric acid. Analysis of Electron Paramagnetic Resonance Spectra and Determination of Spin Hamiltonian Parameters An important step in the characterization of metal binding sites is the accurate determination of the anisotropic spin Hamiltonian parameters.
[11]
ELECTRON PARAMAGNETICRESONANCE
349
[Mo(IV)O(SH)(OR)] +
RH [Mo(VI)OS(RH)I
[Mo(Vl)OS]
-
e-
- e-,
[Mo(V)OS(OR)I Very Rapid
- RH
[MoO(SH)(OR)] Rapid
- ROH
/HH+
SCHEME II
Computer simulation of the anisotropic EPR spectra is a method of quantifying complex overlapping spectra. In addition, second-order hyperfine contributions, ligand hyperfine, quadrupole, nuclear Zeeman, and lowsymmetry effects add to the complexity of the spectrum. Simulation of the anisotropic EPR spectrum (S) measured as a function of magnetic field (B) and at a constant frequency (vc) is performed using Eq. (15)2: 2 ¢r/2 n'/2
I
S( c, ):cZZ Z Z Z i=1 O=O•=O M I = - I M N aib(M N) (gl2)f[vc - vo(B), o"u] A cos 0 A•
(15)
where the constants C and ai involve experimental parameters and the natural abundance of the metal ion isotopes which have a nonzero nuclear spin; for example, the two copper isotopes 63Cu and 64Cu have I = ~. The b(MN) terms are the binomial coefficients for magnetically equivalent nitrogens, namely, 1 : 3 : 6 : 7 : 6 : 3 : 1 for three equivalent nitrogens and 1 : 4 : 10 : 16 : 19 : 16 : 10 : 4 : 1 for four equivalent nitrogens. (gl 2) is the spatially averaged expression for the transition probability s~ needed in powder simulations, and f is the Gaussian line shape function. In the line shape function f, vo(B), multiplied by Planck's constant, is the actual energy difference between the energy levels and is evaluated by solving the eigenvalue problem with an appropriate spin Hamiltonian [Eq. (9)]. The fundamental reason for using Eq. (15) is given elsewhere. 2'49 The line width, o-~, as a function of the polar angles 0 and ~, required for randomly orientated (frozen solution) spectral simulations, is assumed to behave in an analogous manner to hyperfine structure. Correlated g and A strain in frequency space is used to calculate the actual line width (o i, i = x, y, z) as a function of vo(B) and the nuclear spin quantum number M I [Eq. (14)]. 51 j. R. Pilbrow, Mol. Phys. 16, 307 (1969).
O
_-.._
....
%-
....
.
,, !,
"
~, ;i
I
I
,,
T
,!;I
V! ,
II•
,
It
fI t
li/'
Ii ~!
i ~, ,'
i;
it
I|
|Il
~/
V v 1i II I
_. . . . . .
-, ~ ,"
'"'
If I
I
I
I
3080
I
I
f
I
3t 80
I
I
1
3280
b
I
I
~*--~.f%__~l
lt iIiiiI '~ It I Ill ~, I.i 1l, iiI
~
FADH"
1090
I
,
,
,
3480
^
~----
I
,
eHz
. . . . . ~ j-~--
'[
,
1190
I
I, l l ~I
I I If
i
I I I I I I , I / I,
'
,,II
,
I
3.5910
II
i
I
3380
IIL
-- . . ., ~. ' ~. .
,
I~l
I
,
1290
,
,
,
1390
1490
C 2.3139
....
~/
~"
~" "I ", ',' "" " "" ,,II * ,,II ,,' ',I i
,
If I~i
FADH-
/ /
II II II I|
I i i I
l
II
'!
.~' . \ .... . . . -
GHz
.......
ii II
, 630
,
,
i
l 730
,
,
i
I
I 830 Causs
~
,
i
,
I 930
,
t
,
i 1030
[11]
ELECTRON PARAMAGNETICRESONANCE
351
Further details concerning the use of computer simulation in the analysis of anisotropic and isotropic EPR spectra may be found in a book by one of the authors. 2 The International EPR Society has established a database of existing computer simulation programs, a copy of which may be obtained from Professor R. Cammack. 52 Spin Quantitation Spin concentrations may be determined by either the "absolute" or "comparison" methods. The accuracy to which the spin concentration measurement can be made is governed by a number of experimental parameters and a knowledge of the transition probability. A comprehensive discussion of the factors effecting the spin concentration measurements has been published. 53'54 By far the most commonly used technique is the comparison method, which is described below. The comparison method relies on a comparison of the EPR signal intensity of an unknown compound I(Exp), with that of a reference compound I(Exp)r. Providing the resonant cavity is critically coupled and identical sample geometries, via the filling factor ('0) and the loaded quality factor (QoL), are employed, the number of spins in an unknown sample (Nou) can be related to the number of spins in a reference sample (Nor) through . Uoo =
c;lvijl 2
I(Exp)u ×
(16)
where C,=
T S(S + 1) RG MA p1/Z
52 Department of Biomolecular Sciences, King's College, Hill Road, Camden, London W8 7AH, UK. E-mail address:
[email protected]. 53 S. S. Eaton and G. R. Eaton, Bull. Magn. Reson. 1, 130 (1979). 54 M. L. Randolph in "Biological Applications in Electron Spin Resonance" (H. M. Swartz, J. R. Bolton, D. C. Borg, eds.), p. 119. Wiley (Interscience), New York, 1972.
FIG. 5. Experimental ( ) EPR spectra and simulations ( - - - ) of the l-methylxanthine rapid type I signal from 9SMo-enriched xanthine oxidase (95Mo, 70-80 atom %) in IH20 buffer, 150 K, recorded at (a) 9.113 GHz, (b) 3.591 GHz, and (c) 2.3139 GHz. Arrows indicate the resonance position of the F A D H ' radical. [Reproduced with permission of Dr. G. L. Wilson from Ph.D. Thesis, Latrobe University (1988).]
352
PROBES OF M E T A L ION E N V I R O N M E N T S
[11]
The subscripts u and r refer to the unknown and reference samples, respectively, and I V,TI2 is the transition matrix element squared and is proportional to the product of the anisotropic transition probability (g2) and I(ils+_lJ>l 2. c ' is a normalization constant involving the instrument settings: receiver gain (RG), modulation amplitude (MA), microwave power (P), temperature (T), and the electron spin (S), assuming the sample obeys the Curie law. Because the double integral of a computer-simulated spectrum is directly proportional to the anisotropic transition probability 2 [Eq. (15)], we can replace I v,jI 2 in Eq. (16) with the double integral of the computersimulated spectrum. Thus, the number of spins in an unknown sample (N0u) can be related to the number of spins in a reference sample (Nor):
I(Exp)u N0u = Nor C,ui(Sim)u
×
C~I(Sim)r l(ExP)r
(17)
where I(Exp) and I(Sim) are the doubly integrated experimental and simulated spectra. It is very important to have identical sample geometries (7/) and Q0L factors for both the standard and unknown samples when determining spin concentrations using the comparison method. One way of ensuring this is to combine both the standard and the unknown samples in a single EPR tube and measure their signals. However, more often than not, the EPR signals overlap, and this creates difficulties in the determination of the intensity of each component. This may be overcome by either successive sample replacement in a single cavity or by the use of a double cavity. Obtaining identical sample geometries ('0) and Q0L factors with the successive sample replacement method is quite difficult and can lead to large errors in the determination of spin concentrations. By far, the preferred method is that of the double cavity (normally a dual TEio4 rectangular cavity is employed). One important point which should be noted when using a dual cavity is that the individual cavities may have different modulation amplitude calibrations and microwave magnetic field strengths (B~). The former is simply solved by calibrating each cavity, whereas the latter can be overcome by first measuring the standard and unknown samples in the front and back cavities and then swapping the samples and repeating the measurement. Thus, the equation for determining the spin concentrations becomes
r
_i(Exp)ul _
Nou = Nor /LC'~lI(Sim)~l ×
Crli(Slm)r 1 ,• i(Exp)u2 C~21(Sim)r2]1/2 × × i(ExP)rl C,u2i(Sim)u2 I(EXP)r2 J, (18)
[12]
EPR SPECTROSCOPYOF IRON
353
where the subscripts 1 and 2 refer to the front and back cavities, respectively. An important consequence of this method is that the EPR spectrum of the standard sample should be well understood. The use of solid copper(II) sulfate is not recommended as there are dipole-dipole interactions between the copper(II) ions in addition to the interactions described in Eq. (9), and the quality factor of the cavity will be different from that of aqueous frozen solution samples. A good choice is the copper(II) complex with ethylenediaminetetraacetic acid (EDTA). Conclusions EPR spectroscopy as a technique for characterizing metal binding sites in metalloproteins has proved invaluable. The theory presented here for the analysis of the spin Hamiltonian parameters and the method of spin quantitation should provide the reader with an introduction to the use of EPR spectroscopy in metalloprotein research. However, the reader is strongly advised to read the relevant literature in order to gain a full understanding of the technique. In short, the future looks bright for EPR in the characterization of metal binding sites in metalloproteins.
[12] E l e c t r o n P a r a m a g n e t i c R e s o n a n c e S p e c t r o s c o p y of Iron Complexes and Iron-Containing Proteins
By RICHARD CAMMACK and CrtRISTOPHER E. COOPER Introduction Among the transition metal ions in biochemistry, iron has the richest variety of electron paramagnetic resonance (EPR) spectra. These include spectra of low-spin and high-spin ferric iron and of metal clusters. This chapter concentrates on practical aspects of the detection, identification, and quantitation of iron-containing proteins in biochemical systems, including enzymes, other proteins, and whole tissues. The reader is referred to previous articles in this series on the general principles of EPR by Palmer ~ and on transition metal EPR by Fee 2 and Pilbrow and Hanson. 3 A number of preparative methods have been de1 G. P a l m e r , this s e r i e s , Vol. 10, p. 594. 2 j . A. F e e , t h i s s e r i e s , Vol. 49, p. 512. 3 j . R. P i l b r o w a n d G. R. H a n s o n , this v o l u m e [11].
METHODS 1N ENZYMOLOGY, VOL. 227
Copyright © 1993 by Academic Press, Inc. All fights of reproduction in any form reserved.
354
PROBES OF METAL ION ENVIRONMENTS
[12]
scribed by Ballou 4 (rapid-freezing), Beinert et al. 5 (low-temperature spectroscopy), Beinert 6 (mitoch0ndrial electron transfer proteins), Dutton 7 (redox potentiometry), and Cammack 8 (cyanobacterial iron-sulfur proteins). Other helpful reviews of the EPR technique include those on general instrumental methods by Eaton and Eaton, 9 on EPR of biological systems by Sealy et al. 1° and Kosman and Bereman, 11 and on iron proteins by Smith and Pilbrow.12 The theory of the EPR of transition ions has been reviewed in a book by Pilbrow. t3 The principle of EPR spectroscopy is similar to that of nuclear magnetic resonance (NMR), but using electrons instead of nuclear spins. The unpaired electrons lead to paramagnetism in the sample. The differences between the two techniques are mainly due to the much larger magnetic moment of the electron, compared with the proton. The conventional EPR spectrometer employs a microwave cavity, in which the sample sits, that resonates at a fixed microwave frequency, v. This allows a considerable enhancement of the microwave field, and hence sensitivity, but prevents the acquisition of a spectrum in the conventional way by measuring absorption as a function of frequency. Instead, the applied magnetic field, B o, is swept, by means of an electromagnet. The energy (AE) at which resonant absorption by an unpaired electron occurs is AE=
hv = g~aBo
where the proportionality constants h and/-~B are Planck's constant and the Bohr magneton for the electron, respectively. Thus the resonance magnetic field (Bo) is inversely related to the g factor, a spectroscopic 4 D. P. Ballou, this series, Vol. 54, p. 85. 5 H. Beinert, W. H. Orme-Johnson, and G. Palmer, this series, Vol. 54, p. l 11. 6 H. Beinert, this series, Vol. 54, p. 133. 7 p. L. Dutton, this series, Vol. 54, p. 411. s R. Cammack, this series, Vol. 167, p. 427. 9 G. R. Eaton and S. S. Eaton, in "Analytical Instrumentation Handbook" (G. W. Ewing, ed.), p. 467. Dekker, New York, 1990. l0 R. C. Scaly, J. S. Hyde, and W. E. Antholine, in "Modern Physical Methods in Biochemistry, Part A " (A. Neuberger and L. L. M. V. Deneen, eds.), p. 69. Elsevier, Amsterdam, 1985. 11 D. Kosman and R. Bereman, in "Spectroscopy in Biochemistry" (J. E. Bell, ed.), p. 57. CRC Press, Boca Raton, Florida, 1981. t2 T. D. Smith and J. R. Pilbrow, in "Biological Magnetic Resonance" (L. J. Berliner and J. Reuben, eds.), p. 85. Plenum, New York, 1980. z3 j. R. Pilbrow, "Transition Ion Electron Paramagnetic Resonance." Oxford Univ. Press, Oxford, 1990.
[12]
E P R SPECTROSCOPY OF IRON
355
parameter that is characteristic of the paramagnetic iron complex studied. The g factor is easily calculated by rearranging the above equation: g - 71.4484v _ _ B0
where B 0 is in millitesla (mT) and v is in gigahertz (GHz). The characteristic appearance of the EPR spectrum derives partly from the technical necessity for sweeping the magnetic field rather than the microwave frequency; this has consequences for the simulation and integration of EPR spectra. It has the effect of making the high-field (low g factor) features appear broad compared with those at low field. Moreover, in order to improve sensitivity, the EPR spectrum is acquired by modulation of the applied magnetic field B 0 and phase-sensitive detection. As a result the spectrum is obtained as the first derivative or first harmonic. For iron proteins, low temperatures (liquid nitrogen or liquid helium) are normally required to observe an EPR spectrum. Characteristics of Electron Paramagnetic Resonance Spectra To observe resonant absorption in EPR, there must be two energy levels differing in energy by by, and the transitions between the levels must be allowed. A combination of different electrostatic and magnetic interactions between electrons and nuclear spins gives the EPR spectra of iron their characteristic shapes. The major contributions to the splittings between the energy levels available to the unpaired electron are as follows (Fig. 1).
Spin-Orbit Coupling. Spin-orbit coupling interactions with the electrons of other orbitals of the iron atom and its ligands (fine structure) cause the effective g factor to differ from the free-electron value of 2.0032. Zeeman Interaction. Magnetic interactions with the applied field (Zeeman interaction) normally gives rise to the EPR phenomenon. Electrons aligned with the applied magnetic field have a lower energy than those aligned against it; microwave quanta are of the right energy to stimulate transitions from one state to the other. Zero-Field Splitting. If there is more than one unpaired electron in the ion, as in high-spin Fe m, electrostatic interactions between the unpaired electrons give rise to zero-field splittings. Thus, even in the absence of an applied magnetic field there are differences in energy between the unpaired electrons. The magnitude of the zero-field splittings is often so great that the energy levels are split by more than the energy of a microwave quantum, so as to prevent resonance being observed. Fortunately,
356
PROBES OF METAL ION ENVIRONMENTS
[12]
MS
+s/2
/
L
iI iI / iI iI
4D
iI iI
~ "- ±3/2
Increasing Bo field
Zero-field splitting
Zeeman interaction
Hyperfme splitting
FIG. 1. Illustrations of the effects of splittings of the energy levels of unpaired electrons in high-spin Fem. The diagram is not to scale; the hyperfine interactions are much smaller (of the order of 10 MHz) compared with the Zeeman splitting (9 GHz at X-band) and the zero-field splittings (D = 300 GHz for metmyoglobin).
for any paramagnetic state with an odd number of unpaired electrons an EPR spectrum is always in principle detectable. 13 This is not necessarily the case if there is an even number of unpaired electrons. Hyperfine Interaction. Magnetic interactions with nuclear spins give rise to the hyperfine interaction. In general, interaction with a nuclear spin I will cause a splitting into (21 + 1) lines. Thus, two lines should be observed for the iron isotope 57Fe, which has a nuclear spin I = ½. Superhyperfine Interaction. Magnetic interactions with ligands to the iron that have nuclear spins also cause splittings (sometimes called super-
[12]
EPR SPECTROSCOPYOF IRON
357
hyperfine interactions); the most important is 14N (I = 1) which splits the EPR spectra into three lines. In this case the ligand can be identified by substituting with one containing ~SN (I -- ½), when only two lines will be observed. The hyperfine interactions are often so weak that they are less than the line width of the spectrum, which prevents their detection by conventional continuous wave EPR. They may, however, be detected by electron nuclear double resonance (ENDOR) spectroscopy or by electron spin echo envelope modulation (ESEEM) in pulsed EPR. Dipole-Dipole and Exchange Interactions. Interactions with other unpaired electrons in the protein over distances of the order of 5-15 ,~ result in changes in the line shape of the spectrum owing to dipole-dipole and exchange interactions. At closer distances ( 1 the spectrum may be spread over a wide range of B 0 field (see below).
Chemistry of Iron in Relation to Magnetic Properties Iron occurs in at least three oxidation states in biology, FeII (ferrous) with the d 6 electron configuration, d 5 Fem (ferric), and d 4 Fe TM (ferryl). Of these, only Fe xIIhas an odd number of unpaired electrons, which means that it has degenerate electron levels which can be split by a magnetic field and are readily detectable by EPR. The other valence states may be magnetic, but it often happens that the energy level splittings are greater in magnitude than the energy of the microwave quantum, hu, and the spectra are undetectable. The spin state of the iron ions has a great influence on the EPR spectra (Fig. 2). The d electrons, each have a spin S -- ½, are distributed among five orbitals. Because of electrostatic repulsion there will be a tendency for them to occupy different orbitals. If they do, the ion is said to be in the high-spin state. Thus, for Fe m, the five electrons would each occupy a different orbital, giving a net spin S = ~. For FeII, two of the six electrons pair up, giving a net spin S -- 2. However, interactions with the ligand field causes the d energy levels to be separated. If the ligand field is strong enough, the electrons will prefer to pair up in the levels of lowest energy.
358
[12]
PROBES OF METAL ION ENVIRONMENTS
Octahedralcoordination
Tetrahedralcoordination A
,dl& k"
X
i
y
x
High spin []
Fe
II
Fe
es
Total spin, S = T5 Weak ligand field
Hi.gh spin
Low spin
eg
HI
H
Fe
Fe
1
0
F~ u Fff
~g
"TA
2
2
±
2
2
Strong ligand field
FI~. 2. d electron energy levels and electron distributions for iron in octahedral and tetrahedral coordination.
This is the low-spin case. Low-spin Fe Itl and FeII have total spins S = ½ and S = 0, respectively. An intermediate spin state, S -- 3, is possible but rare. The magnitude of the ligand-field splitting A, which determines the spin state, depends on the types of ligands and their geometry. Iron in a tetrahedral coordination is always high spin. In octahedral coordination, which approximates the situation in heme proteins, iron may be either high spin or low spin, depending on the nature of the axial ligands. Spin state interconversions depending on substitution of the axial ligand are common, as in cytochrome P-450, which changes from low spin in the substrate-free form to high spin in the substrate-bound form. 14 It is even possible for the iron to change its spin state (from high to low) on cooling from room temperature to liquid helium temperature; this change, for example, in hemoglobin, may be observed by optical spectroscopy as well as by magnetic susceptibility measurements. 15 14 S. Sligar, Biochemistry15, 5399 (1976). 15 T. Iizuka and M. Kotani, Ado. Biophys. 1, 157 (1970).
[12]
E P R SPECTROSCOPY OF IRON
359
For high-spin Fe nI, the five unpaired d electrons couple together to give three doublets, with S = -½, ___a, ___~. The extent to which these electron energy levels are populated depends on the zero-field splittings between the levels and on the temperature (see below).
Information Obtained from Electron Paramagnetic Resonance Spectroscopy
Identification of Iron as Responsible for Spectra The identification of an EPR spectrum of an unknown paramagnet as arising from an iron compound is assisted by enrichment with the isotope 57Fe (I = ½; natural abundance 2.2%). Unlike radioactive labeling, a high proportion of the isotope must be introduced. The techniques to do this are the same as used in M6ssbauer spectroscopy. In a protein it may be done by removal of iron and reconstitution with the iron isotope, or, if that is not possible, by growing the organism on a growth medium containing the isotope. If the spectrum is narrow, substitution with 57Fe may cause a significant hyperfine broadening, as observed in the ferredoxins 16 and in the nickel-iron cluster of carbon-monoxide oxidoreductase.17 The magnitude of the splitting depends on the extent of the spin polarization onto the iron nucleus, that is, the extent to which the nucleus " s e e s " the unpaired electron. If the spectrum is broad, the hyperfine interactions may instead be observed by ENDOR. 18The number of iron nuclei associated with the paramagnetic center may be determined by simulation of the spectrum. In ENDOR, each distinct 57Fe interaction will give rise to a separate pair of lines, which can be distinguished.
Quantitation of Iron in Sample Unlike many forms of spectroscopy, such as optical spectroscopy, EPR spectra are usually readily quantifiable from first principles, that is, there is no extinction coefficient for an EPR spectrum. This makes it a very valuable tool in determining the stoichiometry of metal centers in 16 j. C. M. Tibris, R. L. Tsai, I. C. Gunsalus, W. H. Orme-Johnson, R. E. Hansen, and H. Beinert, Proc. Natl. Acad. Sci. U.S.A. 59, 959 (1968). 17 S. W. Ragsdale, H. G. Wood, and W. E. Antholine, Proc. Natl. Acad. Sci. U.S.A. 82, 6811 (1985). Is B. M. Hoffman, Accts. Chem. Res. 24, 164 (1991).
360
PROBES OF METAL ION ENVIRONMENTS
[12]
an enzyme, especially as, in contrast to atomic absorption, the method is selective for only those iron molecules contributing to the characteristic EPR signal of the protein.
Redox Potential of Iron Center A method of estimating the midpoint potentials of membrane proteins, by poising in the presence of mediators and measuring the EPR spectra, has been described by Dutton. 7 This method is also effective for soluble iron proteins in complex systems or where the optical spectra are difficult to detect. Usually if the iron protein is detectable in one oxidation state, for example, Fe nl, the other state is undetectable under the same EPR conditions. Thus, the EPR signal disappears or appears on reduction of the sample. This method can also be used to resolve overlapping EPR spectra of centers that have different redox potentials (see, e.g., Refs. 19 and 20).
Coordination State~Nature of Iron Ligands The EPR spectrum is a function of the electron distribution and geometry of the paramagnetic molecule. Some of the terms used to describe the shape of anisotropic EPR spectra (cubic, axial, or rhombic) and the coordination geometry (octahedral, tetrahedral, square-planar) derive from studies of transition ions in inorganic crystals. 21In principle, information about coordination geometry and types of ligands (e.g., histidine) can be derived from the shape of the EPR spectra. 22 Unfortunately, because of the distortions from ideal symmetry that occur in proteins, it is not possible to give a rigorous description of the g factors in terms of ligand field theory. However, theory can give useful insights when comparing, for example, the spectra of various types of low-spin ferric hemes.23 Electron Paramagnetic Resonance Properties of Different Types of Iron
Low-Spin Iron(Ill) For low-spin hemoproteins such as most respiratory cytochromes and substrate-free cytochrome P-450, the ligand field is strong enough to make i9 R. A. Rothery and W. J. Ingledew, Biochem. J. 261, 437 (1989). 2o S. W. Meinhardt, R. B. Gennis, and T. Ohnishi, Biochim. Biophys. Acta 975, 175 (1987). 21 A. Abragam and B. Bleaney, "Electron Paramagnetic Resonance of Transition Ions." Oxford Univ. Press, Oxford, 1970. 22 R. Calvo, J. Magn. Reson. 26, 445 (1977). 23 W. D. Biumberg and J. Peisach, in "BioInorganic Chemistry" (R. Dessy, J. Willard, and L. Taylor, eds.), p. 271. American Chemical Society, Washington, D.C., 1971.
[12]
EPR SPECTROSCOPYOF IRON
361
the iron low spin. In this case the g factors lie between 4 and 0. The reasons for these rather large excursions from the " t r u e " g factor of 2.0 for an S = ½ system are outside the scope of this chapter but have been explained in an accessible way by Palmer. 24 The anisotropy of the spectrum, given by the spread of g factors, varies considerably between proteins. The cytochromes P-450 have relatively small anisotropy (rhombicity), with g factors typically between 2.5 and 1.7. By contrast some btype cytochromes have highly anisotropic spectra (maximum rhombicity), with highest g factors approaching 4.0. The shape of the low-field line is sharply cut off near g = 4 and has been aptly described as a "folded line shape". 25 In that case the other g factors are usually so low as to be undetectable. Blumberg and Peisach 23 pioneered a method of plotting the EPR spectroscopic parameters of low-spin ferric hemoproteins, representing the rhombicity versus tetragonal (or axial) field, derived from the g factors. The position of the protein in the diagram was related to the nature of the axial ligands to the iron. Such diagrams are a useful indication of coordination of the iron site. However, such diagnoses require further confirmation since variations in g factors may also be the result of steric hindrance of the ligands. 26
High-Spin Iron(III) As stated previously the zero-field splitting in high-spin Fe uI (S = ~) significantly affects the g factor observed. The zero-field splitting may be described in terms of two parameters: D, the axial splitting, and E, the rhombic splitting. The coordinate axes for these terms may be chosen so that the ratio ~ = E/D can take values between 0 and ~. The case where h = 0 corresponds to an axially symmetric ligand field; the case where h = ~ corresponds to the state of maximum rhombicity (i.e., the least symmetrical). For a given spin state the expected g factors may be calculated as a function of h (Fig. 3). From the diagrams in Fig. 3 a number of properties are apparent, for example, that the maximum expected g factor is equal to 4S (10 in this case). For the case of axial symmetry there are prominent EPR features at gx = gy = 6 and gz = 2, arising from the S = ---½ doublets. An example is metmyoglobin (Fig. 4a). Where there is a small degree of rhombicity, the g factors gx and gy become split around 6, as in catalase (see Fig. 10) and the siroheme-containing nitrite reductase (Fig. 4b). As h increases, the spectrum broadens out, as in desulforedoxin (Fig. 24 G. Palmer, Biochem. Soc. £rans. 13, 548 (1985). 25 j. Salerno, Biochem. Soc. Trans. 13, 611 (1985). 26 F, A. Walker, D. Reis, and V. L. Balke, J. Am. Chem. Soc. 106, 6888 (1984).
362
PROBES OF METAL ION ENVIRONMENTS 10
[12] 9.68
8 6
1+5/2> 4 2 I
0
I
0.86 0.61
10
g factor
8
]+3/2>
6 4.29 4.29 4.29
0
~
I
I
10
9.68
8 6
I+_I12> 4
2
o86
0 / 0
a
=
0.11
0.22 X =
I 0.61 0.33
E/D
FIG. 3. Rhombogram for S = ~ (high-spin ferric iron). All possible g factors are represented by the three curves in each box. Each iron complex will have a specific value of ~; reading vertically up from this gives the value of the three principal g factors (gx, gy, and gz). The EPR spectrum of a randomly oriented frozen sample will therefore be distributed between the three g factors. Signals are possible from transitions not only in the lowest energy doublet (---½), but also in the higher doublets (_+~ and -+{). As the temperature increases the higher
[12]
EPR SPECTROSCOPYOF IRON
363
4c, h = 0.08), and may become progressively more difficult to detect. As the extreme rhombic case, h = ~, is approached, narrower signals appear at g = 4.29, arising from the S = ___adoublets, as in rubredoxin (Fig. 4d) and transferrin (Fig. 10). This is associated with a much weaker feature near g = 9.7, arising from the S = +--½doublet. ~The g = 4.3 lines are frequently sharp and intense, as all possible orientations of the iron protein (gx, gy, and gz) contribute to the signal. The majority of nonheme Fe tlI proteins are high spin. Their spectra commonly show high rhombicity, with g ~ 4.3. Some, such as lipoxygena s e , 27 a r e axial, and there are rare examples such as nitrile hydratase 28 that have low-spin Fem.
Ferrous-Nitrosyl Complexes As already stated, it is not usually possible to observe EPR signals from Fe n owing to large zero-field splittings in the high-spin state, and the absence of unpaired electrons in the low-spin state (although see Hendrich and Debrunner z9 for exceptions). However, it is possible to render such iron sites (both in heme and nonheme iron proteins) EPRdetectable by the addition of nitrogen monoxide (nitric oxide, NO) as a ligand. Because NO contains an unpaired electron, the resulting nitrosyl complex is usually an odd-electron system. EPR spectra of the complexes often show splittings into three lines owing to the 14N (I = 1) nucleus of the NO; the use of 15NO (I = ½) results in two lines and confirms that the splitting observed is due to nitrogen from the NO. To generate nitrosyl complexes the addition of nitrite and a reducing agent such as ascorbate (or dithionite) is usually sufficient. 3° The direct addition of NO to proteins under anaerobic conditions, while sometimes 27 S. Slappendel, G. A. Veldink, J. F. G. Vliegenthart, R. Aasa, and B. G. MalmstrOm, Biochim. Biophys. Acta 667, 77 (1981). 28 y . Sogiura, J. Kuwahara, T. Nagasawa, and H. Yamada, J. Am. Chem. Soc. 1119, 5848 (1987). 29 M. P. Hendrich and P. G. Debrunner, Biophys. J. 56, 489 (1989). 3o T. Yonetani, H. Yamamoto, J. E. Erman, J. S. Leigh, Jr., and G. H. Reed, J. Biol. Chem. 247, 2247 (1972).
doublets will become more populated and their signal sizes will increase. Any doublet that has any of its three g factors equal to 0 will not contribute to the EPR spectrum, as the line width will be infinite and therefore the intensity zero (e.g., no lines will be seen from -+3 and +_~)when h = 0). [Reproduced with permission from W. R. Hagen, Adv. Inorg. Chem. 38, 165 (1992).]
364
PROBES OF METAL ION ENVIRONMENTS
[12]
g factor 10 8 6 if i i i
5
4 [
3
2 i
"-v
i
i
i
i
i
i
i
50
100
150
200
250
300
350
i
400
Magnetic field, mT
FIG. 4. EPR spectra of high-spin ferric iron proteins. (a) Metmyoglobin; (b) Cucurbita pepo nitrite reductase; (c) Desulfooibrio gigas desulforedoxin; (d) D. gigas rubredoxin. Conditions of measurement: temperature 12 K, microwave power 20 mW, frequency 9.2 GHz, modulation amplitude 1 mT, modulation frequency 100 kHz.
[12]
EPR SPECTROSCOPYOF IRON
365
necessary, must be done carefully as NO is a highly reactive ligand and can displace other intrinsic ligands to the iron. 31 A signal that often appears in cell extracts or in enzyme preparations treated with nitrite (Fig. 5a) is the axial signal around g = 2.03, which is due to nitrosyl iron-sulfur complexes of the type Fe(RS)2(NO) 2. This signal is prominent because of its narrow width, and it can be detected even at room temperature. In some cases the NO is of biogenic origin. Another signal that may cause confusion is the spectrum of NO itself, which appears with a g factor just less than 2, detectable at helium temperat u r e s . 32
NO complexes o f h e m e iron (S -- ½) are usually centered around g -- 2, and their line shapes are often complicated by the presence of more than one species, as in the R-state of hemoglobin (Fig. 5b). If a three-line spectrum occurs around g = 2.00, this is often an indication that the ligand opposite the NO is either weakly bound or absent, as in T-state hemoglobin (Fig. 5c). This triplet spectrum is sometimes an indication of denatured protein. On the other hand, further triplet splitting of each of the three lines, giving nine lines in all, is a strong indication that the proximal ligand from the protein is a histidine (Fig. 5d). These nitrosyl iron complexes just described are derived from lowspin Fe H and thus have S = ½. However, there are some complexes that are derived from high-spin Fe n and have S = 3. These have broader spectra with gx ~ gy ~ 4, gz = 2. An example is nitrosyl lipoxygenase. 33 Another commonly encountered complex of this type is nitrosyl ferrous EDTA. This has a sharp axial spectrum with g = 4.0 and 2.0.
Coupled Spin Systems Iron-Sulfur Clusters. The iron-sulfur proteins that have been known for many years comprise clusters of iron and sulfide, coordinated directly to the protein by cysteine sulfur ligands. 6'8'34 These cysteine-ligated proteins generally yield one of two different types of EPR spectra. The first is a signal in the reduced state with average g factors around 1.96, as in [2Fe-2S) + or [4Fe-4S] + clusters of ferredoxins (Fig. 6a). The second occurs in the oxidized state around g = 2.01-2.04, as in [3Fe-4S] ÷ clusters or in the [4Fe-4S] 3÷ clusters of high-potential iron-sulfur proteins. The 31 R. H. Morse and S. I. Chan, J. Biol. Chem. 255, 7876 (1980). 32 T. H. Stevens, G. W. Brudvig, D. F. Bocian, and S. I. Chan, Proc. Natl. Acad. Sci. U.S.A. 76, 3320 (1979). 33 M. J. Nelson, J. Biol. Chem. 262, 12137 0987). 34 W. R. Hagen, Adv. lnorg. Chem. 38, 165 (1992).
366
[12]
PROBES OF METAL ION ENVIRONMENTS g factor 2.05
2
1.95
% b
I
I
I
I
I
305
315
325
335
345
Magnetic field, mT FIG. 5. EPR spectra of nitrosyl iron complexes. (a) Nitrosyi iron-sulfur complex; (b) R-state hemoglobin; (c) T-state hemoglobin (in the presence of inositol hexaphosphate); (d) nitrosyl HMP (E. coli hemoglobin-like protein). Conditions of measurement: (a-c) temperature 74 K, microwave power, 10 mW, frequency 9.2 GHz, modulation amplitude 0.3 mT, modulation frequency 100 kHz; (d) as for (a-c) except temperature 34 K, microwave power 2 roW, modulation amplitude 0.2 mT.
[12]
E P R SPECTROSCOPY OF IRON
367
Mixed-valence 2Fe clusters g factor 2.2
1.6
1.8
2
I
a Parsley ferredoxin
b Benzene dioxygenase
ygenase
I
t
I
I
I
I
[
290
310
330
350
370
390
410
Magnetic field, mT FIG. 6. EPR spectra of mixed-valence binuclear iron complexes. (a) Reduced [2Fe-2S] ferredoxin from parsley; (b) reduced"Rieske-type" [2Fe-2S] cluster in benzene dioxygenase of Pseudomonas putida; (c) methane monooxygenase of Methylococcus capsulatus (Bath); note that the latter spectrum has an additional signal from a free radical at g = 2.00. Temperature of measurement was 30 K for (a) and (b), 10 K for (c); other conditions of measurement were as follows: microwave power 20 mW, frequency 9.2 GHz, modulation amplitude 10 mT, modulation frequency 100 kHz.
368
PROBES OF METAL ION ENVIRONMENTS
[12]
Rieske-type [2Fe-2S] clusters, which have S and N coordination from cysteine and histidine ligands, 35 are recognizable by their characteristic g factors, around g = 2.01, 1.90, and 1.80, in the reduced state (Fig. 6b). It is now known that there is greater variation in the structures of iron-sulfur clusters and that different types of iron-sulfur clusters can give a range of other EPR signals. For example, some reduced [4Fe-4S] clusters have odd-electron ground states with higher spins such as 6, z, and ~-, or are mixtures of such states. These have g factors up to 10, 14, or 18, respectively. 34 To detect the EPR signal from an unknown iron-sulfur protein, it is necessary to search over a wide range of magnetic field, and in different redox states. Iron-sulfur clusters usually have very efficient electron-spin relaxation mechanisms 36 and are typically detected at temperatures below that of liquid nitrogen. Exceptions are the rubredoxins and some of the reduced [2Fe-2S] ferredoxins (e.g., adrenal ferredoxin), which can be detected at temperatures near ambient, if sufficiently concentrated samples (>0.1 mM) are used. The reduced [3Fe-4S] clusters have even-spin states, probably S = 2, which in some cases are detectable as a broad line around g = 12. 37
Binuclear Oxygen-Bridged Iron Centers. In addition to the/x-sulfidobridged iron-sulfur clusters, there are proteins which contain /z-oxobridged iron dimers. These include the invertebrate oxygen carrier hemerythrin, the iron-containing methane monooxygenase, and purple acid phosphatase. Like the [2Fe-2S] ferredoxins these clusters are antiferromagnetically coupled, giving even-spin or zero-spin ground states for the fully reduced and fully oxidized proteins. The mixedvalence F e I I - F e m states are paramagnetic, with S = ½, like the [2Fe-2S] clusters. They may be distinguished from the iron-sulfur clusters in that they have all their g factors less than 2.038 (Fig. 6c). Moreover, they can readily be reduced to the FelI-Fe n state, and so the characteristic of their redox properties is that their signals appear as they are reduced, then disappear again on further reduction. In some cases, such as ribonucleotide reductase, the F e n - F e In state is relatively unstable and difficult to detect. 35 j. A. Fee, K. L. Findling, T. Yoshida, R. Hille, G. E. Tarr, D. O. Hearshen, W. R. Dunham, E. P. Day, T. A. Kent, and E. Miinck, J. Biol. Chem. 259, 124 (1984). 36 j..p. Gayda, P. Bertrand, A. Deville, G. More, J. F. Gibson, and R. Cammack, Biochim. Biophys. Acta 581, 15 (1979). 37 W. R. Hagen, W. R. Dunham, M. K. Johnson, and J. A. Fee, Biochim. Biophys. Acta 828, 369 (1985). 3s j. Sanders-Loehr, in "Iron Carriers and Iron Proteins" (T. M. Loehr, ed.), p. 373. VCH, Weinheim, 1989.
[12]
EPR SPECTROSCOPYOF IRON
369
An unexpected recent finding has been that the diferrous states of reduced binuclear iron complexes in deoxyhemerythrin azide, 39 methane monooxygenase,4° and ribonucleotide reductase 4~ all give intense EPR spectra at g ~ 16, detected at 4.2 K. The spectra are particularly pronounced when recorded in parallel mode (see later). These spectra have been interpreted 39as being due to a weakly ferromagnetically coupled pair of Fe H ions. It is also possible to see spectra with high g factors from coupled binuclear Fe-Cu centers (S = 2) in cytochrome o x i d a s e . 29'42,43 Polynuclear Iron. The presence of large numbers of ferric iron atoms can give rise to very broad (> 1,800 mT) EPR spectra that are both difficult to detect and difficult to quantify. Examples include the iron storage proteins ferritin and hemosiderin, 44 which can contain as many as 4000 iron atoms per molecule. These spectra contain both ferromagnetic (anisotropic) and superparamagnetic (isotropic) contributions arising from uncompensated spins in the iron core; it is necessary to understand the magnetic properties of the core as a whole to explain them. A somewhat simpler signal, isotropic around g -- 2, is observed from the superparamagnetic core iron in bacterioferritin molecules, although the line width is still very large. 45
Practical Considerations
Spectrometers Standard EPR spectrometers operate at X-band microwave frequency ( - 9 GHz). Microwave bridges are also commercially available to operate at microwave frequencies of S-band ( - 4 GHz) and Q-band (-35 GHz). The effect of these different frequencies is to alter the relative strengths of the effects of g factors and zero-field splittings (which scale with frequency) and hyperfine and electron spin-spin splittings (which are relatively insensitive to frequency). In general, lower frequencies are useful in resolving hyperfine interactions and higher frequencies in resolving g 39 M. P. Hcndrich, L. L. Pearce, L. Que,Jr., N. D. Chasteen, and E. P.Day~ J. Am. Chem. Soc. 113, 3039 (1991). 4o M. P. Hendrich, E. P. Munck, B. G. Fox, and J. D. Lipscomb, J. Am. Chem. Soc. 112, 5861 (1990). 41 j. B. Lynch, C. Juarez-Garcia, E. Munck, and L. Que, J. Biol. Chem. 264, 8091 (1989). 42 W. R. Hagen, Biochim. Biophys. Acta 708, 82 (1982). 43 C. E. Cooper and J. C. Salerno, J. Biol. Chem. 267, 280 (1992). 44 M. Weir, T. J. Peters, and J. F. Gibson, Biochim. Biophys. Acta 828, 298 0985). 45 M. R. Cheesman, F. H. A. Kadir, J. A1-Basseet, F. A1-Massad, J. Farrar, C. Greenwood, A. J. Thomson, and G. R. Moore, Biochem. J. 286, 361 (1992).
370
PROBES OF METAL ION ENVIRONMENTS
[12]
factors. At higher frequencies, the sensitivity should in principle increase with the Boltzmann factor, which increases the proportion of electrons that undergo resonant absorption. However, at the same time the size of the cavity and hence the sample size decrease. Tuning of Q-band resonators is also more difficult. Hence, unlike NMR, increased magnetic field does not generally lead to enhanced sensitivity. For lower frequencies the requirement for larger sample diameters has been overcome by the use of loop-gap resonators and other cavity designs with high filling factors. Conventional EPR spectrometers operate in such a way that the microwave field B~ applied to the sample in the cavity lies perpendicular to the static magnetic field B 0. For integer-spin paramagnets such as high-spin Fe n (S = 2), the EPR transition probabilities are often greatest when measured in parallel mode, BoI]B ~. Parallel-mode measurements require a special cavity, such as a bimodal cavity (see Hagen 4z) or alternatively a small cylindrical cavity which can be mounted on its side in the cryostat. Sample Preparation
The dielectric microwave loss of ice is much less than that of liquid water, so that relatively wide tubes can be used for low-temperature work. The tubes commonly used for X-band EPR spectroscopy have an internal diameter of approximately 3 mm and are about 150 mm long. The wider the bore, the greater the signal intensity, as the quantity of sample in the sensitive region of the cavity is roughly proportional to the square of the tube diameter. Tubes for Q-band spectroscopy have internal diameters about 1 ram. Tubes may be purchased ready-made or may be fabricated from high-purity quartz tubing of suitable size. Each batch of the tubing should be thoroughly cleaned and checked for spurious EPR signals. The bottom end of each tube is sealed off evenly without any bulges or thickening, and the top end is lightly flame-polished. For quantitative work the bore (internal diameter) of the tubes must be known since the volume measured is proportional to the square of the diameter. Precision bore quartz tubes are available from the Wilmad Glass Co. Alternatively, tubes can be calibrated in the laboratory and the EPR signals of different samples corrected for their internal diameter. Calibration can be done to an accuracy of about ---2% by filling the tubes with water to a known length and weighing the water. The diameter can then be marked on the tube with a diamond scriber. Samples can be injected into the sample tubes with microliter syringes fitted with long needles, which can also be used to stir the sample. Alternatively, small magnetic stirrers are commercially available. Freezing can be performed either slowly (in liquid nitrogen) or more rapidly in liquid
[12]
EPR SPECTROSCOPYOF IRON
371
methanol or isopentane, precooled in liquid nitrogen. In the absence of rapid freezing techniques, 4 the fastest time to add a reagent, stir, and freeze an EPR sample is of the order of 5 sec. One must be aware of possible artifacts arising from freezing; the most common of these is the pH change associated with the freezing of buffers, especially Tris, phosphate, and pyrophosphate. 46
Concentrations of Sample Required As mentioned previously different types of iron enzymes exhibit widely different EPR spectra. The ability to detect EPR spectra from an iron protein is therefore critically dependent on the nature of the spectrum. Figure 7 illustrates this by showing four spectra of different iron EPR signals, all at the same concentration (40/xM) from the same enzyme (the Escherichia coli flavohemoprotein iron reductase, HMp47'48). The EPR signal height is inversely proportional to the square of the line width. Therefore, the same concentration of iron will be more readily detected if the line width is narrow (e.g., the nitrosyl complex). Low-spin heme complexes are easy to detect if they have narrow line widths (the DTT complex), but hard if they are very broad (e.g., the cyanide complex). A broad signal can still be easily detectable if it contains a sharp component (e.g., the met-HMP complex). Both the sharpness of the signal and the increase in the EPR intensity with increasing g factor tend to make highspin heme easier to detect than an equivalent concentration of low-spin heme. In general high-spin and sharp low-spin signals are detectable down to levels of 1 /xM. At these concentrations, however, it is necessary to run the spectra of the EPR tubes prior to adding the sample, as contamination in the quartz can result in similar size signals, notably in the g = 4.3 region. Iron nitrosyl complexes and sharp F e - S clusters with narrow line spectra may be detectable at even lower concentrations. Of course, higher concentrations are also necessary to improve signal-to-noise ratios, to get accurate values for g factors, and to resolve detailed features of the spectrum. Broader low-spin centers and even-spin systems will require higher concentrations. Polynuclear iron centers with signals as broad as 2000 mT (e.g., ferritin, hemosiderin) will require the highest attainable concentrations. 46 D. L. Williams-Smith, R. C. Bray, M. J. Barber, A. D. Tsopanakis, and S. P. Vincent, Biochern. J. 167, 593 (1977). 47 S. G. Vasudevan, W. L. Armarego, D. C. Shaw, P. E. Lilley, N. E. Dixon, and R. K. Poole, Mol. Gen. Genet. 226, 49 (1991). 48 N. Ioannidis, C. E. Cooper, and R. K. Poole, Biochem. J. 288, 649 (1992).
372
[12]
PROBES OF METAL ION ENVIRONMENTS
7.0 6.0
Met
5.0
4.0
~
3.5
3.0
I
I
g factor 2.5
2.00
I
1.75
I
I
~
Cyanide
Nitrosyl
I
I
I
I
i
I
I
I
50
100
150
200
250
300
350
400
M a g n e t i c Field (roT)
FIG. 7. Sensitivity of different iron protein complexes to detection by EPR. Bacterial hemoglobin (HMP) protein samples were prepared as follows: Met, protein used as purified; cyanide, protein + 5 mM sodium cyanide; DTT, protein + 5 mM dithiothreitol; nitrosyl, protein + 5 mM sodium nitrite followed by 5 mM sodium dithionite. All samples were 40 p.M heme b. EPR conditions: temperature 30 K, microwave power 20 mW, microwave frequency 9.36 GHz, modulation frequency 100 KHz, modulation amplitude 1 roT, receiver gain 1 × 10⁵, time constant 0.33 sec, sweep time 2.4 mT/sec. Spectra displayed are average of two scans.
Oxidation and Reduction For oxidoreductases, substrates may be used as oxidants or reductants. Alternatively, potassium ferricyanide, K 3 F e ( C N ) 6 , is often useful as a general-purpose nonspecific oxidant, and sodium dithionite, Na2S204, as a reductant. Ferricyanide has a broad EPR signal around g = 3 that interferes with the spectra of some iron complexes. An alternative oxidant is ammonium persulfate. With such strong oxidants it is important to check that oxidative damage to the protein has not occurred. Commercial sodium dithionite is about 80% pure (the contaminants are mostly sodium sulfite and sodium carbonate). If greater purity is required it can be recrys49 C. E. McKenna, W. G. Gutheil, and W. Song, Biochim. Biophys. Acta 1075, 109 (1991).
[12]
EPR SPECTROSCOPYOF IRON
373
Argon
\
\ p
Quart2
Millivolts
Stirrer Electrodes
Calomel,,," Platinum
FIG. 8. Apparatus for preparation of EPR samples under an argon atmosphere. The apparatus is constructed of glass. Connections to the glass manifold are sealed with epoxy or very short lengths of butyl rubber tubing. To minimize drying of samples, the gases are bubbled through water. The miniature magnetic stirrer is of the type used for oxygen electrodes. Long syringe needles are used to purge with gas the vessels in the side arms and the EPR tube prior to filling. The needles are inserted into the apparatus through short, close-fitting lengths of wider bore tubing which pierce the septum stoppers. The outflow of argon gas through the tubes minimizes the entry of air into the apparatus.
tallized. 49 R e d u c t a n t s s u c h as d i t h i o n i t e r e q u i r e o x y g e n - f r e e c o n d i t i o n s (see B e i n e r t et al.5); a r g o n gas c a n b e b l o w n o v e r the s u r f a c e of the s o l u t i o n in the t u b e , t h r o u g h a n o t h e r s y r i n g e n e e d l e . F i g u r e 8 s h o w s a s i m p l e a p p a r a t u s for p e r f o r m i n g E P R r e d o x t i t r a t i o n s o n a n i r o n c e n t e r . T h i s m e t h o d o l o g y has b e e n f o u n d to be suitable for m a n y
374
PROBES O F M E T A L I O N E N V I R O N M E N T S
[12]
types of manipulations of oxygen-sensitive samples and for adjustments of redox potentials. It does not require vacuum conditions and relies on a steady flow of oxygen-free, water-saturated gas to exclude oxygen. Argon gas from the cylinder is usually of sufficient purity. The gas regulator is of the low-leakage type with a metal diaphragm, and the gas is passed through glass and metal tubing. We use narrow-bore stainless steel tubing with compression fittings. Solutions in the apparatus are freed of oxygen by either bubbling with the gas or blowing gas over the surface. Equilibration between the gas and liquid phases is slow but is assisted by vigorous stirring with small magnetic followers. The vessel for adjusting redox potentials shown has a maximum volume of 2-10 ml and is designed for a small minimum sample volume, so all the solution is usable. The potential is measured with a small platinum disk electrode (3 mm diameter), fused into the base of the cell, and a calomel reference electrode glued into the cell with epoxy. A mixture of mediators is used in the solution, as described by Dutton. 7 Solutions of oxidants such as ferricyanide or reductants such as dithionite are made up in the side vessels. Solutions are transferred into the vessel and between the various side arms, using Hamilton gas-tight syringes with fixed needles, 25 cm long. Because the tip of the syringe is always in the gas space, leakage of oxygen is avoided. The sample is transferred in the same way to the EPR tube and frozen with a freezing bath of i sopentane or methanol, cooled with liquid nitrogen. For addition of reductant or oxidant, trial and error is needed to find the concentration required and time of reduction. Typical conditions for reduction of an electron transfer protein would be reduction with 5 mM dithionite solution for 2 min befor freezing. If reduction is very slow it may be assisted by the addition of a mediator such as methyl viologen. When using dithionite and methyl viologen, one must also be aware of the possibility of observing spurious free radical (g = 2.0) signals from sulfur radicals or methyl viologen radical cation.
Conditions for Running Spectra The effects of varying the different instrumental parameters, such as the microwave power, magnetic field modulation amplitude, scan speed, filter time constants, and instrumental gain, on the EPR spectrum have been described by Palmer 1 and by Fee. 2 There is compromise to be made between maximum sensitivity (signal-to-noise ratio) and resolution of the spectrum. Because the samples are usually frozen it is always possible to enhance the signal-to-noise ratio by repetitive scanning and signal averaging. This is straightforward with the computer systems on modern spectrometers. By ~making n scans the signal-to-noise ratio is enhanced by
[12]
EPR SPECTROSCOPYOF IRON
375
n 1/2. In practice a limitation to sensitivity is commonly set by the presence
of contaminant metal ions which contribute spurious signals. The contamination may be in the cavity (in which case it will not vary with sample temperature), in the cryostat, or in the sample itself (in which case its signals may increase or decrease at lower temperature, depending on the type of paramagnetic impurities). Signals arising from the cavity or glassware may be subtracted out of the sample spectrum with the aid of the computer, if another spectrum is taken, under identical conditions, of a sample containing only water.
Temperature The electrons excited by the microwave field lose energy to their surroundings by a process of spin-lattice relaxation. This returns them to the ground state and allows a continuous steady-state absorption of microwaves to be observed. The relaxation process is characterized by a relaxation time, T1 which is analogous to the same effect in NMR spectroscopy. In many iron complexes, T1 is usually extremely rapid at room temperature, causing extreme broadening of the EPR lines. This is why in order to see EPR from iron proteins it is usually necessary to cool the sample to cryogenic temperatures, sometimes down to the boiling point of liquid helium (4.2 K). Moreover, lower temperatures give increased signal size owing to the increased Boltzmann factor. However, if the temperature is too low, the spin-lattice relaxation becomes inefficient and the signal size decreases at high microwave power as the number of electrons in the ground and excited states becomes equal; this phenomenon is termed microwave power saturation. Studies of the microwave power saturation characteristics of an EPR signal can yield information about the environment of the unpaired electron; for example, if another unpaired electron is nearby (50 K, for example) are plotted as X (M/H) against inverse temperature (l/T) and fitted to a straight line for each of the magnetic fields (H). The intercepts found from the straight-line fit will be independent of H if there are no ferromagnetic impurities present. When ferromagnetic impurities are present, it is important to work at high magnetic fields (>0.15 T) to saturate the impurities and to avoid the hysteresis they contribute at low fields. It is also difficult to collect isotherm data (data collected at a fixed temperature over a wide field range) when ferromagnetic impurities are present. Data collected at low temperatures (0.15 T) can be used to study multifield saturation magnetism of metalloproteins in the presence of low levels of ferromagnetic impurities.
Multiinstrument Sample Holder It is important to characterize the metalloprotein sample directly using resonance techniques before studying its saturation magnetization. EPR, MCD, and M6ssbauer measurements are used to verify by measurement that the sample is in the appropriate redox state. These measurements are also used to quantitate both the levels of unwanted redox states and the levels of unwanted paramagnetic impurities. For Fe-containing proteins we collect MOssbauer spectra of the 57Fe-enriched sample after it has been prepared in the magnetization sample holder. For these experiments we use a plastic sample holder since the quartz holder is opaque to the y rays of the Mrssbauer spectrometer. Iron(II) impurities are routinely detected by M6ssbauer spectroscopy. EPR spectra are collected on parallel samples because we have not yet developed an EPR spectrometer which can accept the relatively large diameter (8 mm) sample holders used in the saturation magnetization measurement. EPR spectroscopy routinely detects Fe(III) and Mn(II) impurities. EPR spectra should be collected on all samples, including those which are not expected to show an EPR signal. In this way the absence of magnetic contamination can be shown by measurement. Optical measurements on parallel samples are used similarly to characterize the sample. The plastic holder used in experiments combining saturation magnetization and Mrssbauer spectroscopy is machined from a Delrin rod to form a bucket (8 mm outer diameter, 8 mm height, and mass of approximately
[16]
453
MULTIFIELD SATURATION MAGNETIZATION
130 mg) with a pair of holes near the top for the suspension thread. The plastic buckets are acid-etched overnight in 10% hydrofluoric acid to remove ferromagnetic impurities. The thread used to suspend the holder is lightly greased at each end before tying the knot through the holder hole in order to prevent sample moving up the threads by capillary action during loading. Because the holders exhibit a S = 1 signal (see Fig. 9), we routinely measure each empty holder and subtract this background magnetization from the filled sample or control to give holder-corrected data. The holder-corrected data is then subtracted to yield the holdercorrected difference data [(sample minus its holder) minus (control minus its holder)].
Fitting Software Input to the computer program used to fit the saturation magnetization data consists of a file containing the difference data to be fit and a file containing the input parameters.I° The input parameter file contains the initial values for the spin Hamiltonian parameters, upper and lower bounds on these parameters, and flags controlling the fitting process. The data can be modeled with a single paramagnetic species (one monomer), a single coupled site (one dimer), or any combination of these. The output data file contains the calculated saturation magnetization at each field and temperature of the input data in addition to the input data. The output parameter file contains the amount of each paramagnetic spin and its spin Hamiltonian parameters. This file also reports the intercepts at each field and the reduced X2 (XR2) of the fit. The parameters indicating the quality of fit (X2 and XR2) are defined as X 2 ~- ~ i = l , n
riE/ori 2
and
XR2 =
X2/(n -
nfree)
(6)
where n is the number of data points, ri is the ith residual between the data and the theory, o-i is the uncertainty of r;, and nfree is the number of free parameters used to fit the data. To calculate XR2, the fitting software must estimate the value of tr;. A least-squares fit of a quadratic curve to the first nine data points at a specified field is performed. The root mean square (RMS) value of the nine residuals is defined as the tr of the fifth data point. This process is repeated for data points two through ten to determine the uncertainty of the sixth data point. The process is continued until the uncertainty of each data point has been determined. The first four data points are assigned the uncertainty of the fifth, and a similar process is followed for the final four data points at each field.
454
PROBES OF METAL ION ENVIRONMENTS
[16]
This method of estimating the uncertainty in the data is based on the observation that scatter introduced by changing the temperature within the susceptometer dominates the noise. Repeated measurement once the temperature is set underestimates the uncertainty. The observed scatter measured on returning to a specified temperature after collecting data at other temperatures is essentially the same as found by the analysis described in the previous paragraph. Data Analysis Next we present the full details of the data analysis underlying the published magnetic properties of Pseudomonas stutzeri nitrous oxide reductase. Here we present the data analysis as a case study of the techniques involved in a multifield saturation magnetization study. The original paper should be consulted for the interpretation of these results in light of what is known about nitrous oxide reductase.~3 In the experiment that we discuss as a case study, the same amount of dissolved molecular oxygen was present in both the protein sample and its matched control. Saturation magnetization data were collected at four fields (5.5, 2.75, 1.375, and 0.2 T) over the temperature range from 2 to 200 K on both the sample (shown in the main plot of Fig. 6A) and its matched control (shown in Fig. 7A). These data sets were subtracted to give the raw difference data (shown in the inset of Fig. 6A). Next, the raw difference data were fit assuming the only spin present was that of the S -- ½ Cu(II) site of the protein seen by EPR. The fit assumed the g values measured by EPR. The result is shown in Fig. 6B. For these plots the data are presented as magnetization in SI microunits per sample plotted against/3H/kZ. With the fitting complete, the amount of S = ½paramagnetism is known from the fit. This amount of spin can then be used to calculate the magnetization per mole and the result presented in units of Bohr magnetons (as was done in Ref. 13). The quality of the fit shown in Fig. 6B (Xg2 = 2.8) could be improved somewhat by doing a two-spin fit assuming the second spin was S -- 1 molecular oxygen. The improved fit (XR2 = 1.7) uses three additional parameters (the amount of S = 1 and the zero-field splitting parameters D --- 4.5 cm -1 and E/D = 0 with g locked at g = 2). With the S = 1 component present, the amount of S = ½determined by the fit decreased from 415 to 394 nmol. The resulting 4% uncertainty in the amount o f S = ½ [405(15) nmol] is substantially less than the 14% uncertainty arising from ambiguities in the molecular weight of the protein discussed in Ref. 13. In earlier susceptibility studies of metalloproteins, data were collected on a diamagnetic reference state such as the apoprotein in order to subtract
. . . .
I ....
I
....
I
....
q ....
. . . .
I
I . . . .
I
o o
....
. . . .
\
"=2
I
'~
6
o
0 ~
0
0 0 0
0
m.
~
~
.
_~
(eldLues _L/Pd ) ~
,~
o
.~
~
_
.
~. ~ . ~ •
4~
-~
o~4..~
~
~
o
~
o~ ~
~
~
~
~,~ ,-
e,~
~
~_
o~.-
~
~',~ ~
~
~
~
~.~
--~ ~
~o
,, Dm~ ",
e-, :3
~
0
m
"0
< ~ ~ ~,..,...,.'-' c =
0
m
~
~~ ~._~ ~ . ~
T ~ ~- ~
o
o
o
~
L,d
. . . . .
m
• ,.,bS='=~
~:~
~
~ ,.
~
~
c~
. ~ o o ~
N
=
~
",.-
,=,,
~
0~[..,
0
_
~l ,..~ ~
~...-~
0..=
C)
0
Zn(II) >> Fe(II). Although the identity of the noncluster ligand(s) to M is
FIG. 5. (Left) Oxidative s c a n s (successive cycles) of a film of 7Fe-ferredoxin III on transfer to solutions containing M(II) ions. (Right) Corresponding semilog plots showing time c o r r e s p o n d e n c e of appearance of w a v e s D' and disappearance of w a v e s A ' . T h e potential was held briefly at approximately +50 m V prior to c o m m e n c e m e n t of scanning at 470 m V / s e c (temperature 0°). E a c h determination involved m e a s u r e m e n t of the difference in current at two potentials as indicated. T h e s e are as follows. Fe 2+ (300/xM): + , i-129 rnV -- i-229 mY, couple A ' ; &, i_393mV - i-250 my, couple D ' ; O, i_651 m v - i-554 mv, couple C ' . Zn 2+ (10 /.LM): + , L_129mv - i-229mV, couple A ' ; 0 , i_48,1mv - i_570mv, couple D ' ; O, i_655 mv - i_579mV, couple C ' . Cd 2+ (10 p.M): + , i_129mv - i_229mv, couple A ' ; II, i_64]rnv i-56s mv, combination of couples C ' and D ' . [Reprinted with permission from J. Am. Chem. Soc. 113, 6663 (1991). Copyright 1991 A m e r i c a n Chemical Society.]
496
PROBES OF METAL ION ENVIRONMENTS
[18]
yet to be established, this study has indicated the biological feasibility of F e - S clusters containing Zn. Investigating Coupled Chemical Reactions That Are R a p i d on Voltammetric Time Scale. If a redox-linked chemical reaction occurs on a time scale that is rapid compared to the voltammetric scan rate, it is not possible to separate the coupled process from the electron transfer. A simple case to consider is the rapid and reversible binding of a reagent to a center in either of two oxidation states. If the affinity for the reagent differs between oxidation states, then a single redox couple is observed with an E °' value that is dependent on the concentration of reagent. Because equilibrium is always established within the time scale of measurement, the result is similar to that which would be obtained by potentiometry. An example of such a system is given by the reaction of the 3Fe cluster of Fd III with a single thallium(l) ion.14 This reaction can be described by a thermodynamic cycle, in this case a " b o x " composed of reactions 1, 5, 8, and 4 of Scheme I. With TI(I) concentrations over the range 10-5 to 10-1 M, and employing scan rates up to 500 mV/sec, the waves arising from couple A' remain unchanged in shape or size as compared to the initially formed film, but the observed reduction potential shifts to a more positive value E°'obs. Equilibrium constants for reactions 4 and 5 are obtained by fitting data to Eq. (3): E°'obs =
E °' + (2.3 R T / F ) log{1 + [Q]/Kdred)/(1 + [Q]/Kd°X)}
(3)
in which Q represents the reagent that is binding to the cluster. A graph of E°'obs against log[Q] is sigmoidal with asymptotic limits at the E °' values for the two isolated couples, in this case reactions 1 and 8. The reduction potential for reaction 8 is now obtained from Eq. (4): E°'~s) = E°'~1) + (2.3 R T / F )
log(Kd°X/Kdred)
(4)
For TI(I) binding to the [3Fe-4S] cluster of Fd III, at an ionic strength of 0.5 M, such an analysis showed Kdred = 1.5 /xM, Kd°x = 34 mM, E °' = -177 mV, and E°'xl = +81 mV. The results demonstrate the point (to be illustrated further below) that even weak binding of reagents to an active site is detectable by the voltammetric method. On the basis of these data, a solution sample of oxidized Fd III (i. e., with [3Fe-4S] 1+) containing an appropriately high concentration of TI(I) was prepared for EPR spectroscopy. The resulting spectrum showed that the g = 2.01 signal characteristic of the species [3Fe-4S] 1+ had been replaced by a rhombic siknal, thus supporting the proposal that TI(I) interacts directly with the [3Fe-4S] core. The observation of near-ideal waveform even at quite high scan rates shows that entry and release of TI(I) are very rapid.
[18]
VOLTAMMETRY OF REDOX-ACTIVECENTERS
-l-o.1.A_ ~ ~ ~D' '-
a
lo., A
b
-
497
-
I
I
I
I
-800 -600 -400 -20o
E /mV vs. S.H.E.
FIG. 6. Adsorbed film voltammetry of (a) D. africanus 8Fe-FdlII, 10 mV/sec, 100/~M Fe(II). The film was transferred into a solution containing Fe(II) and 347 mM mercaptoethanol and scanned at (b) 10, (c) 200, and (d) 500 mV/sec. The coating solution was as described in Fig. 4. The electrolyte solution contained 2 mM neomycin, 0.2 M NaC1, buffered at pH 8, 0°. Redox couples are labeled according to the discussion in the text.
Extracting Kinetic Information. A f u r t h e r e x a m p l e illustrates h o w kinetic d a t a can be o b t a i n e d if rates o f the c o u p l e d p r o c e s s e s are c o m p a r a b l e to the v o l t a m m e t r i c scan rate. T h e case we h a v e c h o s e n again involves F d I I I , and w e c o n s i d e r the reversible binding o f a ligand, ethanol 2thiolate, to the t r a n s f o r m e d [ 4 F e - 4 S ] cluster in b o t h the 2 + and 1 + oxidation levels. 24 As a t h e r m o d y n a m i c cycle, the situation is that o f a b o x c o m p r i s i n g r e a c t i o n s 9, 13, 16, and 12 o f S c h e m e I. T o study this s y s t e m , a film o f the 7 F e - f e r r e d o x i n is first t r a n s f o r m e d into the 8Fe f o r m as d e s c r i b e d a b o v e , and the e l e c t r o d e is t h e n transferred to solutions containing v a r i o u s c o n c e n t r a t i o n s o f m e r c a p t o e t h a n o l o v e r the p H range 8 - 8 . 5 . Results are s h o w n in Fig. 6. U n d e r slow scan conditions (Fig. 6b), the 24j. N. Butt, A. Sucheta, F. A. Armstrong, J. Breton, A. J. Thomson, and E. C. Hatchikian, J. Am. Chem. Soc. 115, 1413 (1993).
498
PROBES OF METAL ION ENVIRONMENTS
[18]
single pair of waves composed of overlaying couples B' and D' splits into two, with one remaining at around -390 mV and the other shifting to a lower potential E°'obs, the value of which is dependent on the calculated concentration of thiolate anion. No changes are observed if a film of the original 7Fe-Fd III is scanned in the mercaptoethanol solution. It may therefore be deduced that it is the transformed [4Fe-4S] cluster (not the indigenous [4Fe-4S] cluster) which reacts with thiolate. The variation in observed E °' value with thiolate concentration is of the same form as Eq. (3). If the voltammetry is performed at a fast scan rate (in this case typically 500 mV/sec or higher), the position of the new couple becomes insensitive to thiolate concentration, whereas the oxidation wave is observed to be smaller than the reduction component. This occurs because the scan rate is now sufficiently fast to isolate the reversible redox couple (F') arising from the thiolate-ligated cluster, in this case reaction 16 of Scheme I. The distortion now observed on the low-potential side of the oxidation wave of couple B' arises because reoxidation of the remaining labile cluster population is made more favorable by rapid recombination of the product [4Fe-4S] 2+ with thiolate. Combining Eqs. (3) and (4), the equilibrium constants for reactions 12 and 13 can be determined. From these studies we were able to determine that binding of thiolate to the oxidized cluster [ K d ( L ) °x = 28/zM] is much stronger than binding to the reduced cluster [KarL)red = 97 mM]. This feature manifests itself clearly in the form of the significant negative shift in reduction potential from -396 mV (D') to -585 mV (F'). Interestingly, we found that we could not prepare a sample of the thiolate-ligated reduced cluster in solution for spectroscopic studies. This reflects the need for an intolerably high concentration of mercaptoethanol coupled with the requirement for a very low potential. As a voltammetric transient, however, the "virtual" existence of the thiolate-ligated reduced cluster is clearly demonstrated. With an intermediate scan rate, the kinetics of reactions 12 and 13 are revealed more closely. A third oxidation wave ( * , Fig 6c) is now clearly observed, the position and size of which vary with scan rate and thiolate concentration. As the thiolate concentration increases, this wave shifts to more negative potential but becomes smaller by comparison with oxidation wave F'. As the scan rate is increased, the wave becomes smaller and shifts to higher potential, merging with oxidative wave B'. Further analysis of the voltammetry is now approached by computer simulation. In this case an iterative program has been used, based on an effectively constant concentration of thiolate maintained at the electrode surface by the large buffering capacity of the rapidly established thiol/thiolate equilibrium.
118]
499
V O L T A M M E T ROF Y REDOX-ACTIVE CENTERS 0.35 (0.25 k..
L)
0.15
O0 (/)
0.05
CO CO C"
-0.05
E
-0.25
'O
-~.~" -~
...'" ./~N/
-0.15
-0.35 -450
I
-350
I
-250
I
I
- 150
/X,E
-50
I
I
50
150
250
/ mV
FIG. 7. Simulated voltammogram showing behavior typical for a box composed of reactions 9, 13, 16, and 12 in Scheme I in which L reacts reversibly with [4Fe-4S] 2÷ and [4Fe-4S] 1÷ at an intermediate scan rate. Simulation is for experiments shown in Fig. 6 but with a different ligand concentration and scan rate v = 100 mV/sec. " O n " rate constants are 3.2 x 10⁴ M -I sec -l for [4Fe-4S] 2÷ and 3.09 M -1 sec -1 for [4Fe-4S] l÷. " O f f " rate constants are 0.9 sec -1 for [4Fe-4S] 2÷ and 0.3 sec -l for [4Fe-4S] 1÷. The large on rate for the oxidized cluster gives rise to the wave marked with an * in Fig. 6c. Electrochemical rate constants for couples B', D', and F' are also varied to optimize the fit. The potential (AE) axis is referenced against the reduction potential of the transformed [4Fe-4S] couple (D') as measured in the absence of ligand. Values of the current are presented in dimensionless form {I/[n2F2oAF/(RT)]} (see Fig. 2 for meaning of terms). Component signals arising from couples B' (heavy dashed line), F ' (dotted line), and the highly distorted D' (light dashed line) reveal the nature of broadening observed for the total current (solid line) near the potential characteristic for the reduction peak F'.
The current at each value of applied potential is determined by applying the Butler-Volmer equation to each redox couple B', D', and F' and by considering the change in populations of clusters caused by ligand exchange. By generating simulated voltammograms based on varied rate constants for the processes involved, a best fit of kinetic constants can be found. Such rate constants (electrochemical as well as homogeneous) lead to the optimum reproduction of experimental traits (e.g., position and size of the waves) over the range of experimentally varied parameters such as reagent concentrations and scan rate. The result of one such simulation, displaying each component of the voltammogram, is shown in Fig. 7. It can be noted that coupled electron transfer reactions may
500
PROBES OF METAL ION ENVIRONMENTS
[18]
produce current contributions of sign contrary to simple expectation. For example, close inspection shows that one reaction yields a weak but noticeable reduction peak in the direction of increasing potential. From this particular set of experiments it was determined that the kinetic origin of the difference in affinities of [4Fe-4S] 2+ and [4Fe-4S] l+ clusters for thiolate (and hence also of the decrease in reduction potential in the presence of the ligand) lies in an approximately 104-fold increase in the rate of binding to the oxidized cluster. Concluding Remarks Although considerable effort may be required to establish conditions for obtaining a stable, electroactive film, the voltammetric approach can lead to the detection and clarification of chemistry that is not revealed by other methods. A wide spectrum of information on dynamic systems can be derived, ranging from a rapid "image" of the redox chemistry of centers in a protein to the determination of equilibrium and kinetic constants for coupled reactions. It permits an extensive exploration of reactivities with small amounts of material and is useful in the characterization of labile systems for which critical conditions must be met for preparation of spectroscopic samples. Acknowledgments We thank Dr. Edmond Bowden for communicatingresults prior to publication. This work has been supported by grants fromthe Exxon EducationFoundation,The Petroleum Research Fund administeredby the AmericanChemicalSociety,and the NationalScience Foundation (MCB-9118772).
[19]
ELECTROCHEMICAL STUDIES OF METALLOENZYMES
501
[19] D i r e c t a n d I n d i r e c t E l e c t r o c h e m i c a l I n v e s t i g a t i o n s of MetaUoenzymes
By H. ALLEN O. HILL and NICHOLAS I. HUNT Introduction It is now possible to investigate ~-4 virtually all redox metalloproteins by electrochemical methods. There is no difficulty in achieving the electrochemistry of small redox proteins such as cytochromes, ferredoxins, blue copper proteins, and flavodoxins. Direct electrochemistry proceeds without the need for an electron transfer shuttle, or mediator, between the redox center of the protein and the electrode. However, at most metal electrodes the presence of a promoter ~ is required. Such a compound binds to the electrode surface and, while not itself taking part in the electron transfer process, encourages electron transfer with the protein to proceed. Over the years, many promoters have been reported. 6'7 They are all hi- (or multi-) functional molecules of the type X - Y (Fig. 1): X is a substituent which allows binding to the metal electrode surface (e.g., a pyridyl, phosphine, sulfhydryl, or thioether); Y (e.g., a carboxyl or pyridyl group) interacts transiently with some part of the protein surface. The extension ( - ) should be such that it does not permit Y to bind to the electrode surface; it does not appear to matter6 whether it is aliphatic or aromatic in nature. There is some evidence 8'9 that really clean surfaces do not require promoters for the electrochemistry of some proteins to proceed. However, in most laboratory environments, traces of impurities are adsorbed at the electrode surface, and hence electron transfer of the protein or its ability to bind to the surface, or indeed both, is inhibited. i F. A. A r m s t r o n g , H. A. O. Hill, and N. J. Walton, Q. Rev. Biophys. 18, 261 (1986). 2 F. A. A r m s t r o n g , H. A. O. Hill, and N. J. Walton, Acc. Chem. Res. 21, 407 (1988). 3 F. A. A r m s t r o n g , Struet. Bonding (Berlin) 72, 137 (1990). 4 A. M. B o n d and H. A. O. Hill, Met. Ions Biol. Syst. 27, 431 (1991). 5 M. J. E d d o w e s and H. A. O. Hill, J. Chem. Soc., Chem. Commun., 771 (1977). 6 p. M. Allen, H. A. O. Hill, and N. J. Walton, J. Electroanal. Chem. 178, 69 (1984). 7 F. A. A r m s t r o n g , P. A. Cox, H. A. O. Hill, V. J. Lowe, and B. N. Oliver, J. Electroanal. Chem. 217, 331 (1987). 8 E. F. B o w d e n , F. M. Hawkridge, and H. N. Blount, J. Electroanal. Chem. 161, 355 (1984). 9 S..-C. Sun, D. E. Reed, J. K. Cullison, L. H. Rickard, and F. M. Hawkridge, Mikrochim. Acta 3, 97 (1988).
METHODS IN ENZYMOLOGY, VOL. 227
Copyright © 1993by AcademicPress, Inc. All rights of reproduction in any form reserved.
502
[19]
PROBES OF METAL ION ENVIRONMENTS
.s-~. /
"°°c~~s
HS__~~NH 2
/
Na2S .
/
/-ooo.
/ / /
/
/
/
/
/
. ~ - ~ ~)../-~
,
/ / /
$~COOH
,
sv
COOH
c~-a,0-c~ Lys-Gly-Cys
/ / /
FIG. 1. Structures and proposed surface conformations of surface modifiers for the promotion of protein electrochemistry.
[19]
ELECTROCHEMICAL STUDIES OF METALLOENZYMES
503
Techniques have been developed for elaborate modification of metal electrodes by multifunctional X - Y adsorbates to act as promoters: (1) If a di- or tripeptide is chosen to act as the promoter, normally with the sulfur of a cysteine as X, Y can be chosen so that a negatively charged group (as in a glutamate-containing peptide) or a positively charged group (as in a lysine-containing peptide) is present, the former "attracting" positively charged proteins, such as cytochrome c, and the latter negatively charged proteins, such as plastocyanin. (2) By choosing Y such that it can bind metal ions, for example, Mg 2+, Cr(NH3)63+, or even Pt(NH3)64+, negatively charged proteins such as plastocyanin, ferredoxin, or flavodoxin are encouraged to bind to the modified electrode surface long enough for electron transfer to occur. (3) Provided X is such that the molecule binds tightly to the electrode surface (e.g., a sulfhydryl or a phosphine), a monolayer of the promoter can be created, either by dipping the metal electrode in a solution of the promoter and then washing the electrode to remove unbound molecules or, for example, by electrochemically reducing a disulfide bond to induce binding to the metal electrode. With such a large selection of promoters, it is possible to achieve the electrochemistry of any small redox protein. None fail to give good electrochemistry, and results are often such that the half-wave potential corresponds to that assumed to be the thermodynamic potential of the protein. However, one must bear in mind that the experimental value reported is for the protein-promoter-electrode interaction; if this is significant, for example, when a metal ion is used as an ancillary promoter, then differences may be observed. Such redox potentials are not without interest: it may be that the redox potential of, for example, the complex l° of magnesium ions with plastocyanin, may provide a more meaningful description of the complex of the protein in the photosynthetic unit than the redox potential of the 'free' protein. It should be noted that the behavior of proteins at absolutely clean metal surfaces (a situation rarely encountered) is complex: transient short-lived electrochemistry may be observed in such systems. Irreversible adsorption on the metal surface with or without a marked change in potential frequently occurs. The purpose of promoters is to avoid such problems: the electrochemistry is well-behaved and reversible without the need to follow complex experimental procedures. Nonmetal electrodes can also be used in electrochemical studies of biological molecules. Perhaps the most extensive investigations have been made with graphite electrodes. It was found 1° that the relevant electro-
l0 F. A. Armstrong, H. A. O. Hill, B. N. Oliver, and D. Whitford, J. Am. Chem. Soc. 107, 1473 (1985).
504
PROBES OF METAL ION ENVIRONMENTS
[19]
chemistry at edge-plane pyrolytic graphite electrodes, with and without added metal ions (depending on the charge of the protein being studied), was well behaved. Edge-plane pyrolytic graphite has, at its surface, a variety of oxygenated functional groups including carboxylates. Depending on the state of oxidation of the freshly prepared surface, the electrochemistry of cytochrome c and, with added metal ions, plastocyanin, etc., is quasi-reversible. In an attempt to make use of better defined electrode surfaces, materials such as metallic ruthenium dioxide have also been employed with some success. 11 The results obtained with cytochrome c were similar to those reported at the same time as the first use of promoters, namely, tin-doped indium oxide, ~2 and followed up some time later by o t h e r s . 8,13
It would be misleading to give the impression that these results were straightforward. Of course there were, and still are, problems concerning the exact nature of the electrode surface. Attempts have been made to examine the detailed nature of the surfaces, for example, by ellipsometry TM and, more recently, by scanning tunneling microscopy 15; an exact description in atomic terms still eludes us. It appears the problems were, at one level, more mundane. Under a host of conditions, peak-shaped electrochemical responses could not be obtained. Often, when a promoter was used, rather " p o o r " electrochemistry resulted; moreover, when the electrode surface was modified in a variety of ways, the electrochemical results indicated poor electrochemistry when essentially no electrochemistry would have been expected. When the results were reassessed 4'i6-18 in terms of the behavior of the electroactive species at a microelectrode, that is, one having dimensions of the order of 1/.tm, they appeared consistent with rapid electron transfer rates. The difference was due to the effect II M. A. Harmer and H. A. O. Hill, J. Electroanal. Chem. 170, 369 (1984); M. A. Harmer, and H. A. O. Hill, J. Electroanal. Chem. 189, 229 (1985). 12 p. Yeh and T. Kuwana, Chem. Lett., 1145 (1977). 13 E. F. Bowden, F. M. Hawkridge, J. F. Chlebowski, E. E. Bancroft, C. Thorpe, and H. N. Blount, J. Am. Chem. Soc. 104, 7641 (1982). 14 D. Elliott, A. Hamnett, O. C. Lettington, H. A. O. Hill, and N. J. Walton, J. Electroanal. Chem. 202, 303 (1986). 15 A. J. Mayne, A. R. Avery, J. Knall, T. S. Jones, I. G. Blackham, L. Pinheiro, T. R. I. Cataldi, H. A. O. Hill, G. A. D. Briggs, J. B. Pethica, and W. H. Weinberg, J. Chem. Soc., Faraday Trans. in press (1993). 16 F. A. Armstrong, A. M. Bond, H, A. O. Hill, 1. S. M. Psalti, and C. G. Zoski, J. Phys. Chem. 93, 6485 (1989). 17 F. A. Armstrong, A. M. Bond, H. A. O. Hill, B. N. Oliver, and I. S. M, Psalti, J. Am. Chem. Soc. 111, 9185 (1989). i8 A. M. Bond, H. A. O. Hill, D. J. Page, N. J. Walton, and I. S. M. Psalti, Eur. J. Biochem. 191, 737 (1990).
[19]
ELECTROCHEMICAL STUDIES OF METALLOENZYMES
505
Radial Limit
/
--
f
,1 /
"\
"~"\ \
\
\
site destructionl [ sitegeneration
z
\
/
E~
\
sitedestruction1J sitegeneration
E Linear Limit
FIG. 2. Schematic representation of an electrode surface depicting the conversion of radial to linear diffusion as the density of surface electroactive sites increases.
of radial diffusion (Fig. 2) of the electroactive species to the microelectrode as compared to the normally observed linear diffusion at macroelectrodes. The cyclic voltammogram of proteins whose diffusion to a microelectrode is radial in manner i'esembles, albeit superficially, poor electrochemistry at a macroelectrode. Thus, it was suggested that, owing to the nonuniformity of an electrode surface, only an array of microscopically sized sites are actually electroactive to protein molecules, such that diffusion to these sites occurs in a radial manner. Detailed analysis of the experimental
506
PROBES OF METAL ION ENVIRONMENTS
[19]
results showed that the electrochemistry of the proteins corresponded, under all conditions, to situations in which the heterogeneous electron transfer rate was very fast. Another phenomenon that was elucidated by consideration of radial diffusion was the time dependence of the electrochemistry, whether in situations corresponding to small amounts of promoter on the electrode surface, or with mixtures of promoters, or indeed with the mixture of a promoter and an inactive adsorbate. Even the gradual addition of increasing amounts of an adjunct promoter, for example, Cr(NH3)63+, to a ferredoxin solution produced a time-dependent electrochemistry. Obviously this could be associated with the rearrangement of, for example, the Cr(NH3)63+-protein complex, but many of the changes are now thought to be due either to the rearrangement of the promoters on the electrode surface or to dissolution of the promoter followed by readsorption. In most cases, it is relatively easy to envisage how a mixture of promoter and inhibitor could, with time, rearrange to a set o f " i s l a n d s , " corresponding to an array of microelectrodes on the electrode surface. There are a few examples of situations where the reverse happens, ~9 that is, where two different promoters rearrange such that the electrochemistry of a protein alters from a response corresponding to an electrode consisting of an array of microelectrodes to that characteristic of linear diffusion to a macroelectrode. Many, if not all, redox proteins have no biological function on their own: they are associated with other redox proteins, assembled in electron transport systems in membranes or allied with redox enzymes in pursuit of some metabolic process. It therefore appeared sensible to attempt to investigate electrochemically protein-protein complexes. The systems studied 2° were the complexes formed between cytochrome c and plastocyanin and between cytochrome c and cytochrome bs. The availability of electrodes that were "selective" toward the electrochemistry of the given proteins, for example, edge-plane pyrolytic graphite for cytochrome c and gold coated with the tripeptide Cys-Lys-Cys for plastocyanin, enabled the behavior of the complexes to be understood. It appears that the protein which binds to the electrode surface, for example, cytochrome c at edgeplane pyrolytic graphite, acts as an adjunct promoter, holding plastocyanin or cytochrome b5 in such an orientation that electron transfer to the latter can occur. This is consistent with zinc-cytochrome c or indeed many proteins which have an overall charge opposite to that of plastocyanin, acting in the same manner. 19 H. A. O. Hill and G. A. Lawrance, J. Electroanal. Chem. 270, 309 (1989). 20 S. Bagby, P. D. Barker, L.-H. Guo, and H. A, O. Hill, Biochemistry 29, 3213 (1990).
[19]
ELECTROCHEMICAL STUDIES OF METALLOENZYMES
507
There is one important point that emerged from these and related studies. The structures of the complexes must be considered as dynamic; they move with respect not only to each other, but to the electrode surface. The initial description of electron transfer at the electrode envisaged a static arrangement of the protein, or proteins, at the surface but now one must consider a more mobile array of the protein(s) essentially moving in a lateral manner over the electrode surface until a configuration is reached where electron transfer to, or from, the surface is rapid. Such a dynamic view of the electrode-protein structure must involve motions within the protein. Indeed, recent studies on the electrochemistry of genetically engineered 2~ variants of cytochrome c and of its complexes with cytochrome b5 indicate that subtle structural changes within cytochrome c affect the electrochemistry. Such procedures, however, have not generally proved successful in the probing of metalloenzymes. This is essentially due to the same problems encountered in studying protein electrochemistry, namely, low diffusion coefficients of the biological molecule in aqueous solution as a result of the size of the molecules, which leads to low Faradaic currents due to the redox species; rapid and often irreversible adsorption of the molecule at the electrode surface; and a redox center "buried" within the protein and thus shielded for all but a few electrode-protein orientations. The electrochemical study of enzymes has proved more difficult since they are generally substantially larger and more flexible than proteins, and therefore each of the above problems is more apparent. In addition many enzymes are closely associated with membranes and possess highly lipophilic surfaces, which further hinders aqueous studies. Redox enzymes may be classified as being intrinsic or extrinsic in nature.: An extrinsic redox enzyme requires an associated redox protein (cofactor) as part of the electron transfer process, and therefore there must exist one or more sites for its binding at the enzyme surface (and correspondingly one or more electron transfer pathways through the enzyme between redox center and binding site). Such a redox site should enable interaction with an electrode surface to occur and thus facilitate the heterogeneous electron transfer. Therefore, in order to enable communication between an enzyme and the electrode, the surface of the latter must bind the enzyme and prevent denaturation. An intrinsic redox enzyme is one in which electron transfer associated with the catalyzed event is contained within the confines of the active site, that is, the enzyme lacks a "natural" long-range electron transfer pathway. Thus, achieving 21 A. Burrows, L.-H. Guo, H. A. O. Hill, G. McClendon, and F. Sherman, Eur. J. Biochem. 202, 543 (1991).
508
PROBES OF METAL ION ENVIRONMENTS
[19]
la r---
,re
J
|
FIG. 3. Conventional low-volume electrochemical cell. (a) Saturated calomel electrode as reference electrode. (b) Working electrode. (c) Platinum gauze counterelectrode. (d) Luggin capillary. (e) Potassium chloride solution (0.1 M). (f) Working solution (300/zl). heterogeneous electron transfer with an electrode may require that (1) the • site o f the catalytic reaction be close to the e n z y m e surface, (2) the e n z y m e be able to deform without losing its activity, (3) the electrode surface (with or without a promoter) " p r o j e c t " into the enzyme, or (4) electron transfer pathways be introduced by modification. Experimental Procedures The standard electrochemical technique, dc cyclic voltammetry, uses a three-electrode system and potentiostatic control. 22 The conventional electrochemical cell is shown in Fig. 3 and has a working volume o f 300/zl. The reference electrode generally consists of a saturated calomel electrode (SCE), and is housed in a separate compartment from the working solution, connected via a 0.1 mm Luggin capillary, which prevents mass transfer between the chambers. All solutions in the electrochemical cell must contain millimolar concentrations of an electrolyte, commonly potassium chloride, to act 22 as the main charge carriers in the system. In addition, the working solution generally contains millimolar concentrations o f a buffer to ensure p H stability. All electrolytes and substrates must be pure, and all solutions must be prepared with the use o f highpurity water (possessing a resistivity o f 18 MI~ cm). Solutions are degassed prior to electrochemical experimentation with argon or nitrogen to purge 22 Southampton Electrochemistry Group, "Instrumental Methods In Electrochemistry." Ellis Horwood, Chichester, 1985.
[19]
ELECTROCHEMICAL STUDIESOF METALLOENZYMES
509
oxygen from the system, which would otherwise result in a large reduction peak around -400 mV (versus SCE). In addition, a flow of the inert gas over the surface of the working solution during experimentation reduces the risk of airborne contamination to the system. A potential window is scanned between the working and reference electrodes, and the current passed between the working and counterelectrodes is monitored. The counterelectrode consists of a 1 cm 2 piece of platinum gauze; the working electrode (2 to 3 mm in diameter) is constructed by sealing the electrode material (e.g., a gold rod) within a Teflon or glass shroud with the use of an epoxy resin, such as Araldite. All working electrodes are polished with high-purity alumina or diamond paste (graded down to 0.03/xm particulate size) in order to achieve high surface homogeneity. In addition, when a metal electrode is to be used, electrochemical cycling in a 0.1 M inorganic acid, typically sulfuric acid, is usually undertaken prior to each experiment in order to remove 23 surface impurities. Slightly different procedures are employed when a microelectrode is used as the working electrode. A wire or fiber (typically 1 to 25 /zm in diameter) can be sealed directly into a glass shroud, without the requirement of an adhesive. Because a far smaller current is obtained at a microelectrode, there are severely reduced ohmic losses as a result, 24 and thus only a two-electrode configuration is required; current passed at a reference electrode would be negligible. The potential reference for the system may be provided by addition of a redox species possessing a precisely known redox potential at the termination of an experiment. A background cyclic voltammogram consists of a non-Faradaic current due to the capacitive nature of the system (Fig. 4a). On addition of a redox-active species, a Faradaic current is observed if electrochemical communication is achieved with this species (Fig. 4b). From the cyclic voltammograms of a redox-active species, thermodynamic information such as the reversible potential for the heterogeneous electron transfer process is obtained, and kinetic information such as the heterogeneous rate constants of electron transfer may be 22 calculated.
Indirect Enzyme Electrochemistry Indirect electrochemical communication between an electrode and a metalloenzyme may be achieved using an associated redox protein as a mediator, in other words, as an electron transfer shuttle between the 23j. p. Hoare, J. Electrochem. Soc. 131, 1808 (1984). 24S. Pons and M. Fleischmann,Anal. Chem. 59, 1391 (1987).
510
[19]
PROBES OF METAL ION ENVIRONMENTS
(-
...)
I
I
-0.2
I
0.2 ~A
I
0.0 Potential/V (SCE)
I
I
0.2
FIG. 4. Typical cyclic voltammograms (a) for non-Faradaic current of the electrolyte solution and (b) on addition of the redox-active species.
enzyme and the working electrode. Thus, the reduction of dioxygen by cytochrome oxidase may be observed owing to the catalytic regeneration of cytochrome c at a modified gold electrode. 25 A solution of I00/zM horse heart cytochrome c in a phosphate buffer, in the presence of dioxygen, exhibits a quasi-reversible electrochemical response at a bis(4-pyridyl) disulfide-modified gold electrode over scan rates of 1-200 mV sec -j (Fig. 5a). A plot of the peak current against v ~/2, where v is the scan rate (V sec-l), is linear, as defined by the Randles-Sev~ik equation for quasireversible systems. 22 On addition of 0.21 /zM cytochrome-c oxidase to the solution, a large current appears at reducing potentials (Fig. 5b) owing to the catalytic regeneration of the ferricytochrome by the enzyme: Cyt-c oxidase tea + 0 2 + 4H + ~ cyt-c oxidase °x + 2H20 kca, Cyt-c oxidase °x + cyt c(II) ~ cyt-c oxidase tea + cyt c(III) Cyt c(III) + n e - ---> cyt c(II)
(at the electrode)
(I) (2) (3)
Using the approach of Nicholson and Shain, 26the second-order homogeneous rate constant for the reaction between cytochrome c and cytochrome-c oxidase was calculated. From the theoretical working curve 26 relating i¢/i a to the dimensionless parameter (kcat/a) 1/2, a range of kcat/a 25 p. D. Barker, J. O. D. Coleman, H. A. O. Hill, N. J. Walton, and D. Whitford, Soc. Trans. 14, 130 (1986). 26 R. S, Nicholson and I. Shaln, Anal. Chem. 36, 706 (1964).
Biochem.
[19]
ELECTROCHEMICAL STUDIES OF METALLOENZYMES
511
0.5 NA I -0.1 0.0 0.1 0.2 Potential/V(SCE)
C
J FIG. 5. Cyclic voltammograms showing (a) direct electrochemistry of horse heart cytochrome c at a bis(4-bipyridyl) disulfide-modifiedgold electrode and (b) catalytic response on addition of cytochrome-c oxidase.
values for several potential scan rates can be determined, where ic is the catalytic current observed on addition of enzyme, io is the diffusion current, calculated from the reversible c y t o c h r o m e c system [Eq. (3)], kcat is the pseudo-first-order rate constant, and a equals nFv/RT, where F is the Faraday constant, R the universal gas constant, and T the temperature (K). The calculated values of kcat/a are then plotted against v -1, for a range of cytochrome-c oxidase concentrations, each gradient,providing an estimate for kcat for that e n z y m e concentration. Finally, the gradient from a plot of k~at against e n z y m e concentration provides the secondorder homogeneous rate constant for the reaction between c y t o c h r o m e c and c y t o c h r o m e - c oxidase. The value obtained, 3 × 10⁶ M - I sec-i, agreed well with values previously obtained from stopped-flow experiments. An alternative, and theoretically more rigorous, approach to calculating homogeneous second-order rate constants has been developed 27 by 27p. N. Bartlett, P. Tebbutt, and R. G. Whitaker, Prog. React. Kinet. 16, 55 (1991).
512
PROBES OF METAL ION ENVIRONMENTS
[19]
TABLE I SURVEY OF METALLOENZYME ELECTROCHEMISTRY
Metal/active center
Enzyme Alcohol dehydrogenase
Zn
Alcohol dehydrogenase CO acceptor oxidoreductase CO dehydrogenase Cytochrome-c oxidase Cytochrome-c peroxidase Enoate reductase Flavocytochrome b 2 (lactate dehydrogenase)
Heme/PQQ b Fe-S/Mo Fe-S/Ni Heme/Cu Heme Fe-S/FAD b Heme/FMN b
Flavocytochrome c552
Heme/FAD
Galactose oxidase D-Gluconate dehydrogenase
Cu Fe-S/heme/FAD
Hydrogenase
Fe-S
Laccase
Cu
Lysyl oxidase Nitrate reductase Nitrite reductase p-Cresol methylhydroxylase
Cu Heme/Mo/FAD Cu Heme/FAD
Peroxidase
Heme
Succinate dehydrogenase Sulfite oxidase Xanthine oxidase
Fe-S/FAD Mo/heme Fe/Mo/FAD
Nature of electrochemical response a Adsorbed, mediated, s Adsorbed, direct, s Adsorbed, direct, s Ferrocene mediated, s Adsorbed, direct, ns Cytochrome c mediated, s Direct, s Mediated, s Ferrocene or cytochrome c mediated Adsorbed, mediated, s Immobilized, direct, s Direct, ns, catalytic with substrate Mediated, s Adsorbed, mediated, Adsorbed, direct, s Adsorbed, mediated, s Adsorbed, direct, ns Mediated, s Adsorbed, direct, ns, catalytic with substrate Adsorbed, direct, s Direct, ns Mediated, s Direct, s Azurin mediated, s Direct, ns, catalytic with substrate Ferrocene mediated, s Adsorbed, mediated, s Mediated, ns Adsorbed, direct, s Adsorbed, direct, s Mediated, s Ferrocene mediated, s Immobilized, mediated, s Immobilized, direct, s
Refs. 30, 31 32 33 34 35 25, 36 37-39 40 41 30, 42, 43 44 45 46, 47 48 33, 49 50, 51 35 43, 52 53, 54 55 56 57 58 59 60 61 30, 42, 62-64 65 66-73 74 75, 76 77 30, 78-81 82, 83
a Substrate required (s)/not required (ns) for electrochemical response. b pQQ, Pyrroloquinoline quinone; FAD, flavin adenine dinucleotide; FMN, llavin mononucleotide.
[19]
ELECTROCHEMICAL STUDIES OF METALLOENZYMES
513
Bartlett et al. Their method takes into consideration the enzyme-substrate reaction, in addition to the mediator-enzyme reaction, by the introduction of Michaelis-Menten kinetics to provide the first-order rate constant for the regeneration of the enzyme by substrate. With the assumption that sufficient substrate is present so that its concentration gradient across the diffusion layer at the electrode is negligible, a set of second-order differential equations can be produced, describing the transport and kinetics of the various species in the system. A number of approximate analytical solutions are then derived, each corresponding to different concentrations of enzyme, mediator, and substrate and to different relative rates of the enzyme-mediator and enzyme-substrate reactions. Thus, mediator, enzyme, and substrate titrations are performed under electrochemical conditions in order to determine what range of these concentrations result in the case that is required for measurement of the desired variable. The kinetics of the mediated electrochemical enzyme system can then be derived with ease, negating the need to produce a large number of plots as in the application of the Nicholson and Shain approach. A cofactor-mediated enzyme electrochemical system is substantially simplified if a low molecular weight species is used to replace the redox protein as the mediator, with the constraint that rapid heterogeneous electron transfer kinetics with the enzyme and the electrode are retained. In addition, an ideal mediator should require a low overpotential to regeneration and should be stable with respect to pH, temperature, redox state, and oxygen. The organic dyes frequently used in spectrophotometric studies are generally unsuitable for electrochemical work owing to their readiness to autoxidize, their instability on reduction, and a frequent pHdependent redox potential. In enzyme studies the use of a ferrocene as an electrochemical mediator has received much attention2s'29 (and see Table I), 30-83 since its first use in mediating the electrochemically controlled 28 A. E. G. Cass, G. Davis, M. J. Green, and H. A. O. Hill, J, Electroanal. Chem. 190, 117 (1985). 29 E. Liaudet, F. Battaglini, and E. J. Calvo, J. Electroanal. Chem. 293, 55 (1990). 30 j. j. Kulys, Biosensors 2, 3 (1986). 31 H. Yamanaka and M. Mascini, Anal. Lett. 25, 983 (1992). 32 S. Miyamoto, T. Murakami, A. Saito, and J. Kimura, Biosens. Bioelectron. 6, 563 (1991). 33 T. Ikeda, S. Miyaoka, F. Matsushita, D. Kobayashi, and M. Senda, Chem. Lett. 5, 847 (1992). 34 A. P. F. Turner, W. J. Aston, I. J. Higgins, J. M. Bell, J. Colby, G. Davis, and H. A. O. Hill, Anal. Chim. Acta 163, 161 (1984). 35 E. T. Smith, S. A. Ensign, P. W. Ludden, and B. A. Feinberg, Biochem. J. 285, 181 (1992). 36 W. J. Albery, A. E. G. Cass, and Z. X. Shu, Biosens. Bioelectron. 5, 379 (1990). 37 F. A. Armstrong and A. M. Lannon, J. Am. Chem. Soc. 109, 7211 (1987). 38 R. M. Paddock and E. F. Bowden, J. Electroanal. Chem. 260, 487 (1989).
514
PROBES OF METAL ION ENVIRONMENTS
[19]
catalytic oxidation of glucose by the enzyme glucose oxidase. 84 Ferrocene is stable in both redox states in aqueous solution, possesses a pH-independent redox potential (Ev2 = + 165 mV versus SCE), is only slowly reactive with oxygen, and shows rapid reversible electrochemistry at an electrode. Most significantly, a large number of ferrocene derivatives can be readily
39 H. Assefa and E. F. Bowden, Biochem. Biophys. Res. Commun. 139, 1003 (1986). 4o H. Simon, J. Bader, H. GOnther, S. Neumann, and J. Thanos, Angew. Chem., Int. Ed. Engl. 24, 539 (1985). 41 A. E. G. Cass, G. Davis, H. A. O. Hill, and D. J. Nancarrow, Biochim. Biophys. Acta 828, 51 (1985). 42 j. j. Kulys and A. S. Samalius, Bioelectrochem. Bioenerg. 10, 385 (1983); J. J. Kulys, A. S. Samalius, and G. J. S. Svirmickas, FEBS Lett. 114, 7 (1980). 43 N. K. (~6nas, A. K. Pocius, and J. J. Kulys, Bioelectrochem. Bioenerg. 12, 583 (1984). 44 S. L. Staskeviciene, N. K. (~6nas, and J. J. Kulys, Anal. Chim. Acta 243, 167 (1991). 45 L.-H. Guo, H. A. O. Hill, D. J. Hopper, G. A. Lawrance, and G. S. Sanghera, J. Biol. Chem. 265, 1958 (1990). 46 j. M. Dicks, W. J. Aston, G. Davis, and A. P. F. Turner, Anal. Chim. Acta 182, 103 (1986). 47 p. D. Hale and T. A. Skotheim, Synth. Met. 28, C853 (1989). 48 T. lkeda, K. Miki, F. Fushimi, and M. Senda, Agric. Biol. Chem. 51,747 (1987); T. Ikeda, M. Miki, F. Fushimi, and M. Senda, Agric. Biol. Chem. 52, 1557 (1988). 49 T. lkeda, F. Fushimi, K. Miki, and M. Senda, Agric. Biol. Chem. 52, 2655 (1988). 50 M. R. Tarasevich, Bioelectrochem. Bioenerg. 6, 587 (1979). 51 H. A. O. Hill and I. J. Higgins, Philos. Trans. R. Soc. London 302A, 267 (1981). 52 V. T. Taniguchi, B. G. Malmstr6m, F. C. Anson, and H. B. Gray, Proc. Natl. Acad. Sci. U.S.A. 79, 3387 (1982). 53 M. R. Tarasevich, A. I. Yaropolov, V. A. Bogdanovskaya, and S. D. Varfolomev, Bioelectrochem. Bioenerg. 6, 393 (1979). 54 C.-W. Lee, H. B. Gray, F. C. Anson, and B. G. MalmstrOm, J. Electroanal. Chem. 172, 289 (1984). 55 I. V. Berezin, V. A. Bogdanovskaya, S. D. Varfolomeev, M. R. Tarasevich, and A. I. Yaropolov, Dokl. Akad. Nauk S S S R 240, 615 (1978); A. I. Yaropolov, B. Malovik, S. D. Varvolomeev, and I. V. Berezin, Dokl. Akad. Nauk S S S R 249, 1399 (1979). 56 K. Govindaraju, B. U. Nair, T. Ramasami, and D. Ramaswamy, J. lnorg. Biochem. 29, 111 (1987). 57 C. J. Kay, L. P. Solomonson, and M. J. Barber, Biochemistry 30, 11445 (1991). 5a Z. H. L. Abraham, R. Early, H. A. O. Hill, D. J. Lowe, P. de Oliveira, and B. E. Smith, in preparation (1993). 59 H. A. O. Hill, 13. N. Oliver, D. J. Page, and D. J. Hopper, J. Chem. Soc,, Chem. Commun., 1469 (1985). 60 L.-H. Guo, H. A. O. Hill, G. A. Lawrance, and G. S. Sanghera, J. Electroanal. Chem. 266, 379 (1989). 61 j. E. Frew, M. A. Harmer, H. A. O. Hill, and S. I. Libor, J. Electroanal. Chem. 201, 1 (1986). 62 G. J. Moody, G. S. Sanghera, and J. D. R. Thomas, Analyst 112, 65 (1987). 63 j. j. Kulys and R. A. Vidziunaite, Anal. Lett. 16, 197 (1983). T. Tatsuma, Y. Okawa, and T. Watanabe, Anal. Chem. 61, 2352 (1989). 65 V. J. Razumas, A. V. Gudavi~ius, and J. J. Kulys, J. Electroanal. Chem. 151, 311 (1983); V. J. Razumas, A. V. Gudavi~ius, and J. J. Kulys, J. Electroanal. Chem. 198, 81 (1986).
[19]
ELECTROCHEMICAL STUDIES OF METALLOENZYMES
515
synthesized, with substituent groups being easily altered such that interactions with a particular enzyme may be encouraged. Direct Electrochemistry The first reports of the direct electrochemistry of enzymes involved studies with flavoenzymes. However, because in most cases the prosthetic group is not covalently bound to the protein, and is often observed to dissociate, especially at an electrode surface, it is likely that it acts as a mediator in the electron transfer process. Similarly, some reports 7s suggested that direct electron transfer of a number of enzymes had been observed at conducting organic salt electrodes, such as tetrathiafulvalinium-tetracyanoquinodimethanide (TTF-TCNQ). It has now been generally accepted that the organic groups of the electrode possess sufficient solubility for slight dissolution to occur, and the resulting enzyme electro-
66 j. j. Kulys, V.-S. A. Laurinavi~ius, M. V. Pesliakiene, and V. V. Gurevi~iene, Anal. Chim. Acta 148, 13 (1983). 67 T. Tatsuma and T. Watanabe, Anal. Chim. Acta 242, 85 (1991). 68 T. Tatsuma and T. Watanabe, J. Electroanal. Chem. 310, 149 (1991). 69 H. Iwai and S. Akihama, Chem. Pharm. Bull. 34, 3471 (1986). 7o H. Durliat, A. Courteix, and M. Comtat, Bioelectrochem. Bioenerg. 22, 197 (1989). 71 j. j. Kulys and R. D. Schmid, Bioelectrochem. Bioenerg. 24, 305 (1990). 72 U. Wollenberger, V. Bogdanovskaya, S. Bobrin, F. Scheller, and M. R. Tarasevich, Anal. Left. 23, 1795 (1990). 73 j. Zhao, R. W. Henkens, J. G. Stonehuerner, J. P. O'Daly, and A. L. Crumbliss, J. Electroanal. Chem. 327, 109 (1992); J. G. Stonehuerner, J. Zhao, J. P. O'Daly, A. L. Crumbliss, and R. W. Henkens, Biosens. Bioelectron. 7, 421 (1992). 74 A. Sucheta, B. A. C. Ackrell, B. Cochran, and F. A. Armstrong, Nature (London) 356, 361 (1992). 75 p. A. Nader, S. S. Vives, and H. A. Mottola, J. Electroanal. Chem. 284, 323 (1990). 76 L. A. Coury, Jr., B. N. Oliver, J. O. Egekeze, C. S. Sosnoff, J. C. Brumfield, R. P. Buck, and R. W. Murray, Anal. Chem. 62, 452 (1990); L. A. Coury, Jr., R. W. Murray, J. L. Johnson, and K. V. Rajagopalon, J. Phys. Chem. 95, 6034 (1991). 77 A. E. G. Cass, G. Davis, M. J. Green, and H. A. O. Hill, J. Electroanal. Chem. 190, 117 (1985). 78 W. J. Albery, P. N. Bartlett, M. Bycroft, D. H. Craston, and B. J. Driscoll, J. Electroanal. Chem. 218, 119 (1987). 79 R. M. Ianniello, T. J. Lindsay, and A. M. Yacynych, Anal. Chem. 54, 1980 (1982). so K. McKenna and A, Brajter-Toth, Anal. Chem. 59, 954 (1987). el H. Okuma, H. Takahashi, S. Sekimukai, K. Kawahara, and R. Akahoshi, Anal. Chim. Acta 244, 161 (1991). 82 E. Watanabe, H. Endo, T. Hayashi, and K. Toyama, Biosensors 2, 235 (1986). 83 O. Doblhoff-Dier and G. A. Rechnitz, Anal. Lett. 22, 1047 (1989). 84 A. E. G. Cass, G. Davis, G. D. Francis, H. A. O. Hill, W. J. Aston, I. J. Higgins, E. V. Plotkin, L. D. L. Scott, and A. P. F. Turner, Anal. Chem. 56, 667 (1984).
516
PROBES OF METAL ION ENVIRONMENTS
[19]
chemical reaction takes place via a mechanism involving heterogeneous catalysis by the organic salt, as originally proposed by Kulys. 3°'85Probably the first genuine studies of the direct electrical communication with an enzyme involved the copper-containing laccase. 53,54 Lee et al. adsorbed fungal laccase A from Polyporous versicolor directly onto pyrolytic edgeplane graphite electrodes and observed the direct electroreduction ofdioxygen, catalyzed by the enzyme. A reversible electrochemical response for the adsorbed enzyme, in the absence of dioxygen, was produced in a solution saturated with either 2,9-dimethylphenanthroline or 4,4'-bipyridine acting as promoters. As discussed in the introduction, direct electrochemistry of a metalloenzyme may be encouraged with the use of promoters, via the formation of favorable electrostatic interactions between the enzyme and the electrode surface. For example, Armstrong described the electrochemical reduction of hydrogen peroxide, catalyzed by cytochrome-c peroxidase (CCP). 37 The electrode reaction was promoted by the addition of an aminoglycoside. The aminoglycosides are a family of bactericidal antibiotics that are both water soluble and stable in solution (Fig. 6). They consist of a hexose nucleus with amino sugars attached by glycosidic linkages, resulting in molecules possessing spatially arranged NH3 + functionalities on a quasirigid skeleton. Cytochrome-c peroxidase is a b-type heme-containing metalloenzyme that utilizes cytochrome c2 as an electron donor. A number of acidic (CO2-) residues are present on the surface of CCP, and it was shown that the amine functionalities of the aminoglycosides neomycin and gentamycin readily interact with the acidic groups. In solution a film formed at the surface of an edge-plane graphite electrode, approaching monolayer coverage of this enzyme-promoter complex. Thus, the aminoglycosides promoted the nondenaturative adsorption of the negatively charged CCP at a similarly charged electrode. On addition of hydrogen peroxide to the solution a large catalytic current was passed at the working electrode due to the reduction of the peroxide by the enzyme. Paddock and Bowden have observed the catalytic reduction of the peroxide by CCP adsorbed directly onto edge-plane graphite electrodes, without the presence of promoters. 38 Many reports have been published concerning electrochemical communication with peroxidases (see Table I). Much of the interest lies in the field of biosensors and the use of peroxidase as a peroxide sensor. Taken a stage further, Kulys et al. adsorbed horseradish peroxidase (HRP) directly onto SnO electrodes 66 before addition of a further enzyme which in the presence of substrate produced a peroxide as one of the products. In this s5 j. j. K u l y s , Enzyme Microb. Technol. 3, 344 (1981).
[19]
ELECTROCHEMICAL STUDIES OF METALLOENZYMES
517
Ho O,
a
NH2
HO - - ~ 7 ~ ' ~
HO
.o O
HO
0
H~O~NH2~__O_~
OH
NH2 b
II OH H2NCH~._~~
OH
CH3
e
NH
OH
0
NH~
O ~ O ~NHCH~)H H OH NH2 C
NH2
H O ~
NH21 ~ 2
NH
0'~'~/l~n2
2
0-~/NH
HO
....
0 --~OH ~''v
2
HO _._.~..7 ~--.v
HO HO
OH
FIG. 6. Members of the aminoglycoside family: (a) glucosamine, (b) dihydroxystreptomycin, (c) neamine, (d) neomycin, (e) gentamycin, (f) ribostamycin.
518
PROBES OF METAL ION ENVIRONMENTS
[19]
manner xanthine oxidase,62.66 uricase,67 and alcohol dehydrogenase6s have been coimmobilized with HRP to act as sensors for their respective substrates. The great interest in the application of enzymes in the production of sensor devices 86 has provided much of the impetus for the advances that have been made 87,ss in the immobilization of enzymes at an electrode. The entrapment of an enzyme in a carbon paste electrode, with the use of a paraffin to provide the paste, has been reported on numerous occasions (see Table I). Similarly, much research is being undertaken in the field of polymer electrodes,SS such that an enzyme may be entrapped in a polymer matrix, for example, a polypyrrole, at an electrode surface. Finally, enzymes may be chemically bound to a surface via, for example, a carbodiimide- or cyanuric chloride-modified graphite electrode. 87 The direct reversible electrochemistry of the dehydrogenase, p-cresol methylhydroxylase (PCMH), from P s e u d o m o n a s putida, has been observed 6° between the heme of the flavocytochrome and an edge-plane graphite electrode. Here the reversible electrochemical response was obtained due to oxidation and reduction of the enzyme itself, the presence of substrate not being required for communication between electrode and enzyme to be observed. Diffusion-controlled heterogeneous electron transfer was modulated by the concentration and type of promoter used, ranging from simple cations through to polyamines and aminoglycosides. PCMH is found in the periplasm of certain pseudomonads, where it catalyzes the dehydrogenation and hydration of p-cresol and homologs to the corresponding alcohol, which is then further dehydrogenated to the aldehyde or ketone. A buffered solution containing l0 mM spermine, a linear polyamine, and 35/zM PCMH produced a reversible cyclic voltammetric response (Fig. 7b) at an edge-plane graphite electrode. The midpoint potential ( - + 10 mV versus SCE) was in good agreement with the potential determined by potentiometric titration. On addition of 3 mM p-cresol to the solution, a large catalytic current was observed at oxidizing potentials (Fig. 7d) owing to the repetitive regeneration of the reduced enzyme (Fig. 8) by the substrate as a result of the dehydrogenation of p-cresol by the enzyme. A linear current against substrate ¢oncentration response was obtained up to 0.5 mM p-cresol. Similarly, if p-cresol was replaced by the intermediate alcohol p-hydroxybenzyl alcohol, a catalytic current response was still obtained, though with reduced peak currents. The necess6A. P. F. Turner, I. Karnbe, and G. S. Wilson, "Biosensors, Fundamentalsand Applications." Oxford Univ. Press, Oxford, 1986;A. E. G. Cass (ed.), "Biosensors,A Practical Approach." Oxford Univ. Press, Oxford, 1990. s7V. J. Razumas,J. J. Jasaitis, and J. J. Kulys,Bioelectrochem. Bioenerg. 12, 297 (1984). ss H. D. Abrufia, Coord. Chem. Rev. 86, 135 (1988).
[19]
ELECTROCHEMICAL STUDIES OF METALLOENZYMES
519
C
-&
,
olo
i
,~
-o.2
I
o
i
012
Potential/V(SCE)
FIG. 7. Direct electrochemistry of p-cresol methylhydroxylase. (a) Response in buffered solution at an edge-plane graphite electrode in the presence of a promoter. (b) Response on addition of enzyme. (c) As (b), but at reduced sensitivity. (d) Catalytic response on addition of p-cresol to solution. Reproduced with permission from J. Electroanal. Chem. 2 ~ , 379 (1989).
sity of the presence of a cationic promoter was shown by the lack of a Faradaic response at an edge-plane graphite electrode in a buffered solution containing both PCMH and p-cresol (Fig. 9a), but, on addition of Cr(NH3)63+, neomycin, or gentamycin to the solution, a large catalytic
CHO
PCMHox
S
~0H
FIG. 8. Schematic representation of the electrochemically controlled catalytic conversion of p-cresol to p-hydroxybenzaldehyde by the enzyme p-cresol methylhydroxylase (PCMH).
520
PROBES OF METAL ION ENVIRONMENTS
[19]
b
j I_
-0.3
I
|
|
t
0.0
!
I
0.3
Potential/V (SCE) Fro. 9. Cyclic voltammograms illustrating (a) lack of response observed for a solution of p-cresol methylhydroxylase and p-cresol and (b) catalytic response obtained on addition of Cr(NH3)63÷ to the solution. Reproduced with permission from J. Electroanal. Chem. 266, 379 (1989).
current was immediately passed at the working electrode (Fig. 9b). The high specificity o f the e n z y m e was revealed when no catalytic current was observed if the substrate was replaced with o- or m-cresol. Although the direct electrochemistry of many redox enzymes can be observed at an electrode, this is one of only a very few reported instances o f the direct electrochemical communication between an electrode and an enzyme, in the absence o f substrate. Similarly, the direct electrochemis-
[19]
E L E C T R O C H E M I C A L S T U D I E S OF M E T A L L O E N Z Y M E S
521
tries of two iron-sulfur enzymes have been reported in the absence of substrate. 35 The reduction potentials of the hydrogenase from Clostridium pasteurianum and the carbon monoxide dehydrogenase from Rhodospirillum rubrum were obtained by square-wave voltammetry at edge-plane graphite electrodes in the presence of cationic promoters. For both enzymes, the reduction potential was about -640 mV versus SCE, and one electron was transferred per redox center, as determined from the peak width at half-height, which is characteristic of low-potential [4Fe-4S] clusters. The enzyme sulfide : cytochrome-c oxidoreductase, or flavocytochrome c552, from the purple sulfur bacterium Chromatium vinosum is involved in the photosynthetic oxidation of sulfur. It contains a flavin adenine dinucleotide (FAD) center and two hemes. Direct electrochemistry of the heme of the enzyme is observed at an edge-plane graphite electrode in the presence of polyvalent cation promoters, including aminoglycosides.45 On addition of substrate, sulfide, a catalytic current is observed. The substrate is first oxidized at the FAD center of the enzyme, then, following an intramolecular electron transfer to one of the hemes, the enzyme is reoxidized at the electrode. In a few instances, direct unpromoted electrical communication to an enzyme may be achieved at an unmodified electrode. A catalytic response in the presence of substrate is obtained with D-gluconate dehydrogenase (GADH) adsorbed on carbon paste electrodes. 49 GADH from Pseudomonas fluorescens is a membrane-bound enzyme that contains an FAD center, an Fe-S cluster, and a c-type heme. Similarly, this enzyme and alcohol dehydrogenase, a quinohemoprotein from Gluconobacter suboxydans, have been adsorbed at carbon or metal electrodes and catalytic responses in the presence of the respective substrates produced) 3 Succinate dehydrogenase (SDH) is a mitochondrial electron transport enzyme containing one FAD and three Fe-S centers. When SDH is adsorbed TM directly onto an edge-plane graphite electrode, a catalytic current is observed in the presence of succinate. However, on addition of fumarate to the solution, "troughs" appear in the cyclic voltammograms, such that an increase in the driving force produces a decrease in the rate of reduction. It is postulated that substrate binding to or product release from SDH is allowed only during the period when the active site is oxidized, which means the enzyme possesses a degree of control over the electron flow in the system. In conclusion, the techniques that have been developed since the late 1970s in the study of protein electrochemistry are now being applied in the study of enzyme systems. Although electrochemical communication with over 20 metalloenzymes has been achieved, most studies have been directed toward the development of biosensors, in which the enzyme is immobilized at the electrode surface and provides a substrate-dependent
522
PROBES OF M E T A L ION E N V I R O N M E N T S
[20]
current response. The application of electrochemical techniques for providing kinetic information on enzyme systems is only slowly developing, but if progress is similar to that made with metalloproteins, the results should be promising. Acknowledgments We thank the A.F.R.C. for a studentshipto N.I.H., and the S.E.R.C., M.R.C., Leverhulme Trust, E. P. Abraham Trust, and MediSenseInc. for financialsupport.
[20] P u l s e R a d i o l y s i s By G. ARTHUR SALMON and A. GEOFFREY SYKES Introduction The technique of pulse radiolysis, which was originally developed to study fast primary processes in radiation chemistry, ~-4 is the radiation chemical analog of flash photolysis) ,6 In essence, the technique employs an intense pulse of ionizing radiation, usually of submicrosecond duration, to generate a high concentration of reactive intermediates, the chemical reactions of which may be followed by UV-VIS spectrophotometry. Time resolution down to 10 nsec is easily achieved, and in several instances this has been reduced to the picosecond domain. 7-9 For metalloprotein studies it is, however, also important that processes extending over seconds can be followed. Other modes of detection have been used including conductivity, 1° electron paramagnetic resonance
I M. S. Matheson and L. M. Dorfman, J. Chem. Phys. 32, 1870 (1960). 2 R. L. McCarthy and A. McLachlan, Trans. Faraday Soc. 56, 1187 (1960). 3 j. p. Keene, Nature (London) 188, 843 (1960). 4 j. W. Boag and R. W. Steel, Br. Empire Campaign Rep. 38 (Part II), 251 (1960). 5 R. G. W. Norrish and G. Porter, Nature (London) 164, 658 (1949). 6 G. Porter, Proc. R. Soc. London A 200, 284 (1950). 7 M. J. Bronskill, R. K. Wolff, and J. W. Hunt, J. Chem. Phys. 53, 4201 (1970). 8 C. D. Jonah, Rev. Sci. lnstrum. 46, 62 (1975). 9 y . Tabata, J. Tanaka, S. Tagawa, Y. Katsumura, T. Ueda, and K. Hasegawa, J. Fac. Eng. Univ. Tokyo Ser. B 34, 619 (1978). l0 K.-D. Asmus and E. Janata, in "The Study of Fast Processes and Transient Species by Electron Pulse Radiolysis" (J. H. Baxendale and F. Busi, eds.), NATO Advanced Study Institute Series, D, p. 91. Reidel Publ., Dordrecht, The Netherlands, 1982.
METHODS IN ENZYMOLOGY, VOL. 227
Copyright © 1993 by Academic Press, Inc. All rights of reproduction in any form reserved.
[20]
PULSE RADIOLYSIS
523
(EPR), 11 and polarography, 12 but kinetic spectrophotometry is by far the most versatile and the most used for studies on proteins, and we confine our consideration to this method. The value of the pulse radiolysis technique to studies on proteins and enzyme systems stems from the fact that the radiolysis of water and aqueous solutions provides a means of generating, in a controlled way, a wide range of one-electron oxidizing and reducing agents which may be used to characterize and study protein function. Essentially three kinds of studies have been performed. In the selective probe technique, inorganic oxidizing radicals such a s ( S C N ) 2 - : , Br2 ~-, I2 ~ , C12 ~-, C O 3 v , and S e O 3 ~have been used to identify the essential amino acids which, if damaged, lead to inactivation of a protein. The method has been reviewed by Adams and Wardman 13 and Bisby et a l ) 4 Perhaps the most extensive application of the technique to protein chemistry involves the exploration of the properties of intermediate oxidation states of metal ions in metalloproteins, which either are involved in electron transport chains or are vital to enzyme activity. In this kind of study the intermediate, usually unstable, oxidation state of the protein is generated either by selective one-electron reduction or by oxidation of the reduced protein using one of the selective one-electron oxidants referred to above. A review of this type of study has been made by Buxton) 5 Finally, considerable use of the technique has been made to study electron transfer processes involving redox proteins. The method is closely related to the study of intermediate redox states mentioned above, but in this case particular emphasis is placed on observing electron transfer between sites of different reduction potential in a protein, such as occurs in the multisite copper-containing protein ascorbate oxidase, or on observing electron transport to or from the natural redox site in a protein and an artificially introduced redox moiety in a well-characterized site on the protein. The pulse radiolysis method is closely related to the pioneering work by Gray and colleagues, 16who used flash photolysis to study ruthenium-copper (Run-Cu u) electron transfer in azurin modified by complexing Ru(III)(NH3)5 to histidine-83 of the protein. H A. D. Trifunac, in "The Study of Fast Processes and Transient Species by Electron Pulse Radiolysis" (J. H. Baxendale and F. Busi, eds.), NATO Advanced Study Institute Series, D, p. 163. Reidel Publ., Dordrecht, The Netherlands, 1982. 12 K.-D. Asmus and E. Janata, in "The Study of Fast Processes and Transient Species by Electron Pulse Radiolysis" (J. H. Baxendale and F. Busi, eds.), NATO Advanced Study Institute Series, D, p. 115. Reidel Publ., Dordrecht, The Netherlands, 1982. 13 G. E. Adams and P. Wardman, Free Radicals Biol. 3, 53 (1977). 14 R. H. Bisby, R. B. Cundall, and A. K. Davies, Photochem. Photobiol. 28, 827 (1978). 15 G. V. Buxton, Adv. lnorg. Bioinorg. Mech. 3, 131 (1984). 16 N. M. Kostic, R. Margalit, Chi-Ming Che, and H. B. Gray, J. Am. Chem. Soc. 105, 7765 (1983).
524
PROBES OF METAL ION ENVIRONMENTS
[20]
Radiation Chemical Basis When a beam of high-energy electrons (-> 1 MeV) traverses water or an aqueous solution, it results in the ionization of water molecules along the tracks of the electrons. Although a major proportion of the ionization events involve single ion pairs, in a proportion of the events the secondary electron has sufficient energy to bring about further ionizations, and this results in a number of ion pairs being formed in close proximity, that is, in a so-called spur. Thus, along the track of the primary electron we have randomly distributed regions of ionization that may contain one to five ion pairs, the distribution being in favor of single ion pairs. Thermalization of the secondary electrons occurs within 10-~2 sec, and trapping and solvation of the electrons takes place very rapidly, leading to the formation of hydrated electrons eaq-. Within about 10-14 sec the H2O+ radical cation generated in the ionization events undergoes the very fast ion-molecule reaction (1), which results in the formation of the H2 O + + H 2 0 ~
"OH + H30 +
(1)
hydroxyl radical and the hydroxonium, or hydrogen, ion. Thus, within 10-12 sec of the passage of the high-energy electron through the aqueous system the situation may be summarized as in Eq. (2). The numbers in (4.8 × 10⁻⁷)H2O---> (4.8 x 10⁻⁷)eaq- + (4.8 × 10⁻⁷)'OH + (4.8 × 10⁻⁷)H +
(2) parentheses are G values, that is, the number of moles of product formed or reactant consumed per joule of energy absorbed by the system, in this case the aqueous solution. Although the SI unit version of the G value used here is rapidly gaining acceptance, it should be noted that the alternative unit of molecules/(100 eV) is still in frequent use. The relationship between the two units is G/mol j - i = 1.037
×
10 -7
G'/molecules (100 eV) -1
Within 10-7 sec radical-radical reactions within the spurs lead to the formation of molecular products, and the surviving free radicals are essentially homogeneously distributed. At this stage the radiolysis of water is summarized by Eq. (3). (4.23 × 10⁻⁷)H20 ---->(2.8 × 10⁻⁷)eaq- + (6.2 x 10⁻⁸)H • + (2.8 × 10⁻⁷)'OH + (2.8 × 10⁻⁷)H + + (7.3 × 10⁻⁸)H202
(3)
For historical reasons, the radicals surviving after 10 -7 s e c are known as primary radials. The G values shown in parentheses represent the yields of these products (mol j-l), which would be scavenged by low
[20]
PULSE RADIOLYSIS
525
concentrations ( N 2 + O-
H20
) "OH + O H -
(4)
in a saturated solution at 20 ° is about 2.5 × 10 -2 mol dm -3, and under these conditions G(-OH) = 5.7 × 10 -7 mol J-~; however, the G value is somewhat dependent on the concentration of the free radical scavenger.17 Nitrous oxide does not react rapidly with hydrogen atoms, so in NzO-saturated solutions in the p H range 3-11 about 10% of the total yield of radicals remains as H.. Below pH 3, the reaction of eaqwith H + competes effectively with reaction (4), and saturation with N20 is no longer a satisfactory means of achieving oxidizing conditions. Selective oxidizing radicals. Although •O H is a convenient oxidant for many studies, it is a very powerful oxidant (E ° = +2.8 V) and acts both by hydrogen abstraction and electron transfer. It is often desirable to employ a more selective oxidant. This is usually achieved by incorporating a second solute in the solution, in addition to N20, to react with the •O H and convert it to the more selective agent. Suitable solutes are azide ion, thiocyanate ion, bromide ion, and iodide ion, which generate, respectively, N 3. (E ° = 1.33 V), ( S C N ) 2 ~- (E ° = 1.33 V), Br2: (E ° = 1.66 V), and Iz 7 (E ° -~ 1.0 V) radicals, reactions (5)-(8). Generation of SO47 (E ° = 2.4 V)
x7R. H. Schuler, A. L. HartzeU, and B. Behar, J. Phys. Chem. 85, 191 (1981).
526
PROBES OF METAL ION ENVIRONMENTS • O H + N 3- ~
O H - + N3"
•O H + S C N - --~ O H - + S C N . . •O H + B r - ~ O H - + B r . . •O H + I - ---~ O H - + I . .
(5)
SCNBr-
I-
[20]
(SCN)2 ~
" Br 2~-
" 12~
(6) (7) (8)
m a y be achieved by radiolysis o f nitrogen- or argon-saturated solutions o f p e r o x o d i s u l f a t e ion ( - 10 -3 mol dm-3), which reacts with eaq- by reaction (9) (k = 1.2 x 101° d m 3 mol -l s e c - l ) . In this case, it is n e c e s s a r y to (9)
eaq- + 82082- "~ 5 0 4 7 + 5042-
add a b o u t 10 -2 mol d m -3 tert-butanol to convert - O H to the relatively unreactive tert-butanol radical, reaction (10). C o m p a r e d with . O H , SO4 ~ H3 H3C--C--OH
I
CH 3
~ H3 + .OH--~ HzC--C--OH
I
+ H20
(10)
CH 3
has a m u c h lower t e n d e n c y to undergo h y d r o g e n abstraction or addition reactions and reacts mainly b y electron transfer.
Reducing Radicals Hydrated electron. To use eaq- as a reductant it is usual to add tertbutanol to the d e o x y g e n a t e d solution so as to c o n v e r t •O H , as described above. U n d e r normal conditions, [tert-butanol] ~ 10 -2 M , H a t o m s will remain with a b o u t 25% of the yield o f eaq-, but they can be eliminated b y increasing the tert-butanol concentration to a p p r o x i m a t e l y 1 mol dm -3. Carbon dioxide radical anion• The CO2 ~ radical (E ° = - 1 . 9 V) is a versatile reductant that can be generated as the only radical species b y radiolysis o f N 2 0 - s a t u r a t e d solutions containing 10 -2 mol dm -3 sodium formate• In this system, . O H and H . are c o n v e r t e d to CO2 -~ by reactions (11) and (12)• O t h e r m o r e selective reducing agents m a y be generated by •O H + H C O 2- --~ H 2 0 + CO2 ~H" + H C O 2- --) H 2 + CO2 ~
(11) (12)
adding to the f o r m a t e / N 2 0 solution a third reactant X in lower concentration than the f o r m a t e but at a concentration such that electron transfer f r o m CO2 ~ to X is c o m p l e t e on a fast time scale, reaction (13). A p~/xticuCO2 ~- + X - - * CO 2 + X ~-
(13)
[20]
PULSE RADIOLYSlS
527
larly valuable solute in this respect is methyl viologen (1,1 '-dimethyl-4,4'bipyridinium dichloride, M V '÷) which is converted to the radical cation (MV "+, E ° = -448 mV) in reaction (13). As well as being a more selective agent because of its much more positive potential compared to eaq- or COz 7 , MV "+has the additional advantage that in the absence of an oxidant it is very long-lived. Thus, it can be used to reduce quantitatively a protein even when the reactivity with the protein is low or the concentration of the protein very low. Other solutes which can be used to generate selective reducing radicals by reaction (13) are the quinones, flavin derivatives, and nitroaryl compounds. The one-electron reduction potentials of many of the radicals derived from these solutes have been tabulated by Wardman. TM Alcohol radicals. A number of the radicals derived from alcohols by the attack of .OH radicals, reaction (14), have been used as selective reductants, the most used being the radical derived from 2-propanol (E ° = - 1.5V). •OH + RIR2CHOH---> H20 + R1RzCOH
(14)
Technique All pulse radiolysis facilities currently operating employ spectrophotometric detection rather than the spectrographic method that was used in some of the early experiments. The methods used are derivatives of those described by Keene. 19The sample is irradiated with a short pulse, usually 10-100 nsec duration, of high-energy electrons, and an optical analyzing system measures the change in light absorption due to the species generated by the radiation. Detection systems are set up so that the recorded signal corresponds to the change in signal from the photomultiplier as a function of time, rather than the absolute signal versus time. The absorbance change at time t, usually measured from the start of the radiation pulse, is given by
A(t) = - l o g I1
Vs(t)]
J
where V0 is the signal from the photodetector before the radiation pulse and Vs(t) is the recorded signal at time t. Thus, traces of absorbance change as a function of time are recorded. Absorption spectra of the transient species existing at time t are obtained by measuring the absorb18 p. Wardman, J. Phys. Chem. Ref. Data 18, 1637 (1989). 19 j. p. Keene, J. Sci. lnstrum. 41, 493 (1964).
528
PROBES OF METAL ION ENVIRONMENTS 10
i
T
i
[20]
i
o') d
E
50 psec/div.
o
0
350
I
I
I
I
400
450
500
550
600
Wavelength/rim FIG. 1. Spectrum produced by the pulse radiolysis of an N20-saturated 15.2/zM solution of deactivated ribonucleotide reductase containing 10 mM sodium azide. (Inset) Pulse radiolysis trace taken at 410 nm.
ance at the given time from a series of traces recorded at a set of wavelengths. Traces of absorption versus time are usually transferred to a computer for kinetic analysis. The inset to Fig. 1 shows a trace obtained at 410 nm in a study 2° of the oxidation by azide radical of ribonucleotide reductase in which the tyrosyl radical has first been inactivated by treatment with hydroxyurea. The trace shows the formation, which is complete in about 150/zsec of a species absorbing at 410 nm, and the spectrum shown in Fig. 1 is obtained from traces such as this by recording the absorbance at 250/zsec. In this case the absorption with hma x equal 410 nm is due to the formation of the tyrosyl radical, whereas the absorption around 5 I0 nm is due to the radical derived from tryptophan. The extent of the radiation-induced absorption is, of course, dependent on the radiation dose absorbed by the system. Spectra such as that shown in Fig. 1 are, therefore, presented either as absorbance normalized to a standard dose, usually 1 krad [in SI units 10 Gy (gray)] or, preferably, as the product of the G value for the species produced and its molar absorptivity, e. Figure 2 shows a first-order kinetic treatment of the trace shown as the inset to Fig. 1. For convenience, it is customary to use conditions such that the reaction of a radical with the protein can conform to pseudo20 K.-Y. Lam, K. Govindaraju, J.-Y. Han., G. A. Salmon, and A. G. Sykes, J.C.S. Dalton Trans., in press (1993).
[20]
PULSE RADIOLYSIS -8.5
. . . .
,
. . . .
,
. . . .
,
529 . . . .
,
.... O0
-8.0
0
-7.5
CO ~:(e~O0-
- / I II - 7 . 0 .
½, 228-231 axial symmetry, 228-230 orthorhombic symmetry, 230-231 modulation, 192-196 probes, 149 Q-band, 219 radio frequency modulation schemes, 193-196 amplitude modulation, 195-196 second field modulation, 195-196 resonators, 197-202 loop-gap, 150, 202,219 S-band, 219-220 sensitivity, enhancement at low modulation frequencies, 196-197 spectra, simulations, 220-223 temperature, 145-146 Davies hole burning in, 135 metalloproteins, 153-164 mixing period, 138-140 pulse sequences, 128-129 transfer of spin populations in, 130 double, 183,206-207 pulsed, 182-185 and electron electron double resonance, combined, 178 energy levels, 123-128 enhancement, 121-122 and EPR, comparison, 210-211 ESEEM-edited, 171-172 experimental considerations, 143-153
617
hyperfine selective, 152, 176 instruments for, 143-153 iron proteins, 359 Mims blind spots, 132, 137-138, 157 hole burning in, 135 hyperfine contrast selectivity, 137 metalloproteins, 153-164 mixing period, 138-140 preparation period, 131-132 pulse sequences, 128-129 multiple quantum, 123 orientation-dependent frequencies, 125 pulsed, 121-122 of central metal nuclei, 161-164 and continuous wave ENDOR, comparison, 164-167 detection period, 129, 132-133 electron coherence effects, 141 electron nuclear coherence effects, 141-142 orientation selectivity by electron spin echo envelope modulation, 143 and ESEEM, comparison, 167-171 microwave transmitter design, 148 mixing period, hyperfine enhancement factor, 138-140 preparation period, hyperfine contrast selectivity, 135-138 probes, 148-150 proton and nitrogen ligand nuclei, 154-161 radio frequency transmitter for, 150152 sensitivity, 147 spectra, amplitudes in, 133-143 sublevel polarization transfer temperature, 146 resolving power, 210-211 sample volume, 146-147 spectrometer, microwave operating and radio frequency range, 152-153 radio frequency range, 152-153 temperature for, 145-146 time scales, 144-145 transition frequencies, 123-128 two-dimensional, 123, 176-182 hole burning in, 176-177 hyperfine selective studies, 178-182 pulse sequence, 176-177
618
SUBJECT INDEX
vanadyl(IV) spin probes, 232, 236240 Electron nuclear electron triple resonance, 176-182 Electron nuclear multiple resonance spectroscopy, pulsed, see Pulsed electron nuclear multiple resonance spectroscopy Electron nuclear nuclear triple resonance, pulsed, 182-185 Electron paramagnetic resonance, 330-353 adiabatic rapid passage, 191 anisotropic and isotropic spectra, computer simulations, 349-351 average integrated intensity f~.ctor gpav, 409 continuous wave, 332 d j configuration, 336-337 d 5 configuration, 337-339 d 7 configuration, 339-340 d 8 configuration, 340 d 9 configuration, 340-342 dipole-dipole interactions, 357 effective spin, 335-336 exchange interactions, 357 experimental considerations, 345-348 g factor, 354-355 orientational dependence, 336 orientation selectivity, 126 hole burning in, 134-135 hyperfine interaction, 356 hyperfine splittings, 356 orientational dependence, 336 information content, 332 inhomogeneously broadened spectral lines, 119-120, 134-135, 332 instrumentation, 345-347, 369-370 integer spin, and Mrssbauer spectroscopy, combination, 463-479 iron complexes, 353-384 information content, 359-360 oxidation and reduction methods, 372-374 iron proteins, 353-384 in oivo studies, 380-384 isotope substitution technique, 347-349 in Kramers doublet, 332-333 low-temperature quantitation in, standards for, 410 magnetically coupled systems, 342-345 principle, 354
progressive power saturation, for T~i determination, 387-389 pulsed electron nuclear double resonance-induced, 185-189 rapid freeze quenching technique, 347 sample for concentration, 371-372 preparation, 347, 370-371 saturation recovery, for T~i determination, 387, 389 signal intensities, quantitation, 376-380 errors, 380 in even-spin systems, 379 in high-spin iron complexes, 378-379 in low-spin iron complexes, 377 from whole cells, 380 spectra analysis, 348-353 average spectral density, 120 characteristics, 355-357 conditions for running, 374-375 line broadening, 119-120 simulation, 376 spectrometers, 345-347, 369-370 spin echo-detected recovery, for T~/ determination, 387, 389 spin Hamiltonian, 335-336 analysis, 348-353 spin-orbit coupling, 355 spin quantitation, 351-353 subspectra, 176 superhyperfine interaction, 356-357 temperature effects and control, 375-376 transition metal ions, 332-345 vanadyl(IV) spin probes, 232-235 Zeeman interaction, 355 zero-field splitting, 355-356 Electron paramagnetic resonance spectroelectrochemical cells, 397-400 standard, 398-400 with visible capability, 401 Electron paramagnetic resonance spectroelectrochemistry, 396-41 l electrochemical aspects, 402 equilibrium criteria, 407-408 EPR quantitation procedure, 408-411 oxidation methods, 406--407 redox mediator titrants and indicators, 404-406 reduction methods, 406-407 spectroscopic aspects, 408-411
SUBJECT INDEX Electron-probe microanalyzer, 542 Electrons Auger, see Auger electrons hydrated, production by pulse radiolysis, 526 Electron self-exchange, 262,281-284 Electron spin echo envelope modulation, 137-138, 142, 357 ENDOR-edited, 172-176 experimental and instrumental considerations, 143-148 orientation selectivity, 143, 159-160 and pulsed ENDOR, comparison, 167171 vanadyl(IV) spin probes, 232,240-244 Electron spin resonance, see Electron paramagnetic resonance Electron transfer long-range, in proteins, pulse radiolysis studies, 532-534 promoters, 501-503,516 reaction, thermodynamic parameters, 396 ENDOR, see Electron nuclear double resonance spectroscopy Enoate reductase, electrochemistry, 513 Enzymes adsorbed on electrodes, as biosensors, 516-518 K+-activated, alkali metal NMR spectroscopy, 87 EPR, see Electron paramagnetic resonance Erbium Cj for, 51 spin expectation value, 51, 53 Erythrocytes, suspensions alkali metal ion transport, ionophoreinduced, 99-101 alkali metal NMR spectroscopy magnetization transfer method, 96-97 modified inversion recovery method, 93-96 shift reagent method, 90-93 lithium-free, membrane potential measurement, 103 ESE, see Electron self-exchange ESEEM, see Electron spin echo envelope modulation ESR, see Electron paramagnetic resonance Europium Cj for, 51
619
Eu(II1), as structural probe, 47 spin expectation value, 51, 53 Exchange interaction, 425-426 Exchange spectroscopy, two-dimensional, 11 cytochrome c, 261-262 EXCTSY, 2, 11 in 2(4Fe-4S) center ferredoxins, 14 in tetraheme proteins, 14 EXSY, see Exchange spectroscopy, twodimensional F Factor VIII, calcium affinity determination, 115 FDMR, see Fluorescence-detected magnetic resonance spectroscopy Fermi contact interaction, 124, 257 Fermi contact shifted resonances, heteronuclear COSY studies, 4-6, 9 Ferredoxin A z o t o b a c t e r oinelandii, redox-aetive center, voltammetry, 489-493 CIostridium pasteuranium, redox-active center, voltammetry, 490-492 Desulfovibrio africanus, redox-active center, voltammetry, 489-490, 497 2(4Fe-4S), 2D NMR spectroscopy, 14 iron-sulfur clusters in, EPR, 343-344, 365,367-368 parsley, mixed-valence binuclear iron complex, EPR spectra, 367 P s e u d o m o n a s putida, expression in Escherichia coli, in vivo quantitation, 380-381 Thermodesulfobacterium c o m m u n e ,
redox-active center, voltammetry, 490-493 two-dimensional NMR spectroscopy, 14 Ferredoxin II, Desulfovibrio gigas iron-sulfur cluster, multifield saturation ma~,nOization studies, 461-462 M6ssbauer and EPR spectroscopy, 472476 Ferricytochrome b562, 2D NMR spectroscopy, 14 Ferricytochrome c horse heteronuclear COSY spectrum, 5 lanthanide-induced shift studies, 62
620
SVBJECa" INDEX
metal site accessibility studies, 271 paramagnetic NMR shift and/or relaxation agents for, 74-75 surface, lanthanide-induced shift studies, 74-75 Ferricytochrome c', high-spin, 15 Ferricytochrome c"
Glutamine synthetase, adenylylated, lanthanide-induced shift studies, 46 Glyceraldehyde-3-phosphate dehydrogenase, lanthanide-induced shift studies, 62 GUPIXE software, 568 Gyromagnetic ratio, 333
Methylophilus methylotrophus
NOESY spectrum, 10 TOCSY spectrum, 4 proton exchange studies, 14 Ferritin electron paramagnetic resonance, 369 EPR/ENDOR/ESEEM, with VO 2+ electron spin probes, 235 FETEM, see Transmission electron microscope, filtered electron Fixation, biological specimens for localization of metal atoms, 535-541 Flash photolysis, 522-523 Flavin derivative, as solute for selective reducing radical generation, 527 Flavocytochrome b2, electrochemistry, 513 Flavocytochrome c55z, electrochemistry, 513 Fluorescence-detected magnetic resonance spectroscopy, 296, 298-302 in photosynthesis, 321-322 Fluorine-19, in NMR measurement of cell membrane potential, 103 Forward scattering analysis, 569 Freeze-drying, 538 Freeze quenching, rapid, 347
G Gadolinium Cj for, 51 Gd(III) nuclear relaxation, 55 as structural probe, 44-45, 47, 57-62 spin expectation value, 51, 53 Galactose oxidase, electrochemistry, 513 Gamma ray emission, particle-induced, 570-571 instrumentation, 573 Glucocorticoid receptors, lJ3Cd-substituted, 1~3Cd NMR chemical shifts, 2021 D-Gluconate dehydrogenase, Pseudomonas fluorescens, electrochemistry, 513,521
H Heliobacterium chlorum, reaction center,
triplet-minus-singlet absorbance difference spectroscopy, 328 Helium-3, interaction with matter, 565566 Heme axial ligands, protons in, assignment, 14 redox potential, structural control, 14 Heme cavity, proton exchange studies, 14 Heme proteins ENDOR spectroscopy, 191 oxidation state changes, multidimensional NMR studies, 282 two-dimensional NMR spectroscopy, 14 Hemoglobin, R- and T-states, EPR spectroscopy, 365-366 Hemosiderin, EPR analysis, 369 Heteronuclear multiple quantum correlation spectroscopy IH-mCd, 34-37 via heteronuclear single quantum coherence, for metal environment studies, 256 Histidine, 14N ENDOR with VO ~+ electron spin probes, 239, 241 HIV, see Human immunodeficiency virus HMQC, see Heteronuclear multiple quantum correlation spectroscopy Holmium Cj for, 51 spin expectation value, 51, 53 Homonuclear Hartmann-Hahn spectroscopy, 246 Horseradish peroxidase adsorbed on electrodes, as biosensor, 516-518 nuclear magnetic resonance multidimensional, paramagnetic metal ion studies, 259-261 two-dimensional, 15
SUBJECT INDEX HS-ENDOR, s e e Electron nuclear double resonance spectroscopy, hyperfine selective HSQC spectroscopy, s e e Correlation spectroscopy, heteronuclear, via heteronuclear single quantum coherence Human immunodeficiency virus, nucleocapsid protein, ~t3Cd-substituted, u3Cd NMR chemical shifts, 20-21 Hydrogen, s e e Deuterons; Protons Hydrogenase CIostridium p a s t e u r a n i u m
H cluster, 168 Davies ENDOR spectrum, 184 ENDOR-induced SE/EPR spectra, 186-189 pulsed double ENDOR, 184-185 iron-sulfer cluster active site, ESEEM-edited ENDOR spectroscopy, 171-172 oxidized form combined ESEEM and pulsed ENDOR spectroscopy, 168-170 ENDOR-edited ESEEM, 173-176 HS-ENDOR spectra, 180-181 electrochemistry, 513 /z-Hydroxybis(tz-carboxylato)divanadium(lll) complex, magnetic susceptibility, 432-434 Hydroxyl radicals, production by pulse radiolysis, 525 Hyperfine shifts, in paramagnetic systems, 12, 15 Hyperfine splittings, 119-120
I Imidazole, 14N ENDOR with VO 2+ electron spin probes, 239, 241 INEPT, s e e Insensitive nuclei enhancement by polarization transfer Inorganic pyrophosphatase, H3Cd-substituted, NaCd NMR chemical shifts, 2021 Insensitive nuclei enhancement by polarization transfer, 265-267 Insulin, EPR with VO 2+ electron spin probes, 235
621
Integer spin systems, M6ssbauer spectra, 464 Intersystem crossing, 291-292 Iron centers in metalloproteins binuclear oxygen-bridged, EPR properties, 367-369 redox potential, in EPR spectroscopy, 360 chemistry, relationship to magnetic properties, 357-359 coordination geometry, in EPR spectroscopy, 360 d electron energy levels and electron distributions, in octahedral and tetrahedral coordination, 357-358 electron paramagnetic resonance, 360369 isotope-enriched samples for, 359 spectra, identification, 359 Fe(IIl), electron paramagnetic resonance high-spin, 337-339, 355-356, 358-359, 361-364 low-spin, 337-339, 360-361 heine magnetic axes, orientation, 14 structure, 15 ligand type, EPR spectroscopy, 360 oxidation states, 357 polynuclear, EPR properties, 369 quantitation, in EPR spectroscopy, 359360 in redox-active proteins, 281 Iron complexes, EPR spectroscopy, 353384 Iron-oxo proteins, integer spin EPR spectroscopy, 478 Iron proteins electron paramagnetic resonance spectroscopy, 353-384 even-spin systems, 379 high-spin systems, 378-379 low-spin systems, 377 in vivo studies, 380-384 in whole cells, signal quantitation, 380 high-potential, ENDOR spectroscopy, 224 Iron-sulfur clusters antiferromagnetic coupling in, 343-344 electron paramagnetic resonance, 365368
622
SUBJECT INDEX
in ferredoxins electron paramagnetic resonance spectra, 343-344 types, 343 redox-linked activities, voltammetric studies, in metalloproteins adsorbed on electrodes, 485-486 in oivo quantitation, 380-381 Iron-sulfur proteins ENDOR spectroscopy, 191 high-potential Chromatium vinosum, EPR spectrum, 344 iron-sulfur clusters in, EPR spectrum, 365-368 two-dimensional NMR spectroscopy, 14 metal center coupling in, 343 with S = ½, continuous wave ENDOR studies, 223-225 1SC, see Intersystem crossing 1SECR-COSY, 8-9 Isoleucyl tRNA synthetase, lanthanideinduced shift studies, 46 K Kinases, lanthanide-induced shift studies, 56 L Laccase, electrochemistry, 513, 516 c~-Lactalbumin calcium-binding, 43Ca NMR spectroscopy, 118 competition binding studies, 47 lanthanide-induced shift studies, 78 Lactoferrin, EPR/ESEEM with VO 2+ electron spin probes, 235 Langevin formula, 415 Lanthanide complexes axial symmetry assumption for, 52, 5960, 77-78 as extrinsic probes, for EPR, 391 formation, kinetics, 55 isostructuralit.y, 45 Lanthanide-induced shift, 49-54 in biological macromolecules, 56-77 in Ca:+-binding proteins, 67-73, 78 contact shift, 49, 53
diamagnetic complex formation shift, 49-50 dipolar shift, 49-52 in hen egg white lysozyme, 56-62 in Mg2+-ATP-dependent phosphoglycerate kinase, 62-69 in parvalbumin, 67-73 Lanthanide ions Cj for, 51-52 ionic radii, 46 paramagnetic nuclear magnetic resonance effects, basic theory, 47-56 nuclear relaxation rates, 54-56 replacement of naturally occurring ion functional, 46 isomorphous, 46 as spectroscopic probes, applications, 46-47 spin expectation values, 51, 53 as structural probes, 45-47 Lanthanide shift reagents, 43-78; see also specific reagent
with alkali metal NMR, 88-93 applications, 44, 77-78 for "3Ca studies, 115 Lewis acid behavior, 44 non-S-state, nuclear relaxation, 55 Lanthanum(Ill), as structural probe, 47, 49 Larmor frequency electron, 124 nuclear, 124-125 Lipoxygenase EPR spectroscopy, 363 nitrosyl, EPR spectroscopy, 365 Lithium in biological samples, distribution and transport studies, 90-93 interactions with red blood cell membrane, probe for, 101-102 6Li, in NMR, 80-82, 90-93 7Li, in NMR, 81-82, 84-86, 90-96, 99103 natural abundance, 78 neutron capture radiography, 560, 562563,565 physiological and pharmacological importance, 79 Lithium salts, 6Li-enriched, source, 82 Lowicryl resin, properties, 539 Lutetium(Ill), as structural probe, 47, 49
SUBJECT INDEX
Lysozyme amino acid and cofactor triplet states, optically detected magnetic resonance studies, 318 calcium-binding, 43Ca NMR spectroscopy, 118 hen egg white 13C NMR, 61-62 lanthanide-induced shift studies, 56-62 lanthanide(III) ions in, proton shift and relaxation data for, 58, 60 physicochemical properties, 56-57 X-ray crystal structure, 57 and experimental NMR data, comparison, 58, 61 triply point-mutated, from bacteriophage T4, amino acid and cofactor triplet states, optically detected magnetic resonance studies, 318 Lysyl oxidase, electrochemistry, 513
M Magic angle spinning techniques, 18, 41, 43 Magnesium, replacement by lanthanide shift reagents, 46 Magnetic susceptibility, 412-436 alkali metal nuclei, 105-106 bulk, in superconducting magnets and electromagnets, sign and magnitude, 105-106 definition, 412-415 examples, 431-436 measurement, theoretical aspects, 424431 porphyrin radical complexes, 434-435 relaxation term, 55 spin-frustrated copper(II) trimer, 434436 St = $2 = 1 dimer, 432-434 susceptometer, 415-423 data acquisition, 421-423 magnetic property measurement system, 419-421 superconducting quantum interference device, 415-418 Magnetic susceptibility tensor, for lanthanide-protein derivatives, 50, 6972, 78
623
Manganese Mn(II), EPR, 337-339 in redox-active proteins, 280 Manganese-superoxide reductase, Thermus thermophilus, saturation magnetization, 441-446 MAS, see Magic angle spinning techniques McConneU relation, 214-216 2-Mercaptoethanol, in metal ion exchange procedures, 23 Metal atoms, location in biological systems, physical methods, 535-586 sample preparation for, 535-540 cryomethods, 536-539 precipitation methods, 539-540 Metal force fields, in molecular dynamics simulations, 285-290 Metalloenzymes active site structure, alkali metal NMR spectroscopy, 87 alkali metal NMR, 84-87 cadmium substitution, 17 electrochemistry, 501-522 direct studies, 515-521 indirect studies, 509-515 monovalent and divalent cations in, distance between, measurement, 87 phosphate-binding, ~3Cd NMR, t~3Cd3tp scalar coupling, 41-42 Metalloproteins adsorbed on electrodes, redox-active centers redox status, control of, 482 sample economy, 482 voltammetric studies, 479-500 cadmium substitution, 22 H3Cd-substituted 113Cd-113Cd scalar coupling in, 31-33 chemical shifts, 19-21 NMR spectroscopy ~13Cd, solid-state, 43 heteronuclear techniques, 33-43 electron nuclear double resonance spectroscopy, 153-164 metal environments mobility, NMR spectroscopy, 271280 structure, NMR spectroscopy studies, 254-271 paramagnetic metal ions, 256-263 pH effects, 254-256
624
SUBJECT I N D E X
monovalent and divalent cations in, distance between, measurement, 87 multifield saturation magnetization studies, 437-463 nuclear magnetic resonance spectroscopy alkali metal, 84-87 mCd, 16-43 paramagnetic, 2D NMR spectroscopy, 1-16 survey of achievements in, 13-15 redox centers, imaging, 489-492 Metallothionein Cd 2+ cluster sites, 31 H3Cd NMR spectroscopy, 25 ll3Cd-~H scalar coupling, 33, 37 with proton decoupling, 29 T~ and NOE data for, 26 mCd-substituted, mCd NMR chemical shifts, 19-21 mammalian, mCd NMR, 32-33 structure, 2D NMR spectroscopy, 267268 Metallothionein i, crab, mCd NMR, 31-32 Metal site, accessibility, NMR spectroscopy, 271 Methane monooxygenase binuclear oxygen-bridged iron clusters, EPR, 368-369 hydroxylase component, Fe3+-Fe 3÷ cluster, integer spin EPR spectroscopy, 467-468, 477-478 Methylococcus capsulatus, mixedvalence binuclear iron complex, EPR spectra, 367 Methemoglobin, EPR signal quantitation, 382-383 Methyl viologen, as solute for selective reducing radical generation, 527 Metmyoglobin electron paramagnetic resonance spectroscopy, 361, 364 in heart, EPR signal quantitation, 382383 horse heart, EPR spectroscopy, 377, 379 MIA, see Microwave-induced absorbance Microscopy, see also specific techniques Microwave-induced absorbance, 307, 317 Microwave-induced delayed luminescence, 302
Microwave-induced delayed phosphorescence, 302, 304 Microwave-induced fluorescence, 307, 317 Microwave-induced phosphorescence, 307, 317 MIR, see Modified inversion recovery MLEV sequences, 9 Modified inversion recovery, 93-96, 104105 Molecular dynamics simulations, in analysis of metalloproteins, 285-290 Molybdenum Mo(V) electron paramagnetic resonance, 336337 intermediates and model complexes, EPR spectra, 348-351 in redox-active proteins, 281 M6ssbauer spectroscopy and integer spin EPR, combination, 463479 Desulfovibrio gigas ferredoxin II, 472-476 non-Kramers systems, 465-472 spectra in limit A = 0, 476-478 multifield saturation magnetization studies after, 437-438, 463 Multifield saturation magnetization, metalloproteins, 437-463 applications, 437 background signals, 438,449-453 from ferromagnetic impurities, 438, 452 from paramagnetic molecular oxygen dissolved in air-saturated water, 43~. 451 from spin I = ½nuclei, 438, 450-451 Brillouin curves for, 438-440 Curie law slopes at high temperature, 439-440 data, 441-443 data analysis, 454-462 single spin fits, 460 two-spin fits, 460-462 equipment, 443-449 fitting software for, 449, 45~-4sa multi-instrument sample holder for, 452453 resolution, 437-438, 443-447 sensitivity, 438
SUBJECT INDEX spin Hamiltonian, 440-441 theoretical saturation magnetization curves, 441 theory, 438-440 zero-field splitting, 440-441 Myoglobin heine vinyl substituents, orientation and mobility, 14 structure, 15 Myosin light chains, lanthanide-induced shift studies, 73 subfragment S l, surface, lanthanideinduced shift studies, 74
N NADH dehydrogenase, iron-sulfur clusters, EPR spectroscopy, 383 NADPH dehydrogenase, ENDOR spectra, 190-191 1,4-Naphthosemiquinoneanion radical, EPR and ENDOR spectra, 210-211 Neodymium Cj for, 51 spin expectation value, 51, 53 as structural probe, 58 Nernst plot, spectroelectrochemical data, 403 -404 Neutron capture radiography, 559-564 detectors, 561,564 neutrons for, sources, 563 performance, 562-564 principle, 559-560 Nickel(IlL electron paramagnetic resonance, 340 Nitrate reductase, electrochemistry, 513 Nitrile hydratase, EPR spectroscopy, 363 Nitrite reductase electrochemistry, 513 EPR spectroscopy, 361,364 Nitroaryl compounds, as solutes for selective reducing radical generation, 527 Nitrogenase A z o t o b a c t e r vinelandii
integer spin EPR spectroscopy, 476, 478 molybdenum-iron cofactor, ENDOR spectroscopy, 229-230 integer spin EPR spectroscopy, 478
625
Klebsiella p n e u m o n i a e , integer spin EPR
spectroscopy, 476, 478 P cluster in state W x, M/Sssbauer and EPR spectroscopy, 465,467-468, 476-478 X a n t h o b a c t e r autotrophicus, integer spin EPR spectroscopy, 476 Nitrosyl complexes, ferrous, EPR, 363366 Nitrosyl iron-sulfur complex, EPR spectroscopy, 365-366 Nitrous oxide reductase, P s e u d o m o n a s stutzeri, multifield saturation magnetization studies, 454-460 NMRD, see Nuclear magnetic resonance dispersion NOE, see Nuclear Overhauser effect NOESY, see Nuclear Overhauser effect spectroscopy Non-Kramers systems, M6ssbauer and EPR spectroscopy, 464-472 N-type selection, 7-8 Nuclear magnetic resonance dispersion, 270 Nuclear magnetic resonance spectrometer for 43Ca studies, 1t4 Fourier transform, 80 Nuclear magnetic resonance spectroscopy alkali metal, 78-106 applications, 79-80 biological applications, 83, 88-102 precautions, 102-106 in cell suspensions and perfused organs, 88-102 chemical shifts, 82, 86 information content, 97-102 intracellular signals, double-quantum coherence transfer pulse sequence for, 97 Lorentzian lineshape, 84 magnetization transfer method, 96-97 in metalloenzymes, 84-87 in metalloproteins, 84-87 modifed inversion recovery method, 93-96, 104-105 nuclide properties, 80-82 nuclide receptivity, 80-82 relaxation rates and times, 83-84 shift reagent method, 88-93, 104 average spectral density, 120 43Ca, 107-118
626
SUBJECT INDEX
applications, 107, 115-118 chemical exchange effects, 111-113 rate determination, 117 chemical shift range, 109 correlation time, determination, 117 electric quadrupole moment effects, 108-109 macromolecular interaction studies, 116 quadrupole coupling constant determination, 117 relaxation rates in absence of chemical exchange, 109-111 sample preparation, 114 spectra acquisition, 114 spectrometers, 114 ll3Cd, in metalloproteins, 16-43 chemical shifts, 18-21 instrumentation, 22 in metalloproteins, 16-43 chemical exchange effects, 29-31 diamagnetic metal ion experiments, 263, 265 sample preparation, 21-23 sensitivity, 17-18 solid-state, in H3Cd proteins, 41, 43 chemical exchange effects, 47-49 chemical shifts, 49-54 cross-relaxation, 278-279 ]33Cs advantages, 106 applications, 84 chemical shifts, 88, 98 precautions, 102 in red blood cell suspensions, intraand extracellular resonances, 90, 92 shift reagent method, 90-93 and electron paramagnetic resonance, combination, 119 19F, in measurement of cell membrane potential, 103 four-dimensional, 247 ~H, multidimensional high-resolution, 118 39K, 102 applications, 84 properties, 81 in red blood cell suspensions, 90 shift reagent method, 90-93
6Li properties, 80-81 receptivity, 82 in red blood cell suspensions, 90 shift reagent method, 90-93 7Li, 102 advantages, 106 applications, 84-86 ionophore-induced alkali metal ion transport monitoring studies, 99101 modified inversion recovery method, 94-96 nuclear relaxation times, in alkali metal ion binding to cell membrane0 101 properties, 81 receptivity, 82 in red blood cell suspensions, 90-91 shift reagent method, 90-93, 103 metal environment studies, 254-271 metalloproteins amide proton exchange rate determination, 275-278 conformational equilibria, 274-275 extrinsic ligand studies, 269-271 heteronuclear techniques, 33-43 "3Cd-13C scalar coupling, 37-40 lI3Cd-IH scalar coupling, 33-37 N3Cd-]SN scalar coupling, 40-41 H3Cd-3tP scalar coupling, 41-42 limitations, 245 metal force fields, 285-290 molecular dynamics simulations, 285290 oxidation state change studies, 280285 saturation transfer experiment, oxidation state change studies, 281282 T~ and T~ measurements, in oxidation state change studies, 282-285 multidimensional diamagnetic metal ion studies, 263269 paramagnetic metal ion studies, 256263 with ~'s values of 10"8-10-9 sec, 261264 with ~'s values of 10-tI-10 -13 sec, 258-261
SUBJECT INDEX as probe of metal environment, 24429O 23Na, 102 ionophore-induced alkali metal ion transport monitoring studies, 99101 properties, 81 receptivity, 82 in red blood cell suspensions, 90 relaxation times, 102 shift reagent method, 90-93 one-dimensional, 245 paramagnetic metalloproteins, 1, 16 ~70, small molecules, 271 3tp, in measurement of cell membrane potential, 103 pH titration experiments, 254-256 protein structure studies, 245-253 J coupling in, 246 nuclear Overhauser effects in, 246 quadrupolar nuclei, 114 87Rb precautions, 102 properties, 81 receptivity, 82 in red blood cell suspensions, 90 shift reagent method, 90-93 relaxation rates, measurement, 278-280 small molecules, 270-271 spin I = ½nuclei, 114 three-dimensional, 245,247 two-dimensional, 245-246 advantages, 16 effective sensitivity, 6 paramagnetic metalloproteins, 1-16 time scale for, 2 and X-ray diffraction, comparison, 245 Nuclear microprobe analysis, 565-575 instrumentation, 572-573 microanalytical methods for, 566-572 nuclear reaction analysis method, 570572 particle-induced X-ray emission, 566568 scattering analysis method, 568-570 Nuclear Overhauser effect, 2, 8-9, 246, 279 detection, 10-11 one-dimensional experiment, 6 Nuclear Overhauser effect spectroscopy, 2-3, 6, 10-11, 15
627
applications in paramagnetic systems, 12-13 cross-peaks, 10-11 paramagnetic metal ion studies, 259-261 for protein structure studies, 253 protein-substrate complex, 269 two-dimensional, 246 cross-peaks for amide protons in presence of nitroxides in DzO, 77 Nuclear quadrupole interaction, 127 Nuclear reactions, 558 with charged particles, tracks, in metal detection, 564-565 nuclear microprobe analysis, 570-572 tracks, detection, 558-565 Nuclear relaxation, 278-279 O Optically detected magnetic resonance spectroscopy absorbance-detected, s e e Absorbancedetected magnetic resonance spectroscopy applications to protein research, 316-329 decay curves, simulation, 304 double resonance, 305-307 fluorescence-detected, s e e Fluorescencedetected magnetic resonance spectroscopy hole burning, 305-307 instrumentation, 312-316 line shape, 305 metalloproteins, prospects for, 329-330 microwave switching under continuous illumination, 303 phosphorescence-detected, s e e Phosphorescence-detected magnetic resonance spectroscopy phosphorescence detection, 304 in photosynthesis, 320-329 populating probabilities, 303-305 principles, 295-316 quantitative description, 297-305 pitfalls, 304-305 response to onset of illumination, 303 slow-passage, 298-299 in absence of microwaves, 298 with saturating microwaves, 298-299 time dependence, 297-298 transient, 299-303
628
SUBJECT INDEX
average decay rate, determination, 300-303 with no optical excitation, 301-303 saturating microwaves in onset, 301 recovery from, 301-302 triplet states in proteins, 290-330 amino acid and cofactor studies, 318320 energy transfer, 319-320 heavy atom effects, 319 linear dichroic triplet-minus-singlet absorbance difference spectroscopy, 309-312, 324-329 optical microwave double resonance spectra, 307-312 triplet-minus-singlet absorbance difference spectra, 308-309 Ovotransferrin, EPR with VO 2+ electron spin probes, 235 Oxygen-17, in NMR studies of small molecules, 271
P Pancreatic trypsin inhibitor basic, lanthanide-induced shift studies, 62 bovine, structure, NMR studies, 253 Parallel electron energy loss spectrometry, 550-552 Paramagnetic metal ions nuclear magnetic resonance spectroscopy, 256-264 in protein center, functional mechanism, 13 Paramagnetic probes for metal cluster investigations, 384-395 secondary, for biological metal cluster investigations, 384-395 Paramagnetism, 119, 256-264, 331-333, 354 measurement, multifield saturation magnetization technique, 437-463 Parvalbumin CD domain, 67 competition binding studies, 47 EF domain, 67-73 lanthanide-induced shift studies, 67-73 nuclear magnetic resonance spectroscopy
alkali metal, 86 43Ca, 117 .3Cd chemical shifts, 20-21 solid-state, 41, 43 physicochemical properties, 67 PDMR, see Phosphorescence-detected magnetic resonance spectroscopy PEELS, s e e Parallel electron energy loss spectrometry PENMR, s e e Pulsed electron nuclear multiple resonance spectroscopy Peroxidase, electrochemistry, 513 L-Phenylalanine phosphoramidate phenyl ester, bound to "3Cd-carboxypeptidase A, 3~p NMR, "3Cd-3~P scalar coupling, 42 Phosphoglucomutase, alkali metal NMR spectroscopy, 86 Phosphoglycerate kinase, Mg2+-ATP dependent active site probe, 62-69 ATP-binding sites, 64 competitive inhibition by lanthanides, 64 lanthanide-induced shift studies, 62-69 nucleotide binding in solution 31p NMR studies, 63 proton NMR studies, 63 surface, lanthanide-induced shift studies, 74 yeast active site, 62-63, 68-69 properties, 62 X-ray crystal structure, 62-63 Phospholipase A2 calcium affinity determination, 115 lanthanide-induced shift studies, 78 Phosphorescence-detected magnetic resonance spectroscopy, 296, 299, 3 0 1 - 3 0 2 Phosphorus-31, in NMR measurement of cell membrane potential, 103 Photolysis, flash, s e e Flash photolysis Photosynthesis, optically detected magnetic resonance studies, 320-329 PIXAN software, 568 PIXE, s e e X-ray emission, particle-induced Plastocyanin "3Cd NMR spectroscopy chemical shifts, 20-21 T~ and NOE data for, 26
SUBJECT INDEX -cytochrome c complexes, electrochemistry, 506-507 French bean, structure, NMR studies, 247, 251 molecular dynamics simulations, 288289 multidimensional NMR diamagnetic metal ion experiments, 265 oxidation state change studies, 282283 Porphyrin radical complexes, magnetic susceptibility, 434-435 Potassium 39K, in NMR, 81, 84, 90-93, 102 natural abundance, 78 physiological and pharmacological importance, 79 Potassium ferricyanide EPR signal, 372 as oxidant of protein redox systems, 407 Potentiometry, redox, s e e Redox potentiometry Praseodymium Cj for, 51 spin expectation value, 51, 53 Precipitation, metal cations, 539-540 Proteins binding sites, 113Cd at, spin-lattice relaxation times, 26 Ca:÷-binding intestinal, competition binding studies, 47 lanthanide-induced shift studies, 6773, 78 DNA-binding, cadmium substitution, 17 gene 32, 113Cd NMR spectroscopy chemical shifts, 20-21 T1 and NOE data, 25-26 iron-containing, s e e Iron proteins iron-sulfur, s e e Iron-sulfur proteins lanthanide-induced shift studies, 56 Mn2+-substituted, alkali metal NMR spectroscopy, 87 structure, nuclear magnetic resonance spectroscopy studies, 245-253 surface, lanthanide-induced shift studies, 73-77 testicular S-100-1ike, EPR with VO 2+ electron spin probes, 235
629
Proton relaxation enhancement, 270 Protons amide, exchange rates, determination by multidimensional NMR, 275-278 interactions with matter, 565-566 NMR properties, 80-81 P-type selection, 8 Pulsed electron nuclear multiple resonance spectroscopy, 118-189 advantages, 119 double resonance, s e e Electron nuclear double resonance spectroscopy experimental considerations, 143-153 instruments for, 143-153 microwave transmitter design, 148 probes, 148-150 radio frequency transmitter for, 150152 samples concentration, 147 volume, 146-147 sensitivity, 147 spectrometer, 144 temperature for, 145-146 time scales, 144-145 Pulse radiolysis, 522-534 in analysis of intermediate oxidation states of metal ions in metalloproteins, 523 dosimetry, 529-530 electron transfer studies, 523 inductive beam monitor for, 529-530 long-range electron transfer study, in proteins, 532-534 oxidizing radical production, 525526 principle, 522 radiation chemical basis, 524-525 redt~cing radical production, 526527 secondary emission chamber for, 52953O selective probe technique, 523 solution preparation and handling, 530532 technique, 527-534 time resolution, 522 Pyridine, t4N ENDOR with VO 2+ electron spin probes, 239, 241 Pyruvate kinase, alkali metal NMR spectroscopy, 84
630
SUBJECT INDEX
Q Quadrupolar splittings, 109 Quadrupole coupling constant, 109 Quadrupole interactions, 335-336 Quadrupole relaxation, 266 Quinone, as solute for selective reducing radical generation, 527
R Radiolysis, pulse, see Pulse radiolysis Rat, tissues, EPR, detection of iron proteins, 382 Reaction centers absorbance-detected magnetic resonance spectroscopy studies, 322-324 bacterial absorbance difference spectroscopy studies, 325-329 structure, 320 linear dichroic triplet-minus-singlet absorbance difference spectroscopy studies, 324-329 plant, absorbance difference spectroscopy studies, 325-329 triplet-minus-singlet absorbance difference spectroscopy studies, 324, 326-327 Redox-active centers, in metalloproteins adsorbed on electrodes, voltammetric studies, 479-500 Redox potentiometry electrochemical equations in, 402-404 and spectroscopy, see Spectroelectrochemistry Relaxation rates, in absence of chemical exchange, 109-111 Relaxation times T~, "3Cd at protein binding sites, 26 1"1 and/'2, 7Li loaded in red blood cells, 101-102 Relaxometry, 270 Resonator loop-gap, 150, 202,219 bridged, 150 for LD-ADMR and ADMR, 313-314 slotted tube, 150 Rhodobacter capsulatus, light-harvesting complexes, fluorescence-detected magnetic resonance spectroscopy, 321
Rhodobacter sphaeroides photosynthetic system, fluorescencedetected magnetic resonance spectroscopy, 321-322 triplet state, electron-electron double resonance spectrum, 306 Rhodopseudomonas viridis, reaction center fluorescence-detected magnetic resonance spectroscopy, 322-323 triplet-minus-singlet absorbance difference spectroscopy, 324-328 Ribonucleotide reductase binuclear oxygen-bridged iron clusters, EPR, 368-369 pulse radiolysis study, 528-529 Rieske clusters, EPR, 343,367-368 RNA, transfer, lanthanide-induced shift studies, 56 ROESY, 11-12 applications in paramagnetic systems, 13 tH, water, 270 cross-peaks, 11-12 for protein structure studies, 253 Rubidium natural abundance, 78 physiological and pharmacological importance, 79 Rubredoxin electron paramagnetic resonance spectroscopy, 363-364 integer spin, 478 iron-sulfur clusters, EPR, 368
S Samarium Cj for, 51 spin expectation value, 51, 53 Scanning electron microscope, 542 Scanning electron microscopy, in nuclear microanalysis, 575 Scanning transmission ion microscopy, 575 Scattering analysis, 569-570 instrumentation, 573 Secondary ion mass spectrometry microscopy analytical image quality, 580-582 biological applications, 575-576, .584-585 depth profiling, 583-584 digital imaging processing for, 579-580
SUBJECT INDEX image acquisition time, 581 image quantification, 582-583 instrumentation, 578-580 metallic elements, sputtering process, 577 minimal metal concentrations for, 580581 principle, 576 specimen preparation for, 538 three-dimensional imaging, 583-584 SEM, s e e Scanning electron microscope; Scanning electron microscopy Serum, EPR spectroscopy, 383 SIMS, s e e Secondary ion mass spectrometry microscopy Sodium interactions with red blood cell membrane, probe for, 102 23Na, in NMR, 81-82, 90-93, 99-102 natural abundance, 78 physiological and pharmacological importance, 79 Sodium dithionate as potentiometric titrant, 406 properties, 372-373 as reductant of protein redox systems, 406-407 Solomon-Bloembergen equations, 54, 87 Spectroelectrochemistry, EPR methods, 396-41 l applications, 396-397 cells for, 397-400 standard design, 398-400 with visible capability, 401 data, Nernst plot, 403-404 oxidation methods, 406-407 redox mediator titrants and indicators, 404-406 reduction (oxidation) methods, 406407 Spectrometers double focusing, 579 electron energy loss, 550 electron nuclear double resonance spectroscopy, 152-153 electron paramagnetic resonance, 345347, 369-370 energy dispersive, 542, 546-547 nuclear magnetic resonance for 43Ca studies, ll4 Fourier transform, 80
631
for pulsed electron nuclear multiple resonance spectroscopy, 144 quadrupole mass filter, 579 time-of-flight, 579 wavelength dispersive, 542, 545-547 X-ray, 545-547 Spin Hamiltonian formalism, 123-125, 211-218, 334-336, 424-425 anisotropic parameters, determination, 348-353 Heisenberg-Dirac-van Vleck, 426 for M6ssbauer and EPR spectroscopy, 465 for multifield saturation magnetization, 440-441 for St = $2 = 1 dimer, 426-432 for vanadyl(IV) EPR spectra, 232-233 in zero magnetic field, 293-295 Spin-lattice relaxation, 334 SQUID susceptometer, s e e Superconducting quantum interference device susceptometer SRS project, synchrotron radiation-induced X-ray fluorescence microprobe, 556-557 SRXRF, s e e Synchrotron radiation-induced X-ray fluorescence Stellacyanin 113Cd NMR spectroscopy chemical shifts, 20-21 T~ and NOE data for, 26 electron spin echo detected EPR, 153155 ENDOR spectra, 153-161, 190-191 Cu nuclei, 162-164 Davies, 137, 154-164 Mires, 137, 156-158 nutation of sublevel magnetization, 138-139 proton and nitrogen hyperflne coupling assignment, 154-161 transient nutation patterns showing Rabi oscillation frequencies, 139140 ENDOR spectroscopy, 226 high-pH form, copper coordination structure, 153-154 HS-ENDOR spectra, 178-180 metal environment, multidimensional NMR studies, diamagnetic metal ion experiments, 265
632
SUBJECT INDEX
paramagnetic metal ion studies, 259 physicochemical properties, 153 STEM, s e e Transmission electron microscope, scanning Sternheimer antishielding factor, 81-82 STIM, s e e Scanning transmission ion microscopy Succinate dehydrogenase, electrochemistry, 513,521 Sulfide:cytochrome-c oxidoreductase, C h r o m a t i u m v i n o s u m , electrochemistry, 521 Sulfite oxidase, electrochemistry, 513 Superconducting quantum interference device susceptometer, 415-418, 443449 magnetic property measurement system, 416 data acquisition, 421-423 experimental conditions for, 421 sample holder, 419-420 Superconducting quantum interference magnetization measurements, principles, 415-418 Superexchange coupling, 342 Superoxide dismutase H3Cd NMR spectroscopy chemical shifts, 20-21 I"1 and NOE data, 26 Cu(II)2,Zn(II)2-, oxidized form, NMR spectroscopy, 15 Synchrotron radiation, in elemental analysis, 554-556 Synchrotron radiation-induced X-ray fluorescence analysis, 553-558 microprobes, 556-558
T Tb(DOTP)5-, interaction with bacteriophage fa ssDNA-binding gene 5 protein, ~3C NMR study, 74-76 Terbium Cj for, 51 spin expectation value, 51, 53 Tb(III), as structural probe, 47 Thioredoxin, metal environment, multidimensional NMR studies, pH titration experiments, 256
Thulium Cj for, 51 spin expectation value, 51, 53 Tm(DOTP)5-, 88-93, 103 preparation, 89 TOCSY, s e e Total correlation spectroscopy, two-dimensional Total correlation spectroscopy, two-dimensional, 3-4, 9, 246 applications, in paramagnetic systems, 12-13 dispersion mode, 8-9 principle, 8 Transcription factors GAL4 Ix3Cd NMR, 33, 269 ~I3Cd-~H scalar coupling, 33, 35-37 chemical shifts, 19-21 Tt and NOE data, 25-26 Cd 2÷ clusters, 31 structure, 2D NMR spectroscopy, 269 LAC9, 113CdNMR chemical shifts, 2021 Transferred hyperfine interaction, 124 Transferrin 65Cu-substituted, copper ENDOR spectroscopy, 227-228 electron paramagnetic resonance spectroscopy, 363 ENDOR spectroscopy, 230-231 EPR/ENDOR/ESEEM with VO 2+ electron spin probes, 235 lanthanide-induced shift studies, 78 Transition metal ions, EPR, 332-345 Transition metals, sites in metalloenzymes and proteins, 119 Transmission electron microscope biological applications, 553 conventional, 542, 550 filtered electron, 543 scanning, 542, 550 Traveling wave tube amplifier, 144, 148 Triple resonance spectroscopy, 206-207 General scheme, 182-183,206-207, 217218 Special scheme, 182, 206-207, 218 Triplet-minus-singlet absorbance difference spectra, 307-309 Triplet-minus-singlet absorbance difference spectroscopy, linear dichroic, 309-312 instrumentation, 315-316
SUBJECT INDEX
Triplet states linear dichroic triplet-minus-singlet absorbance difference spectroscopy, 309-312 instrumentation, 315-316 physics, 291-295 in proteins, optically detected magnetic resonance, 290-330 spin Hamiltonian, in zero magnetic field, 293-295 Tris-HCl, in metal ion exchange procedures, 22-23 Tris-HCl-acetate, in metal ion exchange procedures, 22-23 Troponin C 43Ca NMR, 117 It3Cd NMR, chemical shifts, 20-21 lanthanide-induced shift studies, 73 Tumor cells, Friend leukemia, synchrotron radiation-induced X-ray fluorescence analysis, 555 Tungsten in redox-active proteins, 281 W(V), EPR, 336-337
U Ubiquinone reductase, iron-sulfur clusters, EPR spectroscopy, 383 Ultracryosectioning, 536 Uricase, coimmobilized with horseradish peroxidase, as biosensor, 518 Uteroferrin, NOESY spectra, 15
V Vanadium in redox-active proteins, 280 V(IV), EPR, 336-337 Vanadyl(IV) ENDOR/ESEEM spin probes, 232-244 physicochemical properties, 232 Voltammetry, metalloprotein redox-active centers advantages, 481-484 analysis and interpretation, 489-500 instrumentation, 486-488 in kinetic analysis of coupled processes, 484 kinetic data, extraction, 497-500
633
optimal conditions, 484-485 with rapid coupled reactions, 496 sensitivity to active site-exogenous reagent interactions, 484 with slow coupled reactions, 492-496 in visualization and quantitation of redox activities, 485-486 waveform analysis, 482-483 W WALTZ16 sequences, 9
X Xanthine oxidase coimmobilized with horseradish peroxidase, as biosensor, 518 dipole-dipole coupling in, 342 electrochemistry, 513 95Mo-enriched, EPR spectra, 348-351 X a n t h o b a c t e r a u t o t r o p h i c u s , nitrogenase, integer spin EPR spectroscopy, 476 X filter, 268 X-ray emission particle-induced, 566-568 instrumentation, 573 photon-induced, 553-556 X-ray emission spectrum, 544-545 X-ray fluorescence, 553-554 synchrotron radiation-induced, s e e Synchrotron radiation-induced Xray fluorescence X-ray microanalysis, 541 biological applications, 551-553 and electron energy lqss spectrometry, comparison, 551-552 X-ray microtomography, 558 X-ray spectrometer, 545-547 X-ray spectrometry, 544-549 filtered X-ray images, 548-549 quantitative analysis, 547-548 XRMA, s e e X-ray microanalysis Xylose isomerase ENDOR with VOz+ electron spin probes, 235 IH, 237-239 14N, 239, 241 EPR with VO2+ electron spin probes, 235
634
SUBJECT INDEX Y
Ytterbium Cj for, 51 spin expectation value, 51, 53 Yb(IIl), as structural probe, 45, 47, 6773
Z Zeeman effect, pseudonuclear, 228-229 Zeeman interactions, 124, 336, 355
Zeeman splitting, 208 Zero-field splitting in EPR, 355-356 in multifield saturation magnetization, 440-441 Zinc metalloenzymes 113Cd NMR, N3Cd-13C scalar coupling, 38 molecular dynamics simulations, 287288 Zinc metalloprotein, N3Cd NMR spectroscopy, 17