THE CAMBRIDGE SOCIAL HISTORY OF BRITAIN 1 7 5 0 - 1 9 5 0
Whilst in certain quarters it may be fashionable to suppose t...
29 downloads
655 Views
23MB Size
Report
This content was uploaded by our users and we assume good faith they have the permission to share this book. If you own the copyright to this book and it is wrongfully on our website, we offer a simple DMCA procedure to remove your content from our site. Start by pressing the button below!
Report copyright / DMCA form
THE CAMBRIDGE SOCIAL HISTORY OF BRITAIN 1 7 5 0 - 1 9 5 0
Whilst in certain quarters it may be fashionable to suppose that there is no such thing as society, social historians have had no difficulty in finding their subject. The difficulty, rather, is that the advance of social history into every sphere of human activity and experience has occurred through such an outpouring of research and writing that it is hard for anyone but the specialist to keep up with the literature or grasp the overall picture. In these three volumes, as is the tradition in Cambridge Histories, a team of specialists has assembled the jigsaw of recent monographic research and presented an interpretation of the development of modern British society since 1750, from three complementary perspectives: those of regional communities, of the working and living environment, and of social institutions. Each volume is self-contained, and each contribution, thematically de fined, contains its own chronology of the period under review. Taken as a whole they offer an authoritative and comprehensive view of the manner and method of the shaping of society in the two centuries of unprecedented demographic and economic change. Volume 2, People and their environment, explores the questions of social structure, social mobility and class relations. Family and household, the social implications of demographic change, jobs, working and housing conditions, and family relations were all crucial elements in the shaping of group consciousness and form the main themes of this volume. Chapters on nutrition, patterns of food and drink consumption and leisure activities all contribute to a comprehensive overview of the way the social order has been changed. Contributors to Volume 2: M I C H A E L D A U N T O N ;
A N D E R S O N ; D.J.
O D D Y ;
L E O N O R E H.
D A V I D O F F ;
P A T R I C K
J O Y C E ;
M . J .
C U N N I N G H A M
T H O M P S O N was Director of the Institute of Historical Research and Professor of History at the University of London, 1977-1990, and is a Fellow of the British Academy.
F . M . L .
Cambridge Histories Online © Cambridge University Press, 2008
Cambridge Histories Online © Cambridge University Press, 2008
THE CAMBRIDGE SOCIAL HISTORY O F B R I T A I N 1750-1950 VOLUME 2
People and their environment
Cambridge Histories Online © Cambridge University Press, 2008
Cambridge Histories Online © Cambridge University Press, 2008
THE C A M B R I D G E S O C I A L H I S T O R Y OF BRITAIN 1750-1950 VOLUME 2
People and their environment Edited by F. M. L. T H O M P S O N Director of the Institute of Historical Research and Professor of History, University of London
CAMBRIDGE UNIVERSITY PRESS
Cambridge Histories Online © Cambridge University Press, 2008
Published by the Press Syndicate of the University of Cambridge The Pitt Building, Trumpington Street, Cambridge CB2 1RP 40 West 20th Street, New York, NY 10011-4211 USA 10 Stamford Road, Oakleigh, Melbourne 3166, Australia © Cambridge University Press 1990 First published 1990 Reprinted 1996 British Library cataloguing in publication data The Cambridge social history of Britain 1750-1950. Vol. 2. People and their environment. 1. Great Britain. Social conditions, 1 7 1 4 I. Thompson, F. M. L. (Francis Michael Longstreth) 941.07 Library of Congress cataloguing in publication data The Cambridge social history of Britain 1750-1950. Includes bibliographies and indexes. Contents: v. 1. Regions and communities v. 2. People and their environment - v. 3 Social agencies and institutions. 1. Great Britain-Social conditions. 2. Social structure - Great Britain - History. 3. Social institutions - Great Britain - History. I. Thompson, F. M. L. (Francis Michael Longstreth). HN385.C14 1990 306'.0941 89-9840 ISBN 0 5 2 1 25788 3 (v. 1) ISBN 0 5 2 1 2 5 7 8 9 1 (v. 2) ISBN 0 5 2 1 2 5 7 9 0 5 (v. 3) ISBN 0 521 25789 1 hardback ISBN 0 521 43815 2 paperback First paperback edition 1993
Transferred to digital printing 2002
BS
Cambridge Histories Online © Cambridge University Press, 2008
Contents
List of figures List of tables List of contributors Editorial preface 1
The social implications of demographic change MICHAEL
pagevi vii ix xi 1
ANDERSON
2 The family in Britain
71
LEONORE DAVIDOFF
3 Work
131
PATRICK JOYCE
4
Housing
195
M. J . D A U N T O N
5
Food, drink and nutrition
251
D. j . O D D Y
6
Leisure and culture H.
279
CUNNINGHAM
Bibliographies Index
341 363
v
Cambridge Histories Online © Cambridge University Press, 2008
Figures
1.1 1.2 1.3 1.4 1.5 1.6 1.7 1.8 1.9 1.10 1.11 1.12 1.13 1.14
Population: countries of Great Britain, 1751-1951 Crude birth and death rates, Britain, 1751-1939 Changing age-specific mortality, England and Wales, 1841-1960 Survivors by birth cohort (males), England and Wales, 1681-1946 Survivors by birth cohort (females), England and Wales, 1681-1946 Illegitimate births per 100 live births, Britain, 1700-1980 Completed family size and survivors, England and Wales, 1710-1930 Completed family sizes, by marriage cohort, England and Wales, 1870-9 to 1951 Number of children born by occupation of husband, Scotland, 1911 Population age distribution, England and Wales, 17511951 Life courses of women by birth cohort, England and Wales, 1681-1946 Percentage dying in each year of life (males), England, 1837-1952 Percentage never married (females), England and Wales, 1851-1951 Residence patterns (males), England and Wales, 1851
vi
Cambridge Histories Online © Cambridge University Press, 2008
page 2 14 17 25 26 35 38 40 45 46 52 66 68 69
Tables
1.1
1.2
1.3 1.4 1.5 3.1 3.2 3.3 3.4 3.5 4.1 4.2 4.3 4.4 4.5 4.6
Death rates per thousand living, and standardised mortality ratios compared with clergy, 25-44 age group, England and Wales, 1860,1861,1871 and 1900-2 page 22 Percentages of males and females dying in different age spans, by birth cohort, 1681-1946, and according to the 1975-7 life table 27 Mean and median ages at marriage, England and Wales, 1884-5 34 Children born and surviving to 1911, per 100 families, by date of marriage and 'Social Class', 1851-91 43 Estimated percentage of 'typical' children losing parents by certain ages, by children's birth cohort, 1741-1946 49 Estimated industrial distribution of the British labour force, 1801-1951 133 Occupational structure of Great Britain, males, 18411921 134 Occupational structure of Great Britain, females, 18411921 135 Occupational structure of Great Britain, males and females, 1921-51 136 Steam power in 1870 154 Size distribution of dwellings, 1900-1 197 198 Wages and rent levels in five countries, c. 1910 Wages, rent, overcrowding and house size in British cities, 1905-11 199 Rents, building costs, prices and real wages, 1851-1910 206 Distribution of population by house size in Scotland, 1861-1911 206 Tenure of housing, England and Wales, 1938 and 1961 219 vn
Cambridge Histories Online © Cambridge University Press, 2008
viii 5.1 5.2 5.3 5.4 5.5 6.1
6.2
Tables Weekly food consumption per head of the population based on food supply estimates, 1889-1938 Weekly food consumption per head based on family budget evidence, 1787-1937 A comparison of weekly food consumption in urban and rural working-class family budgets, 1863-1913 Weekly food consumption differentiated by sex, c. 1894 Daily nutrient intake analysis of family budget evidence, 1787-1937 United Kingdom local authority expenditure on recreational facilities as a percentage of total local authority expenditure, 1903-50 Estimated expenditure on entertainment and recreation by final consumers in the United Kingdom as a percentage of total expenditure, 1920-38
Cambridge Histories Online © Cambridge University Press, 2008
268 269 271 272 274
323
339
Contributors
Professor of Economic History at the Univer sity of Edinburgh. He has made many contributions to the history of family structure, including Family Structure in Nineteenth-Century Lancashire (1971), Approaches to the History of the Western Family, 15001914 (1980), and Population Change in North-Western Europe, 1750-1850 (1987). MiCHAELANDERSONis
H. C U N N I N G H A M is Senior Lecturer in History at the University of Kent at Canterbury. His work on the history of leisure and popular culture includes Leisure in the Industrial Revolution, c. 1780-c. 1880 (1980).
M . j . D A U N T O N i s Professor of Modern History at University College London. He works chiefly in the field of urban and housing history, with books on Coal Metropolis: Cardiff, 1870-1914 (1977), House and Home in the Victorian City: Working-Class Housing, 1850-1914 (1983), and A Property-Owning Democracy? Housing in Britain (1987).
is Research Professor in Social History at the Uni versity of Essex. Her work on the family, domesticity, and the separate spheres of women and men includes The Best Circles: Society, Etiquette and the Season (1973), and, with Catherine Hall, Family Fortunes: Men and Women of the English Middle Class, 1780-1850 (1987). LEONORE
DAVIDOFF
is Lecturer in Modern History at the University of Manchester. Deeply interested in the social history of work, he has published Work, Society and Politics: The Culture of the Factory in Later Victorian England (1980), and edited The Historical Meanings of Work (1987). PATRICK
JOYCE
D . j . O D D Y is Professor of Economic History at the Polytechnic of Central London. He has written many articles on the history of diet and nutrition in the nineteenth century, and edited, with Derek Miller, Diet and Health in Modern Britain (1985).
ix
Cambridge Histories Online © Cambridge University Press, 2008
Cambridge Histories Online © Cambridge University Press, 2008
Editorial preface
The historian's job is to find out about the past and make it intelligible and accessible to the present. Such an apparently straightforward task is by no means as simple as it may sound. Finding out what happened and interpreting it in patterns and designs which make sense of the past are complicated and demanding processes, requiring scholarship and expertise of a high order, but their value remains limited unless the results are communicated in a language and form which reach beyond the restricted circle of fellow-specialists. Commu nication is particularly important for social history, a field whose con tours and boundaries have altered out of all recognition in the last generation, a subject which is bubbling with the vitality of an outpour ing of monographs and journal articles, and a young discipline which lacks the settled framework of a conventional orthodoxy or a received interpretation within which or against which new departures or open rebellions can be placed or assessed. The old stand-bys - constitutional history, political history, diplomatic history, ecclesiastical history, for example - all have these established frameworks which define their subject matters and enshrine explanations of the course of history. These are widely familiar, although often misleading or mistaken; this means that the terms of debate are well understood, that revisions are easily recognised as revisions, and that the iconoclasm of overturn ing entrenched views does not go unnoticed. Economic history, while much younger than these other subjects, has nevertheless established its rules of enquiry, its methodologies, and its canons of debate, even if it has never succeeded in staking out a territory with sharply defined and stable boundaries. Some might say that it has dug a groove for itself which succeeds in shutting out adequate consideration of factors of central importance, for example the nature and operation of demand and of consumption, in which social history can be illuminating and supportive. xi
Cambridge Histories Online © Cambridge University Press, 2008
xii
Editorial preface
Social history derives its appeal and fascination in no small measure from its open-endedness, its freedom from the constraints of a formal tradition, its eclectic habits, and stands in no need of being rendered into an authorised version. This is just as well, for orthodoxies are not created by editorial decree and if perchance they are fashioned by bands of disciples then the three volumes of this series are in little danger of becoming a Cambridge gospel, for the authors do not belong to any one single camp and do not have a common axe to grind. That is not to say that they are a particularly disputatious or dogmatic bunch, but simply that they are a team of individualists each of whom has been invited to bring their own scholarly judgment to bear on the task in hand. That task is to communicate the fruits of recent writing and the most recent research in social history to the wider audience of students who are curious to know what the specialists have been doing and how their work fits into a general picture of the whole process of social change and development. There are two ways of producing a synthesis: single-handed combat, in which one author takes on the whole field and produces a digest and interpretation of a large slice of history; or a team effort, in which the field is sliced up among contributors according to their expertise and the overview is a co-ordinated package of separate authoritative elements. As with individual sports and team games, tennis and cricket or golf and football, each approach has its own attractions and disadvantages, for players and spectators alike, and each has its partisans. There are several examples of solo syntheses on offer in the field of modern social history, notably from Penguin, FontanaCollins, and Hutchinson. As the author of one of these it is not my purpose to decry their merits. No doubt their main strength comes from the coherence and unity which a picture of an entire landscape may have when seen through one pair of eyes and painted by one hand, and their main weakness from the inability of a single pair of eyes to see everything or to be well educated and well informed about the structure and meaning of all the features in that landscape. Such virtues and vices are neatly balanced by the collaborative syn thesis, in which each major feature is given critical appraisal by a leading specialist, while the landscape as a whole is left to look after itself in the expectation that an impression will form in the mind of the beholder. It would be unwise to try to compensate for this by raising an overarching superstructure over the individual contribu tions in these volumes, for that would come close to courting a disaster
Cambridge Histories Online © Cambridge University Press, 2008
Editorial preface
xiii
akin to those which customarily visit university buildings designed in committee. The design of this, the first enterprise to marshal the resources of the multi-author technique to view the entire sweep of modern British social history, does, however, call for explanatory com ment and description. In the last generation or so social historians have been casting their nets wider and wider, into waters previously unnoticed and unex plored by historians as well as into those formerly fished with the conventional equipment of the political, administrative, or tradeunion historian. So far has this gone that it is sometimes said that all history which is not concerned with the technicalities of high poli tics, diplomacy, or econometrics has become a kind of social history. This social history has moved a long way, in its intellectual approach as well as in its subject matter, from the 'history with the politics left out' which still served as a definition of social history in the 1940s. There may not be a 'new' social history in the same way that there is a 'new' economic history as a school of thought applying econo metrics and models drawn from economic theory to the understanding of historical economic phenomena; but social historians draw widely on concepts from historical demography, social anthropology, socio logy, social geography, and political science, as well as from econ omics, and are well aware of the importance of quantification. Social historians operating in this conceptually eclectic and experimental fashion do not have the methodological certainty, unity, or rigidity of 'new' economic history, and deal in conclusions which are probable and plausible rather than directly verifiable. This social history has generated many vigorous controversies and debates on topics within the period covered by this series: on the standard of living, class formation, the labour aristocracy, or social control, for example, and more recently on gender roles and women's emancipation. These issues have not been picked out for separate treatment in these volumes. The debates are best followed in the original exchanges, or in the several admirable surveys which are available, and references can be found in the bibliographies here. The issues, moreover, are best understood when placed within the frame work of the conditions, customs, and institutions that shaped the way in which the people lived. Hence questions of class, social rela tionships, gender differences and roles, and social conflict are dis cussed in the context of a series of particular themes which constitute the main elements in that framework. The thematic structure means
Cambridge Histories Online © Cambridge University Press, 2008
xiv
Editorial preface
that much matter of interest is left out, because it chances to fall into one of the oubliettes between themes; but while there is no attempt at a literally complete coverage, taken together the chapters add up to a comprehensive and balanced account of the complexity, and diver sity, of the interactions between continuity and change which have determined the development of British society in the two centuries since 1750. The series, indeed, provides three social histories of these two cen turies, each one complete in itself at a level of partial coverage. That is to say, the volumes themselves are not divided chronologically, but into three broad thematic clusters: regional communities; social environment; and social institutions. Much of the recent pioneering work in social history has advanced through intensive study of particu lar localities and communities, and Volume 1, Regions and Communities, draws on this approach by presenting a series of chapters on the social histories of distinctive regions. This is not an attempt to parcel up the whole of Britain into a number of regions, which could run the risk of reducing social history to a sub-branch of local history. It is, rather, a collection of studies of regions - if Scotland and Wales can forgive the label - whose separate identity is clearly established by their distinctive national, institutional, legal, and administrative histories, and of those of undisputed significance as examples of immense social and economic change (the north-west), concentration of power and wealth (the metropolis), and violent changes in fortune (the north-east). The obvious geographical gaps in this disposition are bridged by two chapters, on the countryside and on the city, whose 'regions' are not localities with fixed boundaries but shifting social territories defined by environmental, occupational, and cultural criteria. Regional communities, their social cohesion, disintegration, and reformation, are strongly influenced by regional economies, and this volume, therefore, is more directly concerned than the following two with the links between economic history and social history, and with explicit confrontation of the interaction of economy and society. Where questions of social structure and class relations are raised in the setting of specific localities in Volume 1, in Volume 2, People and their Environment, they are approached, using national data and national patterns, through a collection of studies of the living and working environment. The family and household, the social impli cations of demographic change, domesticity and the separation of home and workplace, housing and the changing meaning of the home,
Cambridge Histories Online © Cambridge University Press, 2008
Editorial preface
xv
the working environment and employer-worker relationships, nutri tion and patterns of food and drink consumption, and leisure and popular culture are the themes of this volume. Together they show how the social order was shaped, reproduced, and changed through the processes of getting, spending, and staying alive, through family, marriage, home, work, consumption, and leisure. These agencies both generated and mediated social tensions, but the more explicit, institu tionalised, efforts to protect the social order, to control or suppress conflicts, to influence attitudes and behaviour, and to manipulate social conditions are reserved for Volume 3, Social Agencies and Institu tions. Much of the running was made by those in power and authority, and the chapters on government and society which explain the chang ing impact of government on people's lives and the changes in popular expectations of what government could and should provide, as well as the chapter on crime and policing, are central to this theme. Most socialisation, however, took place through voluntary and non-official institutions that were largely generated from within a social group and not imposed upon it. These are the subject of chapters on phil anthropy and voluntary associations; while education, religion, and health were in a half-way position, partly the province of official and often coercive action, partly a sphere of voluntaryism, self-help, and self-determination. Each volume is self-contained, with its own set of bibliographies, and with each chapter carrying its own chronology of the 200 years. Together the three volumes, with their three different and comple mentary angles of approach, are designed to offer an integrated and well-rounded social history that is exciting and challenging, as well as being as up-to-date as the contributors, who have written at differ ent times within the last five years, can make it. F. M. L. T H O M P S O N
Cambridge Histories Online © Cambridge University Press, 2008
Cambridge Histories Online © Cambridge University Press, 2008
CHAPTER 1
The social implications of demographic change MICHAEL
ANDERSON
This chapter does not provide a comprehensive survey of demo graphic change in Britain between 1750 and 1950. Its main purpose is to identify the principal changes in demographic behaviour which, in one way or another, set a context for, raised opportunities for, or constrained other aspects of social life in the 200 years covered by this volume. 1
I POPULATION,
ITS D I S T R I B U T I O N A N D
MOVEMENT
In 1750, the population of England was about 5.75 million. Scotland had 1.25 million people, and Wales 0.5 million. A century later, in 1851, the numbers had more than doubled, to 16.7 million, 2.9 million and 1.2 million respectively; by 1951 they had reached 41.6 million, 5.1 million and 2.2 million. In general, as is clear from Figure 1.1, Scotland's population grew more slowly than that of England and Wales, but in both countries the rate of growth, rapid in the mid-eighteenth century in comparison with the past, peaked in the early nineteenth century, remained high until the end of the century and subsequently declined. At its highest rate, in the years 1811-21, England added 18 per cent to its population in a decade and Scotland nearly 16 per cent. At its absolute peak, in the last decade of the nineteenth century, Great Britain's population grew by almost 4 million: in just one decade there were 4 million more people to be fed, employed, amused and housed. In a long-term 2
1
2
For broader general surveys see N. L. Tranter, Population and Society, 1750-1940 (1985); M. Anderson, Population Change in North-Western Europe, 1750-1850 (1988); R. Mitchison, British Population Change since 1860 (1977); M. Flinn, ed., Scottish Population History from the Seventeenth Century to the 1930s (Cambridge, 1977). B. R. Mitchell and P. Deane, Abstract of British Historical Statistics (Cambridge, 1962), pp. 5, 6, 2 0 - 2 ; E . A. Wrigley and R. S. Schoneld, The Population History of England, 1541-1871: A Reconstruction (1981), pp. 2 0 8 - 9 .
1
Cambridge Histories Online © Cambridge University Press, 2008
2
MICHAEL ANDERSON
historical perspective, the most remarkable feature of demographic change in our period was the ability of the British society and economy to cope so well with this massive and unprecedented rise in popula tion. Not merely did numbers rise, they also became more concentrated, particularly in the areas of expanding trade and industry. In Scotland, what became the industrial and commercial central belt, though it covered only 14 per cent of the land area, had 37 per cent of the country's 1755 population; this area of Scotland had 47 per cent of the population by 1821, 68 per cent by 1911 and peaked in 1931 at 75 per cent, falling back to 70 per cent by the end of the period. By contrast, the counties to the north, with nearly three-quarters of the land area and just over half of the population in 1755, had only one fifth by 1951. In England, the old agricultural counties lying predominantly to the south and east of a line between the Severn and the Wash (and excluding London, Surrey and Middlesex), con tained 44 per cent of the population in 1801. By 1881, this figure had fallen to 29 per cent and remained there until after 1931, rising to 31 per cent by 1951. At the same dates, the shares of London and its two satellite counties had risen from 14 per cent to 19 per cent 3
3
This area is defined as including the counties of Ayrshire, Dumbartonshire, Lanark shire, Renfrewshire, Clackmannanshire, Stirlingshire, Fife and the Lothians, together with the city of Dundee. The 1755 figures are from T. C. Smout, A History of the Scottish People, 1560-1830 (1969), p. 261. The later figures are from Mitchell and Deane, Abstract, pp. 21, 23.
Cambridge Histories Online © Cambridge University Press, 2008
The social implications of demographic change
3
of the population, and then fallen back after 1931 to 17 per cent. The share of counties to the north and west of the Severn-Wash line had grown from 45 per cent in 1801 to 53 per cent in 1881 and declined only slightly by 1951. In Wales, the population of one county, Glamor gan, had increased, as a percentage of the Welsh population, from 13 per cent in 1801 to 38 per cent in 1881 and to 55 per cent in 1911, where it roughly remained until 1951. These changes were associated with rapid growth in certain coun ties. In 1911, for example, there were more than six times as many people in Lancashire as there had been in 1801, and the population had reached 4.76 million. But, in proportional growth terms, Lanca shire was surpassed in England and Wales by Surrey, Monmouthshire and Durham, as well as by Middlesex and Glamorgan which each grew by nearly fifteen times. In Scotland, the highest levels of both absolute and relative growth between 1801 and 1911 were in Lanark shire, with an increase of over 1.25 million people (nearly nine times). These concentrations in the manufacturing and trade centres of the country were not immediately accompanied by massive rural depopu lation. In England, no county experienced a decadal loss of population before 1841-51, and only Herefordshire, Hertfordshire and Rutland (plus London between 1931 and 1951) had falls in our period of more than 10 per cent below their peaks. Wales and Scotland saw more and earlier decline but it was not dramatic except in a few areas. In Wales, all but one of the counties experienced some inter-censal popu lation loss at some time (in all but Montgomeryshire beginning in the second half of the nineteenth century - and in Glamorgan and Pembrokeshire being confined to the interwar period). Half of the Welsh counties experienced losses of more than 10 per cent of their peaks, and four of more than 20 per cent, the most marked being Montgomeryshire where the population in 1951 was only two-thirds of the 1841 level. Yet, of all the Welsh counties, only Montgomeryshire had a smaller population in 1951 than in 1801, and then only just. In Scotland (with the exception, by the 1830s or 1840s, of the high land counties and of Peebles in the Borders), there were no significant absolute population losses at county level before 1851. By 1911, how ever, only seven counties (Aberdeenshire, Fife, Lanarkshire, Mid lothian, Renfrewshire, Stirlingshire and West Lothian) had not experienced some population decline. After 1911, rural population 4
4
The county growth figures here and in the next paragraphs are calculated from Mitchell and Deane, Abstract, pp. 20, 22.
Cambridge Histories Online © Cambridge University Press, 2008
4
MICHAEL ANDERSON
loss was widespread and even Aberdeenshire, Fife, Renfrewshire and West Lothian had falling populations in the interwar period. All in all, at some time in our period, over two-fifths of Scottish counties lost more than 10 per cent of their peak populations, and over a quarter lost more than 25 per cent; at the extreme, Sutherland and Shetland had, in 1951, only 54 per cent and 59 per cent respectively of their highest nineteenth-century populations. Five counties had lower populations in 1951 than in 1801; the most significant losers were Argyllshire (down 36 per cent) and Sutherland (down 39 per cent). At parish level, the picture is very different, and a clear basis for major social dislocation can be seen in some areas. Detailed research remains to be done on a national level for England and Wales, but in Scotland the population of some individual parishes was already declining before 1800. Thereafter, excluding the burghs of 1801, about one parish in seven had lost more than half its 1801 population by 1951, and almost one third of all parishes had 1951 populations less than half the level of their nineteenth-century peaks. Three parishes in every five had lost more than 10 per cent of their 1801 populations and four-fifths were more than 10 per cent below their nineteenth-century peaks. On the other hand, one fifth of all nonburghal parishes had more than twice their 1801 populations in 1951, but almost all of these were parishes either on the coasts or in the Central Belt. In the Borders and the Highlands and Islands, by con trast, three-quarters of parishes were more than 10 per cent below their 1801 sizes and well over two-fifths had populations less than half the level of their nineteenth-century peak. Moreover, the remain ing populations of the extensive Highlands and Islands parishes were also far more concentrated onto the larger settlements and coastal fringes as a consequence of two centuries of both voluntary and in voluntary displacement of the population. 5
6
These movements at parish level are in part a reflection of another significant shift in population distribution in our period, an increasing concentration of population in the towns, with all the social conse quences of urban living and, in the larger towns, all the mortality and other problems associated historically with high population 5
6
Flinn, ed., Scottish Population, p. 307. The figures on parish population change in Scotland have been calculated from the respective county reports of the 2952 Census of Scotland, I, Table 3; a partial survey of the English situation can be found in J. Saville, Rural Depopulation in England and Wales, 1851-1951 (1957), chap. 2; E . Richards, A History of the Highland Clearances, 2 vols. (1982,1985).
Cambridge Histories Online © Cambridge University Press, 2008
The social implications of demographic change
5
density. Already, by 1750, one in every nine of the population of England and Wales lived in London, a European colossus with a popu lation of about 675,000; roughly another 340,000 (or 5.5 per cent) lived in places with populations of over 10,000. London continued to expand over the nineteenth century, reaching 1 million (about 10 per cent of the national population) in 1811, over 2 million by 1851, passing 3 million in the 1860s and 4 million in the 1880s; by then it contained its peak share of the population of almost 15 per cent. In 1901 its population was 4.5 million, but thereafter it fell, first slowly, and then rapidly during and after the Second World War. By 1951 the popula tion was only 3.3 million (about 7.5 per cent of the national popula tion) though its suburbs were still growing. No other English town had a population of more than 100,000 until the 1811 census (when only 7 per cent of Englishmen lived in places of between 20,000 and 100,000 people). Thereafter urban growth was rapid. Including Lon don, 23 per cent of the population of England and Wales lived in cities of 100,000 or over in 1851 and 35 per cent in places of 20,000 or more. By 1911, 35 per cent lived in places of 100,000 and over, a figure which remained constant until the Second World War and then declined a little, largely because of the fall in the population of London. In 1750, Scots were even less likely than their southern neighbours to be living in large centres of population. Edinburgh (plus its sub urbs), with a population of perhaps 57,000, Glasgow and its suburbs (about 32,000), Aberdeen (around 16,000) and Dundee (about 12,000) were the only towns in 1755 with populations larger than 10,000 and only four other towns are likely to have mustered over 5,000 people; these places together contained fewer than one Scot in eight. The remaining people were scattered widely over the countryside, a few per cent in the large number of small burghs, many with no more than a few hundred inhabitants, most of the rest still in tiny settle ments, often of only half a dozen families. By the census of 1801 things had changed but little; Scotland still had no town of 100,000 inhabitants, though Edinburgh and Glasgow both exceeded 80,000, and about one in five of the population lived in towns of over 5,000 people. By 1851, when the census authorities believed that in England 7
8
7
8
P. J. Corfield, The Impact of English Towns, 1700-1800 (Oxford, 1982), pp. 8-9; A. F. Weber, The Growth of Cities in the Nineteenth Century (1899; reprinted 1967), pp. 4 6 - 7 ; Mitchell and Deane, Abstract, pp. 2 4 - 7 . Smout, History, p. 261; B. Lenman, Integration, Enlightenment and Industrialisation: Scotland 1746-1832 (1981), p. 5.
Cambridge Histories Online © Cambridge University Press, 2008
6
MICHAEL ANDERSON
almost exactly half of the population lived in urban areas, in Scotland the figure was 52 per cent. By now, the big towns had begun signifi cantly to grow. The cities of over 100,000 people contained 17 per cent of the population, and centres over 5,000 had 26 per cent. Even so, much of Scotland's 'urban' population was still concentrated in small places. By 1911, 36 per cent of the population lived in places in the 100,000 and over category (and only 38 per cent in 1951). In 1911, 59 per cent were in places of 5,000 and over, and the growth of the smaller places continued so that, by 1951, nine Scots out of every ten lived in places with populations exceeding 10,000. These patterns of national and local population growth and decline were associated with enormous population movements through inter nal migration, immigration and emigration. First, there were great tides of immigration, producing a society in which some cities - and especially London - were always characterised by substantial and clearly identifiable immigrant communities. Right from the eighteenth century there was a significant Irish component in the British popula tion and by the time this can first be measured accurately at the 1841 census (and probably including some temporary seasonal migrants), there were some 125,000 Irish-born persons in Scotland, and 290,000 in England and Wales. Following the failure of the potato crop in Ireland in the 1840s, a major influx occurred, running in Glasgow in 1848 at 1,000 per week. This flow continued at a slower rate even after 1870 (and expanded again after the Second World War). Nationally, at the recorded proportional peak in 1861, 602,000 persons in England and Wales, and 204,000 in Scotland, were of Irish birth (about 7 per cent of the population of Scotland and 3 per cent of the population of England and Wales). Locally, the effect could be even more significant. There were substantial Irish-born concen trations even in rural areas in south-west Scotland, while Paisley, Glasgow, Kilmarnock and Dundee all had over 10 per cent of their populations Irish-born (Dundee was the highest at nearly 19 per cent). In England, outside Liverpool (with 22 per cent of its 1851 population born in Ireland), and Manchester and Salford (with 13 per cent), the concentrations were considerably lower though still significant; 9
10
11
12
9
10
11
12
Weber, Growth of Cities, pp. 58-9; Mitchell and Deane, Abstract, pp. 2 4 - 7 . 1841 Census of Great Britain, Enumeration Abstract, P P 1 8 4 3 , XXII, Preface, pp. 14-17. Flinn, ed., Scottish Population, pp. 456-7. Compare the coloured population of Britain in 1981 at about 4 per cent, of w h o m about half were first generation migrants (General Household Survey (1981), Table 2.21).
Cambridge Histories Online © Cambridge University Press, 2008
The social implications of demographic change
7
Bradford, for example, had 9 per cent of its population Irish-born and London 5 per cent. While the national percentage born in Ireland fell after 1851 (to less than 2 per cent by 1911), the descendants of this Irish influx continued to be a major social and economic force within many urban centres in Britain, and in some areas formed a focus for major tensions and outbreaks of public disorder. A second major source of immigrants was the Continent of Europe. Relatively insignificant and of widely spread origins in the mid-nine teenth century, continental immigrants rose rapidly in numbers between 1870 and 1914, the most important group being Eastern Euro pean Jews fleeing from Tsarist persecution. In all perhaps 120,000 arrived in this period and especially between 1882 and 1905. At the 1911 peak there were about 285,000 'aliens' living in England and Wales and 25,000 in Scotland. The largest proportions by far were of Russian, Polish and German origin, but significant numbers also came from France and Italy. Again the major social impact was a local one with heavy concentrations of Russian Jews in certain areas of Leeds, Manchester and the East End of London, and with other immigrant communities settled in very tightly circumscribed areas of the capital, areas which sometimes became the focus of short-lived disturbances. Finally, in addition to a significant white colonial and East-Indiesborn population (about 71,000 in 1871, mainly the children of adminis trators and soldiers), a small and probably slowly declining black com munity existed, particularly in seaport towns, right back to the eighteenth century. After the First World War, and especially after 1948, the non-white population began to grow but even in 1950 the total numbers in the whole of Britain were probably less than 50,000. The scale of immigration was thus high in our period and its social consequences at times considerable. The rate of outflow, however, was even higher though its social consequences have been much less explored. In Scotland, few individual parishes in the Highlands absorbed all their natural increase (the gap between births and deaths) at any time within this period, and the same was increasingly true 13
14
15
13
14
15
M. A. G. OTuathaigh, 'The Irish in Britain: A Problem of Integration', Transactions of the Royal Historical Society, 31 (1981), pp. 149-73. C. Holmes, 'The Promised Land? Immigration into Britain 1870-1980', in D. A. Cole man, Demography of Immigrants and Minority Groups in the United Kingdom (1982), pp. 1-21. J . Walvin, Black and White: The Negro in English Society, 1555-1945 (1973); Holmes, 'The Promised Land?'; C. Peach, 'The Growth and Distribution of the Black Popula tion in Britain, 1945-1980', in Coleman, Demography, pp. 23-42.
Cambridge Histories Online © Cambridge University Press, 2008
8
MICHAEL ANDERSON
of most of rural Britain where, as we have seen, many populations eventually went into absolute decline even though births exceeded deaths by ten or more per thousand per annum. However, this problem was not just a rural one; many towns were also producing more people than they could retain. In Scotland, where the evidence is clearest, in no decade after 1870 did all four of the great cities of Edinburgh, Glasgow, Aberdeen and Dundee absorb all of their natural increase. The consequence, for rural and urban areas alike, was massive emigration. 16
17
Taken as a whole, there was probably net emigration from Britain in every decade in our period prior to the 1930s, when substantial net inflow, mainly in the form of returning emigrants, occurred. Pre cise estimates are difficult to make because there are no comprehensive statistics before 1853 and even these have serious shortcomings until 1877 and significant difficulties until 1912. Overall, however, it seems that in excess of 10 million English-born persons, and approaching 2.5 million Scots, left Britain for overseas destinations between 1750 and 1939. Before 1850 the majority of this outflow was of a 'settler' type, most intending permanent emigration and going to a great extent in family groups. After the mid-nineteenth century, however, and particularly from the 1880s, a higher proportion of departures was of young single males, many of whom either went expecting to return, or who did so as the relative fortunes of the British and North American economies fluctuated over time. Overall, net emigration of English-born persons between 1750 and 1939 was probably well in excess of 5.5 million; around 1.75 million Scots also left permanently for overseas. 18
The outflows varied significantly in intensity at different periods. Before 1801 we have for England only very rough residual figures computed by Wrigley and Schofield; these suggest that net emi gration in the second half of the eighteenth century was running at between 3,000 and 7,000 per annum, falling from a little over 1 per cent of the population per decade in the 1750s to around 0.5 per cent 19
16
18
19
17
Flinn, ed., Scottish Population, p. 308. Ibid., p. 312. Most of the figures in this and the next three paragraphs are computed from N. H. Carrier and J. R. Jeffery, 'External Migration: A Study of the Available Statistics', Studies of Medical and Population Subjects, 6 (1953), modified where appropriate by reference to the important and more detailed discussions of D. Baines, Migration in a Mature Economy: Emigration and Internal Migration in England and Wales, 1861-1900 (Cambridge, 1985). Wrigley and Schofield, Population History, pp. 528-9.
Cambridge Histories Online © Cambridge University Press, 2008
The social implications of demographic change
9
2
by 1800. Between 1815 and 1850 there seem to have been around 0.5 million (net) English and Welsh emigrants in total, and another 100,000 Scots, and even in this period total native-born emigrants almost certainly exceeded the very large inflow of Irish and other overseas-born immigrants. Between 1850 and 1869, with numbers returning still relatively low, emigration rose markedly to exceed 1 million English-born, and over 0.25 million Scots (for comparison, the population of England and Wales in 1851 was just under 18 million and the population of Scotland just under 3 million). Thereafter emigration continued at a high rate until 1914, but with particularly high levels in the 1880s (over 800,000 net English and Welsh emigrants - around 4 per cent of the mean population) and in the ten years up to 1914 (when England and Wales lost 1.3 million from their native populations and Scotland some 380,000); in each of the years 1910-13 Scotland lost more than 1 per cent of its popula tion, and in all four years emigration more than exceeded natural increases. After the First World War (with the sole exception of 1920) emigration fell away in England and Wales, but Scottish emigration continued at a high level, with, net, around 350,000 people moving overseas (7 per cent of the mean population). As we have seen above, for both England and Wales and Scotland, some of this outflow was replaced by immigrants from Ireland and from overseas. Nevertheless, net population loss through migration was around 2.7 million from England and Wales between 1841 and 1930, and 1.4 million from Scot land between 1861 and 1930; the Scottish figures include the substan tial emigration to England and Wales, but even if this is excluded Scotland lost a higher proportion of her natural increase through emig ration between 1881 and 1930 than any other Western European country except Norway and Ireland. 21
With emigration at this level, almost every family (especially in Scot land) from all parts of the social scale lost at least one member overseas 20
21
For Scotland and Wales we have no precise figures for this period but we know that significant highland emigration was under way from the 1760s. The overall figure for Scotland between 1763 and 1775 was probably the equivalent of well over 1 per cent of the population (computed from figures cited in Flinn, ed., Scottish Population, p. 443). Norway lost 40 per cent of her natural increase between 1835 and 1938. Scottish net emigration was 43 per cent of natural increase in 1881-90, 47 per cent in 1901-10, 57 per cent in 1911-20, and 104 per cent in 1921-30 (Baines, Migration, pp. 6 1 - 2 ) . In Ireland the population fell steadily from more than 8 million in 1841 to just over 4 million in 1926-7, in spite of strongly positive natural increases throughout the period.
Cambridge Histories Online © Cambridge University Press, 2008
10
MICHAEL ANDERSON
in the last hundred years of our period. No part of the country escaped entirely, though in England and Wales losses were especially high in Cornwall and in other parts of the south-west and in South Wales, while in Scotland it seems likely that the Highlands and Islands experi enced the most severe emigration. Young single males formed a high proportion of the emigrants, especially towards the end of the period; almost two-thirds of English and Welsh emigrants in the years 1 8 7 1 1900 were males, while the net losses of males through emigration between 1900 and 1913 were more than double the numbers killed during the First World W a r . One important side-effect of this pattern of emigration was to skew the sex ratio of the native population strongly in favour of women. In England, after the outflow of the 1850s, the sex ratio among the 25-9 age group (men per thousand women) fell from 906 (1851) to 879 (1861); in Scotland, the comparable figures were 828 to 769, the lower Scottish figures being a reflection of the long-standing higher rates of emigration from that country. The emigration surges of the 1880s and, in Scotland, of the 1900s, produced similar effects. Together with mortality differentials (see below), emigration produced what came to be seen as a significant 'spinster problem' in the second half of the nineteenth century. But these long-distance movements were not the only migrationinduced disruptions of social relationships and local community life. Right back into the medieval period it is clear that the English (and probably also the Welsh and Scots) had been migratory peoples. The relative (compared with continental Europe) insignificance of a landholding peasantry had by 1750 produced an agricultural system char acterised by a wage labour force. Over the course of our period this wage labour sector increasingly ceased to consist of individuals work ing part time or as a passing phase of the early life course, and became instead more and more dependent on life-time wage labour employ ment. At the same time rising urbanisation increased the centuries-old flow of surplus rural population to the towns (as well as the equally significant, though smaller, counter-flows from town to countryside). 22
23
24
22
23
24
Winter estimates the total of war-related deaths for Great Britain and Ireland as about 610,000 (J. M. Winter, 'Some Demographic Consequences of the First World War in Britain', Population Studies, 30 (1976), pp. 539-52). Mitchell and Deane, Abstract, pp. 12-13. For a review of this problem and some evidence of how it was met at mid-century see M. Anderson, 'The Social Position of the Spinster in Mid-Victorian Britain', Journal of Family History, 9 (1984).
Cambridge Histories Online © Cambridge University Press, 2008
The social implications of demographic change
11
Even in the seventeenth and early eighteenth centuries the rural population had never been static. Around 70 per cent of the rural witnesses at English diocesan courts analysed by Clark for the period 1660-1730 had moved at least once; about one in seven had moved between counties. Comparison of population listings for the English village of Clayworth between 1676 and 1688 shows that 61 per cent of the population had disappeared over a twelve-year period (only about two in every five of these disappearers are known to have died). Farm servants were particularly mobile but even apparently established farming families moved around to some degree. Most of the rural movement was relatively short-distance, and short-distance movement was also observed in the movement to the towns, though some longer distance migration (especially to London and the larger cities) was also to be found. From the mid-nineteenth century we are able to measure these pat terns more precisely. Preliminary figures from the National Sample from the 1851 census show that about 54 per cent of the population were recorded as not living within 2 kilometres of their stated place of birth. The figure for towns (including Londoners who recorded their place of birth simply as 'London') was 56 per cent, but perhaps more surprising at first glance is the fact that 52 per cent of the rural 25
26
27
28
29
25
26
27
28
29
P. Clark, 'Migration in England during the Late Seventeenth and Early Eighteenth Centuries', Past & Present, 83 (1979), pp. 6 4 - 7 1 . T. P. R. Laslett, Family Life and Illicit Love in Earlier Generations (Cambridge, 1977), chap. 2. A. Kussmaul, 'The Ambiguous Mobility of Farm Servants', Economic History Review, 2nd ser., 34 (1981), pp. 222-35. Clark, 'Migration', pp. 6 4 - 7 1 , 76-7; E. J . Buckatzsch, 'Places of Origin of a Group of Immigrants into Sheffield, 1624-1799', Economic History Review, 2nd ser., 2 (194950), pp. 303-6. There were also very high levels of mainly short-distance migration in pre-industrial rural Scotland: see R. A. Houston, 'Mobility in Scotland 1652-1811: The Evidence of Testimonials', Journal of Historical Geography, 11 (1985), pp. 379-94. The National Sample from the enumerators' books of the 1851 census of Great Britain has been developed at the University of Edinburgh over the past fifteen years with assistance from the Economic and Social Reserch Council. The entire sample contains around 400,000 individuals, but the material used in this chapter is drawn from a number of sub-samples of the data. Individual level data are based on the weighted aggregates of three systematic one in forty sub-samples from the entire data set for smaller rural settlements, plus six such samples from the rest of the country; the total size of this sub-sample, before weighting, is 50,406 though the numbers given in the tables are based on weighted figures (the weighted total is 29,939). The family and aggregate household level data are derived from the preliminary version of a SIR database, which contained at the time of writing only data from one of the one in forty sub-samples (containing 9,828 persons in private households). Some of the household data sub-divided by occupation is from an earlier weighted sub-sample where sixty-five entire sampling clusters, containing 27,920 individuals in all (23,300 after weighting), were included.
Cambridge Histories Online © Cambridge University Press, 2008
12
MICHAEL ANDERSON
population were also life-time migrants when measured in this way. Closer inspection of the data reveals that rural areas with high migrant populations were not just confined to expanding industrial villages, but were spread extensively through the agricultural areas of the country as well. If attention is confined to the major industrial towns in the sample the figure for immigrants still only just reaches 60 per cent. Much of this migration was short-distance so that the impact on social relationships through separation between kin may have been less significant than first impressions might suggest. This was especially true of rural migrants, over two-thirds of whom moved less than 25 kilometres. The equivalent figure for short-distance urban migrants, on the other hand, was under two-fifths (and for migrants to London under one fifth). Nevertheless, while continuity of close rural social relationships seems at least to have been possible, con siderably greater efforts were required for many urban dwellers if they wished to remain in contact with their places of birth. Immigration when measured in this way is obviously heavily skewed by age, but we can use this effect to throw some light on the timing of first migration. When this is done it is clear that in all areas the rate accelerates rapidly during the teenage years and in the early twenties, the proportion who were migrants being 45 per cent in urban areas at ages 10-14 (43 per cent in rural areas), 55 per cent (49 per cent) at ages 15-19 and 67 per cent (58 per cent) at ages 20-4. Even among very young children considerable movement may be observed. While some of this may be a function of mothers temporarily moving away from home for childbirth, and a small amount may be a result of measurement error in the methods used, the figures are of some interest. Already among children in their second year of life over a quarter in both urban and rural areas were recorded in 1851 at more than 2 kilometres from their place of birth. This suggests that there existed in nineteenth-century society a con siderable degree of transiency among at least some sectors of the popu lation. 30
31
30
31
Note, however, that these figures can only be approximate until further research is done on that segment of the population who only recorded a county of birth. For some elaboration of these points, on the basis of an earlier data set, see M. Anderson, 'Urban Migration in Victorian Britain: Problems of Assimilation?', in E . Francois, ed., Immigration et societe urbaine en Europe occidentale: XVIe-XXe siecles, Edi tions Recherches sur les Civilisations (Paris, 1985).
Cambridge Histories Online © Cambridge University Press, 2008
The social implications of demographic change
13
This transiency is also revealed more locally among urban residents by the rapid rates of population turnover within towns. One study of thirty streets in Liverpool, for example, has revealed that only 18 per cent of the population remained at the same address for ten years, with 40 per cent moving within one year. Even of those born in Liver pool, 35 per cent moved in this period. Other studies confirm that this high rate' of movement was widespread in towns though much was confined within a few hundred yards. Contemporary comment suggests that the insecurities of nineteenth-century life, the commonly small margin between income and subsistence needs, and a minutely variegated rented housing market, all contributed to unstable urban residence patterns. Certainly, as living standards rose over the late nineteenth century, population turnover within towns seems to have declined and the arrival of rented council housing, plus slow expan sion of the previously small owner-occupied sector, meant that, by the mid-twentieth century, house moving had become a much more infrequent affair for the mass of the population. 32
33
34
II
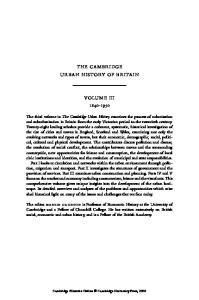
DEATHS, BIRTHS AND
MARRIAGE
For most of our 200-year period, almost the whole country experienced natural increase in its population - in other words, on average, births in each year Exceeded deaths. This section explores some of the socially significant aspects of this historically unique demographic period. As a start to the discussion, Figure 1.2 presents the available reason ably reliable estimates of the birth and death rates of England and Wales and of Scotland in our period. For Scotland, we do not have - and almost certainly will never have - continuous series of birth and death rates such as those esti mated by Wrigley and Schofield for England. Estimates for 1755 which suggested a crude birth rate of over forty-one and a crude death rate of around thirty-eight per thousand (figures which are both far higher 32
33
R. Lawton and C. G. Pooley, The Social Geography of Mersey side in the Nineteenth Century, Final Report to SSRC (1976). Fourth Report from SC on Settlement and Poor Removal, PP 1847, XI (1847), pp. 5 1 - 2 ; C. Booth, Life and Labour of the People of London, 1st ser., Poverty, vol. 3 (1889), pp. 61, 81; M. Anderson, Family Structure in Nineteenth-Century Lancashire (Cambridge, 1971), pp. 4 1 - 2 ; R. M. Pritchard, Housing and the Spatial Structure of the City (Cambridge, 1976); R. Dennis, Tntercensal Mobility in a Victorian City , Transactions of the Institute of British Geographers, new ser., 2 (1977), pp. 349-63; C. G. Pooley, 'Residential Mobility in the Victorian City', Transactions of the Institute of British Geogra phers, new ser., 4 (1979), pp. 258-77. Pritchard, Housing, chaps. 4 - 6 . 7
34
Cambridge Histories Online © Cambridge University Press, 2008
14
MICHAEL ANDERSON • B i r t h s ,
Scotland
Deaths, Scotland Births, England (and f r o m 1838
1750
1800
1850
1900
1950
Year
Figure 1.2 Crude birth and death rates, Britain, 1751-1939 Sources: Wrigley and Schofield, Population History, pp. 528-9; Mitchell and Deane, Abstract, pp. 29-32, 36-7. 35
than England's) are almost certainly too high. Thereafter, until the late 1850s (when the figures for Scotland are very much like those for England and Wales), no data are available, with the exception of some rough estimates for the 1790s which suggest significant regional variations and a national death rate around the level of Eng land's (though a lower birth rate). It seems, nevertheless, almost certain that Scotland had higher mortality than England well into the nineteenth century. There was near famine in parts of Scotland in 1782 and serious epidemics of infectious disease - particularly in the towns - in 1808, 1831, 1836-7 and 1846-9; the last of these has been described by one group of scholars as 'a period of quite excep tionally lethal character more redolent of the seventeenth than of the nineteenth century'. There is thus a real possibility that Scotland (and especially its highland areas) experienced a demographic regime in the eighteenth century something like that of France, and had, during the classic 'industrial revolution' period, a quite different 36
37
35
36
Rosalind Mitchison has recently reworked the bases of the calculations reported in Flinn, ed., Scottish Population, p. 59. See her 'Webster Revisited: A Re-Examination of the 1755 "Census" of Scotland', in T. Devine, ed.. Themes in Scottish Social History (Edinburgh, 1989). Flinn, ed., Scottish Population, p. 259. Ibid., pp. 372-3. 3 7
Cambridge Histories Online © Cambridge University Press, 2008
The social implications of demographic change
15
demographic transition from that experienced by England and Wales. Turning to the figures for England in Figure 1.2, for the period 1751 to 1851 three points merit particular attention. First, compared with some other parts of Europe and especially with France, both the birth rate and the death rate were low in eighteenth-century England, which had what Wrigley and Schofield call a 'low pressure' demographic regime. Secondly, the high level of fertility between the 1780s and the 1820s is of importance, though its interpretation is subject to dis pute. The third point to note is the rapid fall in the death rate in the first thirty years of the nineteenth century for which the most likely explanation is some combination of an improvement in the stan dard of living and a fall in smallpox mortality following the introduc tion of vaccination. For the period since 1861, the birth and death rates for Scotland are very similar to those for England and Wales, confirmation of the fact that it was differences in net migration which were responsible for the different growth rates of the two countries in this period. In both countries also, the birth rate began a steady decline in the 1870s, with Scotland trailing a little behind England and Wales. And in both countries the death rate shows some fall in the 1880s and then a more rapid fall from the late 1890s, with Scotland again lagging behind. The social significance of changes of this size in the level of mortality was clearly considerable, resulting as they did in an increase in the expectation of life (the average number of years lived) in England from around 36 in the second half of the eighteenth century to around 40 in the central years of the nineteenth century, and then, for England 38
39
40
41
38
39
40
41
For a neat comparison of French and English demography in the eighteenth century, see Wrigley and Schoheld, Population History, pp. 246-7. Ibid., p. 247. Some doubts have been raised about the reliability of Wrigley and Schofield's findings for this period but it seems inconceivable that the effects that they observe are entirely artefacts of the undoubted poor quality of the English data of this period. The problems are reviewed in Anderson, Population Change, chaps. 2 and 6. For a review of this controversy see Anderson, Population Change; also the broad interpretations offered by R. S. Schofield, 'English Marriage Patterns Revisited', Jour nal of Family History, 10 (1985), pp. 2 - 2 0 , and by D. Levine, Reproducing Families (Cambridge, 1987). Over this period of time the data assembled by P. H. Lindert and J. G. Williamson, in 'English Workers' Living Standards during the Industrial Revolution', Economic History Review, 2nd ser., 36 (1983), pp. 1-25, seem to me conclusive enough for present purposes. For a wider review of mortality change in this period see Anderson, Population Change, chap. 7. The role of smallpox is vigorously asserted by A. J. Mercer, 'Smallpox and Epidemiological-Demographic Change in Europe: The Role of Vacci nation', Population Studies, 39 (1985), pp. 287-308.
Cambridge Histories Online © Cambridge University Press, 2008
16
MICHAEL ANDERSON
and Wales, to 52 for males and 55 for females for 1911-12, and to 66 and 72 respectively for 1 9 5 0 - 2 . The Scottish trends thereafter were roughly in parallel with those for England and Wales though the improvement was in general just a little delayed. Such average figures are, however, misleading for they fail to take account of the changes in the age distribution of mortality, and of the different experiences of different occupational groups and of people living in different parts of the country (and especially in the towns compared with the rural areas). Figure 1.3 shows the quinquen nial average age-specific mortality rates for England and Wales between 1841 and 1955. No detailed figures are available on a national English basis for earlier in the period, though Wrigley and Schofield have published infant mortality rates for thirteen parishes for the second half of the eighteenth century which, when adjusted for prob able levels of under-registration, range between 70 for rural Hartland 42
43
44
42
43
4 4
45
45
The life table data used here and in later calculations in this chapter are drawn before 1838-54 from tables developed by Wrigley and Schofield for Population History; the authors kindly provided me with the more detailed life tables used in the calcula tions of their published figures and these are used later in the chapter when cohorted figures are required. For the period up to 1871 I have also used these life tables, except when reference is needed to sex-specific data when I have used the data published in the Third English Life Table. Thereafter, I have used the figures provided by successive English life tables as published in the Decennial Supplements to the Annual Reports of the Registrar General of Births, Deaths and Marriages for England and Wales (published, like the Annual Reports, as Parliamentary Papers until 1920) and to the Registrar General's Statistical Reviews for England and Wales published by the General Register Office. Scottish life tables can be obtained from the decennial supple ments to the Annual Reports of the Registrar General of Births, Deaths and Marriages for Scotland; the first decennial supplement appears in PP 1895, XXIV, and includes data on occupational mortality but no life tables; the hrst life tables appear in the Supplement to the 48th Detailed Annual Report of the Registrar General of Births, Deaths and Marriages for Scotland, PP 1906, XXI; this report contains life tables for each decade from 1861-70 to 1891-1900. For example, expectation of life for women for 1871-80 was 44.62 for England and Wales and 43.80 for Scotland; for 1881-90 the figures were 47.18 and 46.33 respectively (Supplement to the 55th Annual Report of the Registrar General of Births, Deaths and Mar riages in England and Wales, PP 1895, XXIII, Pt I, p. xviii; Supplement to the 48th Detailed Annual Report, PP 1906, XXI, pp. cxviii-ix. The figures used in the calculation of survival rates below are derived from the application of the model mortality schedule devised by the Cambridge Group for their work for Wrigley and Schofield, Population History, to the estimated level of mortality in any quinquennium. The results cannot be used to show changes in age-specific mortality. The assumption that the mortality schedule remained constant, while perhaps more questionable for the period before 1750, seems more valid there after, with scarlatina to a great extent replacing smallpox as a major killer in early life (Roger Schofield in a personal communication). E . A. Wrigley and R. S. Schofield, 'English Population History from Family Reconstitution: Summary Results 1600-1799', Population Studies, 37 (1983), pp. 157-84; these are approximate figures adjusted for under-registration by amending the rates from p. 179 of Wrigley and Schoneld's paper by the factors suggested on p. 178.
Cambridge Histories Online © Cambridge University Press, 2008
The social implications of demographic change 1,000
Males
Females 1,0001
CD CD > CD
o
o o
"O
100^
live
aths un
per
100
-Q
CD
o
CO
irth
c •>
17
10
o o o
Infants 5-9 10-14 20-4 35-44 55-64 75-84
CD
CO
sz "D
Q
CO
nfan
CD CD
CD
1 -
o.
0.1 1840 1880 1920 1960 1860 1900 1940 Year
0.1 1840 1880 1920 1960 1860 1900 1940 Year
Figure 1.3 Changing age-specific mortality, England and Wales, 1841-1960 Sources: Annual Reports of the Registrar General for England and Wales.
and around 250 for the towns of Gainsborough and Banbury. The average death rate for the thirteen parishes (166 per thousand) is below the national average; the overall mortality of these parishes was more favourable than that of England as a whole and no London parishes or parishes for any other major city were included. If the shape of the mortality schedule remained unchanged from the later eighteenth to the mid-nineteenth centuries, then extrapolation from Wrigley and Schofield's national aggregate reconstruction data for the second half of the eighteenth century would suggest that eighteen babies out of every hundred born would have failed to reach their first birthday; this is clearly a figure compatible with the parish family reconstruction data when its bias is taken into account. It thus seems likely that infant mortality fell somewhat between the later eighteenth and the mid-nineteenth centuries. Thereafter, however, as Figure 1.3 shows, it fell little, if at all, until the early twentieth century. By contrast, child mortality (deaths between ages 1 and 15), having possibly fallen by rather less than infant mortality around the turn of the century, went into a steady decline from the 1870s, and was accompanied or followed shortly afterwards by a reduction in deaths among young adults. At the other end of the life course little change in the death rates of those aged 55-64 is visible 46
4 6
Wrigley and Schofield, Population History, p p . 529, 714.
Cambridge Histories Online © Cambridge University Press, 2008
18
M I C H A E L
A N D E R S O N
before the twentieth century. For the over-74s there was little change right to the end of the period. In general, the patterns for females were similar to those of males but with falling mortality of women of any age group preceding that of men by a few years. Also, as is the case in Britain today, female mortality was below that of males. However, from the beginning of civil registration right up to the First World War, this was not true for some groups of children and young adults. As late as the 1911-12 English life table, female mor tality exceeded that for men at all ages from 9 to 15; the excess was particularly marked in rural areas where it covered the whole age range from 12 to 19. Ten years earlier female mortality nationally had been higher than that for males at all ages from 3 to 14; in the quinquen nial data from the Third English Life Table for the years 1838-54, the higher female rates included the entire age span from 10 to 39; this higher adult female mortality, extending often at least up to age 35 and not confined to areas with high rates of mortality associated with childbirth, continued in certain parts of rural England and in many mining areas right up to 1914. 47
48
Excess female mortality at ages where modern life tables show con siderable female advantage is found widely in Western Europe at this period but it has until recently attracted little serious research, in spite of its possible significance in providing clues to differences between the two sexes in social, nutritional and environmental conditions. Some of the female excess mortality was childbirth-related; Schofield has estimated maternal mortality for England at 7.7 per thousand live births in the later eighteenth century, while for most of the nineteenth century it was nationally at a level of about five per 49
50
47
48
49
50
Decennial Supplement to the 75th Annual Report of the Registrar General of Births, Deaths and Marriages in England and Wales, Pt I, PP 1914, XIV. Abridged life tables for types of areas and for each county are given in the Decennial Supplement to the 75th Report, Pt II, PP 1920, X. D. Tabutin, 'La Surmortalite feminine en Europe avant 1940', Population, 33 (1978), pp. 121-48. A wide-ranging though very inconclusive discussion of the issue, includ ing some useful points of clarification by Richard Wall, appears in a special section of Annales de Demographic Historique (1981); see also S. R. Johansson, 'Sex and Death in Victorian England: An Examination of Age- and Sex-Specific Death Rates', in M. Vicinus, ed., A Widening Sphere: Changing Roles of Victorian Women (1977), pp. 163-81. R. S. Schofield, 'Did Mothers Really Die? Three Centuries of Maternal Mortality in "The World We Have Lost"', in L. Bonheld et al., eds., The World We Have Gained (Oxford, 1986). Flinn, ed., Scottish Population, pp. 296-7, arrives at a figure of over 6 per cent for eighteenth-century Scotland while suggesting that Edinburgh in the 1750s may have had a rate of between 14 and 18 per 1,000 live births.
Cambridge Histories Online © Cambridge University Press, 2008
The social implications of demographic change
19
51
thousand, though with significant local variations. Maternal morta lity then fell steeply to only 0.5 per thousand births in 1952 (compare 0.1 per thousand births in 1978). However, since female children under the age of 15 also showed excess mortality over males, and went on doing so for so long, other factors than maternal mortality must have been involved. Much of the excess, particularly in rural areas, was due to high levels of respira tory tuberculosis, and the pattern on a registration district and county basis reveals that poor agricultural areas, and districts with large unskilled working-class populations, were especially affected. This in turn suggests that part of the responsibility lies with low levels of nutrition, particularly during the adolescent growth spurt, a by product of a contemporary insistence on trying to keep the male 'breadwinner' well fed even during hard times; it is noticeable in this context that other areas with high excess rates were mining dis tricts where the same culturally maintained bias in food allocation seems to have been present. Women and girls in these areas may also have had less access to other household resources, including washing facilities and changes of clothing. Additional factors in the female excess were probably that women and girls spent more time indoors in a poorly ventilated (and often, given contemporary dress and cooking techniques, dangerous) environment, and the fact that it would have been largely to women and girls that the task of nursing the sick would have been delegated, thus compounding the risk of infection, notably from diseases like tuberculosis. 52
53
Available evidence on urban-rural, on other inter-community and on occupational differences in mortality before the mid-nineteenth century is scarce, but it is clear that variation in mortality between different areas (and even between different rural areas) was very signi ficant. As we have already seen, in the second half of the eighteenth century, infant mortality in the market town of Gainsborough was three and a half times that of the remote and scattered coastal parish 51
52
53
The rate seems to have risen in Scotland in the first third of the twentieth century parallel with the increased hospitalisation of births (Flinn, ed., Scottish Population, P. 297). Report on Confidential Enquiries into Maternal Deaths in England and Wales, 1976-1978, DHSS Report on Health and Social Subjects, No. 26 (1982), p. 1. A similar pattern may be observed in Scotland though nationally only for the 1 0 - 1 4 age group for the period 1861-70 (Supplement to the 48th Detailed Annual Report, PP 1906, XXI, pp. xciii-xciv); however, reference to the successive Detailed Annual Reports suggests that this still unresearched phenomenon remains visible, at least in rural areas, for most of the nineteenth century.
Cambridge Histories Online © Cambridge University Press, 2008
20
M I C H A E L
A N D E R S O N
54
55
of Hartland; in London infant deaths were clearly higher still. At the same period similar if slightly smaller differences can be seen at the other childhood age groups. For the nineteenth century we are on surer ground once the Regis trars General began to produce regional and occupational statistics. Woods has calculated that a male baby born in Liverpool in 1861 could expect on average to live for twenty-six years. A similar baby born in Okehampton could expect to live for fifty-seven years; Bristol, Birmingham, Leicester, Derby, Manchester, Sheffield, Hull, New castle and parts of industrial Lancashire had mortality rates about as high as Liverpool while there were many rural areas at least as favourable as Okehampton. However, high mortality was not just a function of urban living. Some rural parishes, and especially those around the Wash and on the north Norfolk coast, had infant mortality levels as bad as, or worse than, all but the most insanitary areas of London, and had male life expectancy at birth of well below 45. Some non-urban areas like the Cornish mining districts had a very high level of adult male mortality. Woods comments correctly that T h e r e was . . . as great a range of mortality experience in England and Wales in the 1860s as there was between that of England and Wales as a whole in the 1840s and the 1960s, namely some 30 y e a r s / Similarly large differences can be observed for Scotland where the Registrars General very conveniently distinguished cities, towns and rural areas in their statistics. In 1861 the crude death rate in the four Scottish cities was 28.1, while in the other towns it was 23.4; in the rural areas taken as a whole it was only 17.9. In the counties of Caithness, Orkney and Shetland the figure was only 1 5 . 5 . 56
57
58
59
In England and Scotland the mortality differences between areas fell over the second half of the nineteenth century, largely as a result of a fall in urban rates at a time when rural rates showed only hesitant improvement in many areas. In Scotland, for example, the rural death 54
55
56
57
58
59
Wrigley and Schofield, 'English Population', p. 179. Wrigley and Schofield, Population History, p. 253. Maternal mortality was also much higher in the parishes with high infant death rates (Wrigley and Schofield, 'English Population', p. 181). R. I. Woods, 'The Structure of Mortality in Mid-Nineteenth Century England and Wales', Journal of Historical Geography, 8 (1982), pp. 373-94. Ibid., p. 376. The figures here and in the next paragraph are from Flinn, ed., Scottish Population, p. 382; it may be noted that the rural death rate was actually higher in 1890-2 than it had been in 1860-2. For more detail see M. Anderson and D. J. Morse, 'The People', in W. H. Fraser and R . J . Morris, eds., People and Society in Scotland, vol. 2 (Edinburgh, 1989).
Cambridge Histories Online © Cambridge University Press, 2008
The social implications of demographic change
21
rate was 64 per cent of that for the cities in 1861, 83 per cent in 1891 and 91 per cent in the 1930s. Even by the post-Second World War period, however, considerable differences remained between different parts of the country. In England and Wales, for 1949-53, the male rural standardised mortality rate (the rate, that is, controlled for differ ences in the age structures of different areas) was only 79 per cent of that for conurbations; the rural rate for women was 91 per cent of that for conurbations. For the Tyneside conurbation the male rate was 45 per cent above the rural average and that for females was 40 per cent higher. Even at their worst, however, these urban-rural and regional differ ences were small compared with differentials between occupational groups. The first even roughly reliable national figures on occupational mortality became available only for the 1860s and 1870s (and then only for England and Wales). By then some of the worst sources of high mortality in such occupations as mining and seafaring had already been removed. In almost all records for the nineteenth century the healthiest group was the clergy, combining as they did a middle-class life style with a high propensity to live in the country side. If we take the clergy as our standard and restrict ourselves to the age groups 25-44 (the group where the social consequences of high mortality were at their worst) we obtain the figures on occupa tional differentials shown in Table 1.1. 60
In examining this table two preliminary points may be noted. First, the worst occupations were not in general factory employments; instead the high-risk jobs involved, in the main, old, often heavy manual, technology. Second, when comparing 1900-2 with 1860,1861 and 1871 it should be remembered that overall mortality fell markedly between the two periods, from 11.3 per thousand for all males at the earlier dates to 8.4 per thousand at the later. All the occupations shown in the table saw some improvement in their mortality between the two dates, though, bearing in mind that the later data are for all occupied males while the earlier are for all males, the improvement for innkeepers hardly represents much real amelioration. Perhaps the most remarkable feature of Table 1.1 is the fact that the occupational differences in general widened over time. At the end of the nineteenth century, thirty years after the problems had 60
Registrar General's Decennial Supplement for England and Wales, 1951, Occupational Mor tality, Pt II, vol. I, Commentary (1958), p. 86.
Cambridge Histories Online © Cambridge University Press, 2008
22
MICHAEL
ANDERSON
Table 1.1 Death rates per thousand living, and standardised mortality ratios compared with clergy, 25-44 age group, England and Wales, 1860, 1861, 1871 and 1900-2 I860,1861,1871
1900-2
Occupational group
DR per 1,000 SMR
DR per 1,000 SMR
Clergy Farmers and sons Corn miller Carpenter/joiner Barrister/ solicitor Cotton manufacture Fisherman Potter/earthenware manufacture Tailor Printer Glass manufacture Innkeeper Barger/lighter/waterman File maker Chimney sweep/soot merchant
6.0 7.7 9.3 9.4 10.0 10.7 11.3
100 128 155 157 166 178 188
3.4 4.8 6.9 6.2 6.0 7.2 9.5
100 141 182 182 176 212 279
12.6 12.9 13.0 13.2 18.0 15.0 16.3 17.5
210 215 217 220 233 250 272 292
9.0 7.5 7.9 9.3 17.9 11.0 13.4 12.0
265 220 232 274 526 324 394 353
-
_
188
7.8 8.4
229
11.3
All occupied males All males
-
Sources: See n. 42.
first been identified by the Registrar General, file makers were still dying in large numbers from respiratory disease from flying grit and from lead poisoning from the moulds used to hold the files; chimney sweeps remained at the top of the cancer mortality list; potters and tin miners were still succumbing to tubercular conditions exacerbated by dust; seamen, fishermen, bargees and lightermen, dock labourers and coalminers, railway labourers and shunters were still high on the accident list - fifteen times or more likely to die an accidental death than were the clergy; innkeepers and inn servants died in their hundreds from the effects of excess alcohol consumption and from tuberculosis. A few improvements could be observed; fewer match girls were dying of phossy jaw, though legislation to ban white phos phorus match production had to wait until 1910. Improved ventilation significantly improved conditions in cotton mills. On the other hand, technological developments also brought new hazards in their wake,
Cambridge Histories Online © Cambridge University Press, 2008
The social implications of demographic change
23
like mule spinners' cancer, attributable to a change to mineral oils for lubrication of the machinery. Overall, the twentieth century, against a background of rapidly fall ing mortality, saw a very gradual narrowing of occupational differ ences, though in some areas they widened still further. By 1951 the few remaining tin miners showed a standardised mortality ratio (SMR) against all occupations of 617 compared with 141 in 1890-2. Seamen were up from 135 in 1890-2 to 233 in 1949-53, and dockers from 188 to 233. Tool grinders still had mortality 50 per cent above average. Mine workers' chances of dying in an accident outside the home but not in a vehicle remained eleven times those of clerical workers, and for railway platelayers the excess probability was over sixteen times. New problems emerged among groups like medical radiographers, while car and coach proprietors had an SMR of 427 in 1949-53. But elsewhere much was greatly improved. Pottery workers saw their SMR fall from 171 in 1890-2 to 133 in 1949-53; the figures for textile workers were down from 114 to 103. Looking, as we can in the twentieth century, from the point of view of Social Classes, we can see a clear amelioration for the unskilled worker. In 1921-3 Registrar General Class 5 workers aged twenty to sixty-four had mortality 52 per cent above that of Class 1. By 1930-2 the differen tial had fallen to 23 per cent. By 1949-53, using 1931 Social Class definitions, it was down to 18 per cent. However, just as some urban-rural and regional differences are attributable in great part to occupational differences, so much of the occupational difference was only indirectly connected to work con ditions. As many seamen and more dock labourers died around 1900 of respiratory TB than died in accidents. More significantly, perhaps, the wives and children of many men in high mortality occupations also had high death rates. In 1949-53 the wives of coal hewers and getters had an SMR of 146 compared with their husbands' 153, while 61
61
These figures and those in the next two paragraphs are calculated from the successive Decennial Supplements to the Reports of the Registrar General of Births, Deaths and Mar riages in England and Wales (see also n. 42 above). The first Report to give detailed discussion of the mortality of married women by husbands' occupation is that for 1930-2; infant mortality is first discussed in the Report for 1910-12 and in more detail in the Report for 1920-2; a considerable amount of retrospective information is pre sented in the Report for 1949-53 (see n. 60 above). Some of the difficulties of assessing the precise patterns of change in the twentieth century (and particularly of changes between 1930-2 and 1949-53) are discussed in E. R. Pamuk, 'Social Class Inequality in Mortality from 1921 to 1972 in England and Wales', Population Studies, 39 (1985), pp. 17-31.
Cambridge Histories Online © Cambridge University Press, 2008
24
MICHAEL
ANDERSON
fishermen's wives, with an SMR of 126, were actually worse placed in the league table of mortality than were their husbands. At the Social Class level the same was true, though over time some narrowing took place. In 1930-2 the wives of men in Class 5 had mortality chances 40 per cent higher than those in Class 1; by 1949-53 the differential was down to 15 per cent. Nevertheless, in certain areas very significant differences remained. As mortality from respiratory tuberculosis fell after the First World War the Class differences in mortality from the disease widened; for Class 5, wives' mortality was three times that of Class 1 in 1949-53, compared with two and a half times in 1930-2. Maternal death rates for Class 5 wives remained almost 50 per cent above that of wives of Class 1 even though other Class differences narrowed significantly. Differential mortality among children aged between four weeks and one year fell hardly at all between 1921 and 1949-53: Class 5 figures were 403 per cent of Class 1 in 1921 and 381 per cent in 1949-53. Compared even with Class 2, infants in Class 5 in 1951 were more than three times as likely to die of a whole range of conditions, includ ing whooping cough, meningitis, pneumonia, suffocation by food and accidental suffocation in bed or cradle. For gastroenteritis the excess was 311 per cent, a significant relative deterioration on the 140 per cent excess of 1921; though Class 5 gastroenteritis mortality had fallen 84 per cent in the intervening period, for Class 1 the fall had been 88 per cent and for Class 2 it was 91 per cent. In sum, the rapid fall in mortality in the last 100 years of our period was not primarily a process whereby those with the highest mortality caught up with those more favourably placed at the outset. Rather, in general, all classes benefited roughly equally, not a surprising con clusion perhaps if we remember that it was a fall in infectious diseases which provided almost all the improvement overall and that, while in most cases the lower classes had had higher death rates from these diseases, the higher classes had also succumbed in large numbers (and the children of the lower classes remained to the end predomi nantly those who continued to suffer the most). Nevertheless, overall, mortality fell dramatically over our period and the overall effects of these changes can most easily be appreciated if we examine the survival chances of a number of cohorts born in England or England and Wales at roughly thirty-year intervals between 1681 and 1946. The experience of these different groups is charted in Figures 1.4 and 1.5; Table 1.2 gives a more detailed
Cambridge Histories Online © Cambridge University Press, 2008
The social implications of demographic change
25
1,000^ •—1946
900-II
Surviivors per 1,000 born
800
7001921
\
600-
500-
400-
300A J 9 7 6 LIFE 200\V1891
\\V1861 ^\\V1831
100-
^1771 1711
1681 -i
1
10
1 — i
20
1
1 — i
3 0
1 — i
40 Age
1 — i
50
1
60
1
1 — i
70
i
8 0
Figure 1.4 Survivors by birth cohort (males), England and Wales, 1681-1946 Notes and sources: See n. 42 and the appendix to Anderson, 'What Is New'; the figures relate to England until the mid-nineteenth century, and to England and Wales thereafter. breakdown of the figures and compares them with the non-cohorted 1975-7 English life table. The graphs show the slow improvement in survival over the first 150 years of our period and the dramatic improvements of the twentieth century. The impact of the First World 62
62
The figures for 1741 and 1801 are excluded from the graphs for clarity of presentation; they fall roughly midway between 1681 and 1711, and between 1771 and 1831 respecti vely. The figures were calculated by applying to each cohort separately, for each five-year period of life (single years below age 5), the life table survival experience nearest in time to the date at which the cohort would have passed through any particular age. Thus, for example, for the 1861 birth cohort, survival for the period 1886-90 was calculated by taking survival from ages 25 to 29 from the 1881-90 life table, while survival between 30 and 34 and 35 and 39 was taken from the 1891-1900 life table. For the period after 1841 the results were checked against R. A. M. Cash et al, The Chester-Beatty Research Institute Serial Abridged Life Tables, England and Wales, 1841-1960, 2nd edn (1983), but allowance was made for war deaths using data from Winter, 'Some Demographic Consequences'.
Cambridge Histories Online © Cambridge University Press, 2008
26
MICHAEL
ANDERSON
1,000-1 " • 1 9 4 6
r
^ \
900\ 800^'192l\
c
700-
o § ©
600-
®
500\
o |
^\
400-
1976 life
^\
\\ s
\
\
3 CO 1
\
300\
\ *
\ \ \ > \ ,
N
%
x
\ \ \ \
\
200-
^ 891
\ \
\ \ ^
\ 1861
\v\z1831 100-
\\Y/I771 /T1711 1681
0
1
1
10
I
1
1
20
30
1
1
40 Age
1
1
i
50
60
i
i
70
i
i
80
Figure 1.5 Survivors by birth cohort (females), England and Wales, 16811946 Notes and sources:
As Figure 1.4.
War is clearly evident; even for this cohort of men aged 23 in 1914, about one in eleven would have died as a direct result of the war; had we taken the cohort aged 18 in 1914 the figure would have been one in eight. The postwar influenza epidemic took a further heavy toll in the same age groups. Few families and almost no communities escaped the impact of these sudden demographic and personal shocks, equal in many ways in their impact on the adult males of local populations only to some of the major epidemics of the early modern period. In 1711, the median age at death was about 32 for males (35 for females); by the 1771 cohort it had reached just 35 (37), for the 1831 cohort 44 (46), for the 1861 cohort 49 (56) and for the 1891 cohort, heavily depleted as it was in its youth by the First World War, 57 (69). The same percentage of the 1921 male cohort has survived to be
Cambridge Histories Online © Cambridge University Press, 2008
The social implications of demographic change
27
Table 1.2 Percentages of males and females dying in different age spans, by birth cohort, 1681-1946, and according to the 1975-7 life table Year of birth
Life table
1681 1711 1741 1771 1801 1831 1861 1891 1921 1946
1975-7
MALES Percentage dead by 1 26 5 42 25 52 82 65
20 33 45 78
23 38 48 79
20 33 44 75
20 33 43 74
16 28 38 72
16 27 36 65
17 25 31 59
17 63
18 60
18 59
16 56
15 54
18 52
12 45
8 40
20
32
28
35
37
44
50
58
FEMALES Percentage dead by 1 21 5 39 25 49 65 79
16 30 43 75
19 34 45 75
16 30 41 72
16 30 41 70
14 25 36 68
15 24 33 58
15 22 26 44
18 58
19 56
17 55
16 52
15 50
18 47
12 38
6 24
26
35
32
38
41
47
57
70
Percentage dying between 5-25 25-65 Median age at death
Percentage dying between 5-25 25-65 Median age at death
9 13 16
3 5 7
-
4
1
1 2 3 28
1 16
-
-
-
73
7 11 14
3 4 5
-
-
1 1 2 17
3
-
1
-
1 15 79
Sources: See n. 42; the 1975-7 life table is from Annual Abstract of Statistics (1983).
65 as survived to be 5 in the 1711 and 1771 groups. Of the 1946 cohort of males, 94 per cent survived to be 10. As recently as the 1921 cohort this figure was only 87 per cent, while for the 1891 and 1711 cohorts the figures were 73 per cent and 63 per cent respectively (the figure for the 1978-80 English life table is over 98 per cent). No matter from what angle one approaches the figures, the twentieth century clearly reveals the sharpest improvements in life-chances. Equally important, it is only well into the twentieth century that mortality reached a sufficiently low level that its possibility of occurrence in any year could more or less be ruled out of the forward thinking of anyone aged between one and late middle age. The possible conse quences of this change for a wide range of attitudes and behaviour (images of children, prospects of inheritance, investment and career 63
63
Annual Abstract of Statistics, 119(1983), Table 2.31.
Cambridge Histories Online © Cambridge University Press, 2008
28
M I C H A E L
A N D E R S O N
planning, willingness to undertake risky ventures like emigration or military service) still remain largely unexplored. 64
Ill
BIRTHS,
MARRIAGES AND
THEIR
IMPLICATIONS
Figure 1.2 has already demonstrated the overall trend of the birth rate in our period for England and Wales: a peak around 1800, stability until the 1870s, followed by a decline to very low levels in the 1930s (with 1933 as a low point), and then a sudden if temporary recovery after the Second World War. The crude birth rate is susceptible to arbitrary fluctuation if the age structure of the population changes over time. However, similar patterns can also be seen in the gross reproduction rate (GRR); this provides an estimate, for a girl born in any year, of the number of female children that she would bear by the end of her childbearing period, if age-specific fertility rates remain unchanged. Since the GRR is not affected by population age structure it is clear that there were major and genuine variations in fertility in the period under review. These variations must have been due to some combi nation of changes in marriage patterns, changes in illegitimacy and changes in the numbers of children born to married women. Each of these are now examined in turn. Taking first the proportions of the population never married, no national evidence is available for Scotland before the mid-nineteenth century. In England and Wales the proportion of women never mar ried seems to have fluctuated between 9 and 12 per cent in the eigh teenth and early nineteenth centuries; it reached rather over 10 per cent by the mid-nineteenth century and more than 14 per cent in the first third of the twentieth; thereafter, the fall to the historically low level of the 1970s began in the late 1930s. The problem of how nineteenth-century society found appropriate social roles for the large numbers of single middle aged and older people of both sexes remains to be fully explored, but we already know that lodgings for men, living with kin in old age for women, posts as domestic servants and governesses, and annuities given to spinster daughters by their fathers' wills, all form parts of the answer. 65
66
64
65
66
For a first attempt, see M. Anderson, T h e Emergence of the Modern Life Cycle in Britain', Social History, 10 (1985), pp. 69-87. Schofield, 'English Marriage Patterns'; Mitchell and Deane, Abstract, pp. 15-18. For an amplified discussion see Anderson, 'Social Position of the Spinster'.
Cambridge Histories Online © Cambridge University Press, 2008
The social implications of demographic change
29
The celibacy rates for Scotland have, since records began, been somewhat higher than those for England/England and Wales, a phe nomenon due in part to low rates of nuptiality in the more remote and sparsely populated rural areas. It is hard to avoid the conclusion, however, that the particularly high celibacy figures for Scotland (with around one fifth of women remaining unmarried right up to the Second World War) were in part a reflection of a society where emi gration meant that at no prewar census were there ever more than ninety-two men aged 2 5 - 9 for every hundred women in that age group; in 1861 the figure was as low as seventy-seven. Against this background of high emigration it is worth noting that in 1921, in both England and Wales and in Scotland, a larger percentage of both men and women were married in the 20-4 and 2 5 - 9 age groups than had been in 1911; whatever else the First World War had done, it had not, as is sometimes alleged, removed so many men as to leave a whole generation of women condemned to spinsterhood. So far, attention has been concentrated on the men and women who never married, but socially just as important were the widowed. As might be expected, the high rates of mortality noted earlier pro duced high rates of marital break-up through death. Some approxi mate estimates can be made by using published distributions of the combined ages of husbands and wives at marriage, linked to cohort life tables for the median age at marriage group, and with the simplify ing assumption that deaths of husbands and wives were statistically independent. On this basis it can be estimated that about 24 per cent of marriages of couples marrying in the later 1730s would have had their marriages terminated by death within ten years, while around 56 per cent of marriages would not have lasted twenty-five years; only 15 per cent would have lasted for forty years or more. Improve ment thereafter was only gradual for a century or more. For the cohort marrying in the 1850s, about 19 per cent of marriages would not have lasted ten years, and around 47 per cent twenty-five; for the 1880s cohort the figures are 13 per cent and 37 per cent respectively. The experiences of many of those marrying in the early years of the twen tieth century were drastically curtailed by the slaughter in the trenches in the First World War, but for the rest the improvement in adult mortality produced a marked reduction in the early termination of marriages through death. On the assumptions used here, 91 per cent of their marriages lasted at least ten years, and 74 per cent twenty-five; 44 per cent lasted for forty years or more. If we again ignore the
Cambridge Histories Online © Cambridge University Press, 2008
30
M I C H A E L
A N D E R S O N
(much smaller) war losses oi the Second World War, just 5 per cent of marriages of the late 1930s were ended by death within ten years; 85 per cent of couples who had not divorced (79 per cent of all couples) reached their Silver Wedding Day. Thereafter, divorce rather than death became the great disrupter of marriages, producing in the 1980s total disruption rates very similar, when duration is controlled, to those by death alone for the 1820s. One immediately important effect of the high rates of marital disrup tion through death, right up to the twentieth century, was a high incidence of living widowed persons. There are no good estimates available before the mid-nineteenth century but in the second half of that century at any one time around 2 per cent of men aged 25-34 (3 per cent of women) were widowed, around 4 per cent of men aged 35-44 (8 per cent of women), 7 per cent of men aged 45-54 (16 per cent of women), and 14 per cent of men aged 55-64 (30 per cent of women). These figures fell slowly over the nineteenth century (they actually rose for a time for the 55-64 age group), then fell faster in the twentieth century. However, even by 1951 some 7 per cent of men aged 55-64, and 22 per cent of women in this age group were widowed. Given, as we shall see, a longer period of childbearing, one side-effect of these high nineteenth-century levels of widowhood was a very significant number of children in single parent, and especially in female headed, households. Another consequence was the presence in the society in old age of a very large surplus of widowed women, most of whom were dependent on other than earned income for their support. One other source of marital dissolution should also be mentioned briefly here: disruption of marriages through separation and divorce. Separation is almost impossible to quantify, there being only scanty and unsystematic legal provision before 1895 (and therefore no reliable documentation). By the early twentieth century, however, about 67
67
M. Anderson, 'What Is New about the Modern Family: An Historical Perspective', Office of Population Censuses and Surveys (hereafter OPCS), Occasional Papers, no. 31 (1983). The figures used in this paragraph differ slightly from those employed in the 1983 paper, which employed a further simplifying assumption that all couples married at the median age at marriage for their cohorts. The new estimates published here are derived from work undertaken in collaboration with Frances Proven and Geoff Cohen, and incorporate bivariate age at marriage distributions from Wrigley and Schofield, 'English Population', and from the Annual Reports of the Registrar General for England and Wales; in practice, the difference in results produced by the two methods are fairly small until the most recent birth cohorts.
Cambridge Histories Online © Cambridge University Press, 2008
The social implications of demographic change
31
10,000 mainly working-class women were obtaining orders for main tenance in England and Wales each year; this figure reached nearly 20,000 by the late 1940s. By contrast, divorce was statistically fairly unimportant until right at the end of our period; nevertheless, success ive stages of liberalisation of legislation (in England and Wales in 1857, 1923 and 1937; in Scotland in 1939) caused much stir at the time and were accompanied by, though probably did no more than marginally cause, upward steps in the divorce rate. In England and Wales (the trend in Scotland was similar) the number of decrees of divorce and annulment rose from only about 330 in the whole period between 1700 and 1857 to an annual average of about 150 in the 1850s, 275 in the late 1870s and over 600 immediately before the First World War. In the early 1930s the annual figure passed 4,000 and by the late 1940s was over 30,000 having risen dramatically during and after the war. Petitions per 10,000 marriages were 1.38 in 1911, 3.86 in 1921, 6.34 in 1937 and 26.98 in 1950. 68
One factor which somewhat mitigated these effects, however, was the high incidence of remarriage. Wrigley and Schofield have noted that in the sixteenth century 'Perhaps as many as 30 per cent of all those marrying were widows or widowers' and it seems likely from the scattered available evidence that in the second half of the eigh teenth century in England and Wales the figure was still between 15 per cent and 20 per cent. By the mid-nineteenth century about 14 per cent of males and 9 per cent of women who married were widowed. The figures fell slowly for the rest of the century, reaching 8.9 per cent and 6.6 per cent respectively in the early 1900s, 7.3 per cent and 4.6 per cent in the early 1930s and 6.4 per cent and 5.4 per cent in the early 1950s. 69
70
So far this section has focussed primarily on the fairly dramatic long-term changes in the proportions of the population who entered,
68
69
70
O. R. McGregor et al, Separated Spouses: A Study of the Matrimonial Jurisdiction of Magistrates Courts (1970), pp. 15-16, 3 2 - 5 . O. R. McGregor, Divorce in England (1957), chaps. 1, 2. The annual figures for England and Wales and for Scotland are usefully collected in B. R. Mitchell and H. G. Jones, Second Abstract of British Historical Statistics (Cambridge, 1971), pp. 31-2; a more analytical review, including data on changes by 'Social Class' can be found in G. Rowntree and N. H. Carrier, 'The Resort to Divorce in England and Wales, 1858-1957', Population Studies, 11 (1958), pp. 1 8 8 233. Wrigley and Schofield, Population History, p. 258. The full series of statistics can be found for the period since 1900 in OPCS, Marriage and Divorce Statistics (1982), Ser. FM2, no. 7, Table 3.2; earlier series are in the Annual Reports of the Registrar General.
Cambridge Histories Online © Cambridge University Press, 2008
32
M I C H A E L
A N D E R S O N
re-entered, and remained in, the marital state. Compared with these aspects, changes in the age at which marriage occurred were much less significant. Before the second half of the nineteenth century pre cise data are difficult to obtain since even in the early years of civil registration in England and Wales age information was only patchily recorded, and there was wide variation between different areas. Scho field, modifying his earlier estimates based on family reconstitutions, has suggested that mean marriage ages for women fell sharply in the later eighteenth century. Women born around 1716 had mean first marriage ages of 25.3, while those born around 1791 married on average at about 22.6 years of age; the falls were particularly due to rising proportions of women marrying at very young ages. There after, it seems that mean and median marriage ages increased sharply, with the 1816 birth cohort having a mean marriage age of around 25.3, a figure consistent with national figures for the late 1850s when we can compute approximate median ages of 24.4 for men and 22.9 for women, rising to 26.7 and 24.4 in the late 1910s and falling to 25.2 and 22.4 by 1951. For Scotland, the evidence is thinner, though the nineteenthcentury evidence is compatible with England. Flinn and his colleagues are rightly sceptical of contemporary comment which suggests very low marriage ages in eighteenth-century Scotland (though the possi bility of quite low marriage ages in the Islands and the coastal fringes of the Highlands cannot be ruled out). The estimated median female marriage age for Kilmarnock in the mid-eighteenth century of 23.5 is comparable with English figures but more interesting is the finding that 'urban' wives had a median marriage age which was over six years younger than women from the rural sector, a discovery which certainly matches the suggestions of scholars who believe that in eigh teenth-century England marriage ages were particularly low in areas and among groups exposed to more commercialised production 71
72
73
71
72
73
Schofield, 'English Marriage Patterns'; the importance of changes in the age distribu tion of marriage is discussed in J. A. Goldstone, 'The Demographic Revolution in England: A Re-Examination', Population Studies, 40 (1986), pp. 5 - 3 4 . Figures back to 1901-5 are given in OPCS, Marriage and Divorce Statistics, Table 3.5 (though the figures for 1906-10 and earlier appear inconsistent with those previously published in the 1938 Registrar General's Statistical Review, Table K, which go back to 1896); earlier figures are in the 59th Annual Report of the Registrar General, England and Wales, PP 1897, XXI, pp. xiii-xiv. The Scottish material cited in this paragraph is drawn from Flinn, ed., Scottish Population, pp. 274-9.
Cambridge Histories Online © Cambridge University Press, 2008
The social implications of demographic change
33
whether through certain kinds of capitalist agriculture, other daylabour, or through proto-industry. In the later nineteenth and early twentieth centuries there is clear evidence of regional and occupational differences in the age at first marriage. Using an indirect method computed from the percentages single at the 1861 census, the range in the estimated mean ages at marriage in the registration districts of England and Wales can be estimated as 9.7 years for males and 9.0 years for females. One extreme district, Auckland in County Durham, had 59 per cent of its female population aged 2 0 - 4 married; another, Hampstead in London, had only 12 per cent. In Dudley in Staffordshire 96 per cent of the female population aged 4 5 - 9 were married while in Fylde in Lancashire the figure was only 68 per cent. Further analysis suggests that marriage was especially delayed in the relatively few areas still characterised by small family farms and where the non-familial labour supply in the area consisted largely of living-in farm servants. Mar riage was also delayed for both sexes in areas (mainly with high mid dle-class populations) characterised by high incidences of domestic servants. The age at marriage for both sexes was significantly linked to local sex ratios, reflecting imbalances of in- and out-migration in areas with highly gender-skewed labour markets. To a limited extent, high concentrations of local employment in agriculture pulled down the marriage age somewhat, but neither high levels of female employ ment nor high levels of employment in coal mining, textiles, metals and engineering had much independent effect on marriage patterns at the registration district level. At the individual level the most reliable evidence on marriage ages for any part of our period was computed by staff of the English Regis trar General's office for 1884-5 and is reproduced in Table 1.3; the median figures have been computed from the published quinquennial distributions of the age of the population at marriage and are therefore only approximate. Clear discrepancies arise between the marriage pat terns of the professional classes and of farmers on the one hand, and of mining and textile workers on the other. At other points in the hundred years before 1950 only indirect indi74
75
74
75
Goldstone, 'Demographic Revolution'; D. Levine, Family Formation in an Age of Nascent Capitalism (1977); see also his review of Wrigley and Schofield's Population History in Social History, 8 (1983), pp. 148-59. For more detail see M. Anderson, 'Marriage Patterns in Victorian Britain: An Analysis Based on Registration District Data for England and Wales', Journal of Family History, 1 (1976), pp. 5 5 - 7 8 .
Cambridge Histories Online © Cambridge University Press, 2008
34
MICHAEL ANDERSON
Table 1.3 Mean and median ages at marriage, England and Wales, 1884-5 Bachelors
Spinsters
Occupational group
Mean
Median
Mean
Median
Miner Textiles Shoemaker, tailor Artisan Labourer Commercial clerk Shopkeeper / shopman Farmers and relatives Professional/independent
24.1 24.3 24.9 25.4 25.6 26.3 26.7 29.3 31.2
23.5 23.6 23.8 24.2 24.3 25.5 25.5 28.1 29.6
22.5 23.4 24.3 23.7 23.7 24.4 24.2 26.9 26.4
21.6 22.5 23.2 22.9 22.8 23.4 23.7 24.9 24.7
All
26.1
24.6
24.6
23.3
Source: W. Ogle, 'On Marriage Rates and Marriage Ages.. / , Journal of the Royal Statistical Society, 53 (1890), pp. 253-80. 6
cators of marriage ages can be obtained, but they suggest relatively little change in the overall patterns. At all times, except perhaps in the interwar period, miners married young and married wives on average a year or more younger than the general population. Textile workers, together with other semi-skilled factory workers, also showed some tendency to younger marriage, particularly in the nine teenth century. At the other extreme, throughout the period, farmers and the professional and higher administrative classes typically mar ried at least two years older than the average and had wives at least one year older, though still substantially younger than themselves (over four years for farmers and nearly four for professional workers in 1851). There is some evidence, however, to suggest that pro fessionals were particularly likely to delay marriage in the second half of the nineteenth century, and that, subsequently, some shift towards the average pattern for the population as a whole may have occurred. These changes in marriage patterns were of major importance in 76
The following sources and methods were used to obtain these extremely approximate results: the 1851 National Sample data on proportions married at different ages; T. H. C. Stevenson, 'The Fertility of Various Social Classes in England and Wales from the Middle of the Nineteenth Century to 1911', Journal of the Royal Statistical Society, 83 (1920), p. 426 (for marriage durations of 0 - 5 years only); W. A. B. Hopkin and J. Hajnal, 'Analysis of the Births in England and Wales, 1939, by Father's Occupation', Population Studies, 1 (1947-8), p. 197; 1951 Census of England and Wales, Fertility Report, age distribution data for women of marital duration of one year (Table B2).
Cambridge Histories Online © Cambridge University Press, 2008
The social implications of demographic change
o
35
—j—i—i—i—i—|—i—i—i—i—j—i—i—i—i—|—i—i—i—i—j—i—i—i—i—|—i—i—i—
1700
1750
1800
1850
1900
1950
Year
Figure 1.6 Illegitimate births per 100 live births, Britain, 1700-1980 Sources: Laslett et al, eds., Bastardy, pp. 14-15,17; Flinn, ed., Scottish Population, pp. 350-1; Annual Reports of the Registrar General of Births, Deaths and Marriages for Scotland. altering the birth rate in our period; indeed, marriage-related changes were the most important single set of factors for the population rise of the eighteenth and early nineteenth centuries. Thereafter, their impact was less (but never without significance for fertility) but from the 1870s onwards it was the number of births per woman, rather than the proportion of women married, which became the crucial determinant of population growth. We can conveniently deal first with illegitimate and premaritally conceived births. Changes in this aspect of behaviour are now one of the best charted areas in historical demography, though the social significance of the trends is a topic of unresolved debate. The figures for England and Wales are charted in Figure 1.6. Further analysis of some of the background to these figures reveals several points of interest. First, there was a close positive relationship between illegit imacy and prenuptial pregnancy; fluctuations in illegitimacy were not simply a result of variations in pressure to enter 'shotgun marriages'. Secondly, there was a close and continuing relationship between illegi timate and legitimate fertility, particularly in the nineteenth century; 77
78
77
78
Wrigley and Schofield, Population History, chap. 7. For a summary of the controversy and a short bibliography, see M. Anderson, Approaches to the History of the Western Family, 1500-1914 (1980), pp. 5 4 - 9 , 89-90.
Cambridge Histories Online © Cambridge University Press, 2008
36
M I C H A E L
A N D E R S O N
this is arguably of interest in attempts to understand the legitimate fertility decline as well as the illegitimate. Thirdly, there was an appar ent inverse relationship between illegitimacy and the age at marriage. These parallelisms suggest that very similar factors were influencing a range of fertility-related behaviour; this view is further supported both by the general closeness in age of those bearing first children in and out of wedlock (the latter being on average only about a year younger in most studies), and by the very high incidence of pre marital conception. Indeed, premarital sex was a normal (though perhaps more or less normal at different points in time) part of the courtship process for very large sections of the population throughout our period. By the early nineteenth century something approaching 20 per cent of first births were illegitimate and over half of all first births were probably conceived outside marriage. By 1938, when official figures for England and Wales become available, 13.4 per cent of all births occurred outside of, or within eight and a half months of, marriage; of all premaritally conceived births, about 70 per cent were legitimated by the marriage of the parents before the birth of the child - comparable figures for 1951 were 12.3 per cent and 60 per cent. At this latter date, however (and almost certainly earlier), by no means all of these extra-maritally conceived maternities were first births; a rough esti mate suggests that both in 1938 and in 1950 less than one quarter of first births were extra-maritally conceived. This pattern whereby the interwar period (and to a lesser extent the immediate postwar period) had particularly high incidences of at least outwardly stable conventional Christian family morality is notable in other areas also; its causes merit more attention than they have so far received. At a more local level there were great, and largely unexplained, differences in illegitimacy. Rural illegitimacy was usually well above urban right through to the 1930s (though from then on the cities tended to top the list). Different community studies reveal large differences between places in the late eighteenth century (for example Colyton between 1741 and 1790 had 7.8 per cent of its births illegitimate, 79
80
81
82
79
8 0
81
82
The evidence is usefully summarised by E. A. Wrigley, 'Marriage, Fertility and Popu lation Growth in Eighteenth Century England', in R. B. Outhwaite, ed., Marriage and Society: Studies in the Social History of Marriage (1981), pp. 137-86; and T. P. R. Laslett et al., eds., Bastardy and its Comparative History (1980), chap. 1. Laslett et al., eds., Bastardy; Levine, Family Formation, chap. 9. Laslett etal., eds., Bastardy, pp. 5 4 - 5 . Registrar General's Statistical Review for England and Wales for the Year 1970, Part II, Tables, Population (1972) Table UU, p. 195.
Cambridge Histories Online © Cambridge University Press, 2008
The social implications of demographic change
37
8
Gainsborough at the same dates only 3.5 per cent). In the nineteenth century, at the county level, equally large differences can be observed, and these seem in many cases to persist over long periods of time (possibly reflecting a local variation in tolerance towards illegit imacy). Interestingly, these variations in illegitimacy are often paral leled by variations in legitimate fertility. The limited evidence for Scotland suggests that a considerable rise in illegitimacy must have taken place between the mid-eighteenth and mid-nineteenth centuries; thereafter the rates roughly paral leled the English, though the turning points were slightly different. What is of particular interest in the Scottish context, however, are the very marked nineteenth-century regional disparities - high in the north-east and south-west, low in the north and north-west; these differences broadly persisted from the time that they were first observ able in 1855 right through to the end of our period. While rural-urban differences were fairly small (with rural areas as a whole somewhat above urban and even above the four cities), differences within the predominantly agricultural counties were enormous. In 1855, 'A teen age girl in Banff was more than 20 times as likely to have a bastard as one in Ross and even for girls in their twenties, the likelihood of becoming an unmarried mother was between four and six times greater in Banff than in Ross.' In general, areas with high illegit imacy tended to have earlier marriage and higher overall fertility and some connection clearly exists also with high premarital preg nancy. But illegitimacy also seems to have been closely related to family and community structure and to women's positions within a family and local economy. In rural areas illegitimacy was high among those groups of the population where parental and community control 84
85
86
87
88
83
84
85
86
8 7
88
Laslett et al, eds., Bastardy, pp. 9 6 - 7 . Ibid., chap. 1; Cumberland in 1870-2 had an illegitimate fertility ratio of 29.2 and Shropshire 28.2; at the other extremes Hampshire had a figure of only 13.6 and Somerset of 13.3; Middlesex was the lowest county with a ratio of 9.4 (ibid., pp. 34-5). Ibid., pp. 32ff. L. Leneman and R. Mitchison, 'Scottish Illegitimacy Ratios in the Early Modern Period', Economic History Review, 2nd ser., 40 (1987), pp. 4 1 - 6 3 . These parallelisms, indeed, go beyond Britain - see, e.g., E. Shorter et al., 'The Decline in Non-Marital Fertility in Europe 1880-1940', Population Studies, 25 (1971), pp. 375-93. Flinn, ed., Scottish Population, p. 353; summary statistics by county and urban/rural divisions from 1861 to 1931/9 can be found on pp. 350-3. Detailed maps of illegitimacy in the late nineteenth century at parish level are currently being prepared by Donald Morse of the University of Edinburgh.
Cambridge Histories Online © Cambridge University Press, 2008
38
MICHAEL ANDERSON Children born (estimated) Children born (fertility c e n s u s e s ) Survivors to a g e 2 5 (estimated) Survivors to a g e 2 5 (fertility c e n s u s e s ) 6-
Q)
3"
1-
01— 1700
1750
1800 Y e a r of birth
1850
1900
Figure 1.7 Completed family size and survivors, England and Wales, 17101930 Notes and sources: See text and n. 92; the illegitimacy corrections use data referenced in the sources to Figure 1.6; data on percentage never married from Wrigley and Schofield, Population History, p. 360, and from censuses of population; life tables as for Figure 1.4.
over courtship was relatively low and where women who bore illegiti mate children could, if necessary, support themselves relatively easily; in the 'peasant economy' areas where these conditions did not apply illegitimacy was at its lowest. Further exploration of English illegit imacy in these terms - and especially in the context of the age and socio-economic position of the mothers - is clearly called for, but awaits the availability to scholars of the nineteenth-century regis tration returns. Finally in this section we turn to marital fertility and especially to completed family size. Figure 1.7 shows estimates of mean completed family size, and of survivorship, for England and Wales (England before the 1831 birth cohort). In the upper pair of lines, the dotted line is derived from an indirect estimating technique based on the gross reproduction rate and originally employed by Wrigley and Schofield to compare the results of family reconstitution with those from aggregative analysis. The solid line gives the Registrar 89
90
89
90
For Scotland, see T. C. Smout, 'Sexual Behaviour in Nineteenth Century Scotland', in Laslett et al., eds., Bastardy, chap. 7. For an interesting recent demonstration of this point for one English settlement, see J. Robin, 'Illegitimacy in Colyton, 1 8 5 1 1881', Continuity and Change, 2 (1987), p. 324. Wrigley and Schofield, 'English Population', Table 12.
Cambridge Histories Online © Cambridge University Press, 2008
The social implications of demographic change
39
General's estimates derived from the two fertility censuses of 1911 and 1951 supplemented by the family census of 1946. The patterns are clear, with a peak of between 5.7 and 6.2 children per married woman being reached for those born between 1771 and 1831 and a steady fall in fertility occurring from the 1870s. Those born in the 1880s had only half as many children to care for, entertain, clothe and feed as their parents had had; their own children had only twothirds as many as they did. In two generations - and across almost the whole population - the average number of children born per mar ried woman fell from around six to only a little over two. In this context, however, the lower pair of lines in Figure 1.7 is also of importance, showing estimates of the average number of chil dren per family surviving to age 2 5 . When compared with the early eighteenth century, by the early nineteenth almost one extra child per family was reaching adulthood; this was the result of higher ferti lity combining with falling mortality to boost survival. Thereafter, further falls in mortality in the later nineteenth century to a great extent offset the fall in fertility; as a result, although the number of children born to each family fell steadily from the 1870s, it was only those marrying in the early twentieth century who managed to reduce the number of their children surviving to adulthood even to the eigh teenth-century level. While women born after the First World War had about one third of the number of children of women born in the late eighteenth and early nineteenth centuries, the number of children surviving to adulthood fell by only some 40 per cent. The benefits to families of falling family sizes can thus be exaggerated - and this may be especially true for lower-class families where earlier child mortality would have been highest. Nevertheless, it remains the case that the standards of living, accommodation, travel and edu cation which developed in the interwar and especially in the postSecond World War periods would have been much more difficult 91
92
93
91
92
93
For a very effective discussion of the possible significance of the very rapid and widespread initial stages of the decline in fertility, see R. I. Woods, 'The Fertility Transition in Victorian England', Population Studies, 41 (1987), pp. 283-311; this paper also provides an excellent review of a number of different interpretations of the fertility decline in England and Wales. These estimates are calculated by applying the life table data described in n. 62 above to the birth data described in the text. In social welfare terms, the benefits were, of course, even smaller since the period of the fertility decline corresponds with a reduction in the earnings opportunities for children both through a contraction of labour demand and limitations on supply imposed by the extensions of compulsory education.
Cambridge Histories Online © Cambridge University Press, 2008
MICHAEL
40
ANDERSON
350^
300
Marriage cohort •
250 o o o
1870-9
m 1900-9 0
1925
•
1951
200
g_ 150 W CD
E E
100
CD
50
0
1
2
3
4
5
6
i 7
L 8
L . 9
1 10
11
12
13
14
15
16
17
N u m b e r of children born
Figure 1.8 Completed family sizes, by marriage cohort, England and Wales, 1870-9 to 1951 Notes and sources: 1911 Census of England and Wales, Fertility Report; papers of the Royal Commission on Population, VI; OPCS, Birth Statistics, Ser. FM1, Table 10.5; the more recent published data exclude information on numbers of children in very large families; the plotted data are rough estimates only, but relate to small numbers of families only.
if not impossible to attain with an average of even an extra two children per family. From a rather different perspective, the social consequences of these shifts were even more significant. Over the eighteenth century, England and Wales had to produce about one third of an additional economic and social 'slot' per person per generation. In the early and mid-nineteenth centuries, by contrast, between three-quarters and one such extra 'slots' per generation had to be found. The impli cation of this for a whole range of phenomena, from housing to welfare expenditure, from emigration to the expansion of domestic service, are clearly considerable. The subsequent contraction in family size was accompanied by two other changes in childbearing behaviour which are arguably of even greater social significance. First, not merely did average family size fall but very small families became, eventually, normative. Figure 1.8 shows estimates of the distribution of family sizes for a number of different marriage cohorts. A clear pattern emerges of an increasing concentration onto small families. For the 1870s the most marked fea-
Cambridge Histories Online © Cambridge University Press, 2008
The social implications of demographic change
41
ture is the wide dispersal of family sizes; no one size category con tained more than 10 per cent of families; more than 5 per cent fell into all sizes from zero to ten. More than one in ten of all families were of eleven children or more, and these families actually included more than a quarter of all children born. In the late nineteenth century, therefore, the family experience both of parents and of children was very diverse, and not merely in terms of the numbers of persons who had to share living space and parental care and affection; given the clear relationship between family size and standard of living, experiences would also have differed markedly even within socio economic groups in opportunities for diversity of diet and access to 'luxuries' like toys, books, trips and education. The other curves in Figure 1.8 show the way in which, from the 1870s to the 1950s, a predominance developed not merely onto the small family but onto the two-child family. This brought with it a steady homogenisation for the mass of the population of many features of growing up. It allowed, for the first time, for example, most children to spend at least part of their childhood in a room of their own, as well as making possible such new goods as the small family car. Secondly, these smaller numbers of children per woman tended increasingly to be concentrated into the earlier years of married life. As early as 1874, Ansell found in his study of upper middle and upper class families that, where only one child was born, childbearing had ceased on average by age 31 and, where family size was two or three, the average age at the end of childbearing was only 34. As the fertility decline got under way, similar patterns seem also to have been adopted by the population as a whole; as a result falling family size was accompanied by a marked shift towards an earlier end to childbearing for the majority of couples. Among the impli cations were significant changes in the processes of socialisation for adult roles, producing by the 1940s, for example, whole generations of women who had never been used to dealing with the needs of a small baby. 94
95
94
95
C. Ansell, On the Rate of Mortality at Early Periods of Life, National Life Assurance Society (1874), p. 69; the full distribution is given in Table XIII, p. 89. For evidence from family reconstitutions for later nineteenth-century Scotland, see A. Gilloran, 'Family Formation in Victorian Scotland' (unpublished PhD thesis, Edin burgh University, 1985); S. P. Walker, 'Occupational Expansion, Fertility Decline and Recruitment to the Professions in Scotland, 1850-1914' (unpublished PhD thesis, Edinburgh University, 1986); and the work in progress by D. Kemmer; see also Woods, 'Fertility Transition', p. 291.
Cambridge Histories Online © Cambridge University Press, 2008
42
MICHAEL ANDERSON
While overall marital fertility levels before the fertility decline were far from maximal, no substantial evidence has yet appeared to sug gest widespread deliberate birth control within marriage before the mid-nineteenth century. The substantial fertility differences which did occur between areas (at the 1851 extremes, married women in Cornwall were around 28 per cent more fertile than married women in London) seem most likely to have reflected differences in infant and foetal mortality, maternal health and nutrition, and infant feeding patterns, though this is not to deny the possibility that some small groups may have been deliberately limiting family size as early as the eighteenth century. What is more certain is that the nineteenthcentury fall in family size did not take place equally across all socio economic groups. Recent research has questioned the older view that the middle classes were the first to practice widespread fertility limi tation, arguing that there was some general downward movement of the indicators for all social groups from at least the 1860s and that the 'social classes' employed by the Registrar General and reproduced in Table 1.4 are too insensitive to capture the full complexity of the onset of fertility decline. These arguments cannot be ignored, though it is still clear that the largest nineteenth-century falls in fertility took place among certain sections of the middle classes, and among some groups closely associated with them. Banks has used the detailed tabulations of the 1911 fertility census to try to identify 'pioneers' within the middle classes (and especially 96
97
98
99
96
97
98
99
Using as a standard the fertility of the Hutterite community of the 1930s (a group where marriage was early and no contraception was employed), the combination of delayed marriage and non-marriage by a substantial number of women reduced fertility in England and Wales to 48 per cent of the standard level. Even within marriage the level of fertility in the 1850s was only some 67 per cent of the Hutterite Standard (A. J . Coale and S. C. Watkins, The Decline of Fertility in Europe (Princeton, 1986), chap. 2). A. McLaren, Birth Control in Nineteenth-Century England (1978), chap. 1. Such is one possible interpretation of the data produced by E. A. Wrigley, 'Family Limitation in Preindustrial England', Economic History Review, 2nd ser., 19 (1966), pp. 82-109; see also Levine, Family Formation, chap. 5. Data on fertility by county for England and Wales and for Scotland are conveniently summarised in Coale and Watkins, Decline of Fertility, chap. 2; an extended though not wholly satisfactory discussion is in M. S. Teitelbaum, The British Fertility Decline (Princeton, 1984). Data at parish level for Scotland are currently being analysed by Donald Morse. Woods, 'Fertility Transition'. There are, however, as Woods recognises, major prob lems of interpretation of the data for this period caused by the fact that the 1911 fertility census data is based for the middle years of the century on a tiny number of survivors whose ages at marriage are certainly not representative of the population from which they were drawn, and whose fertility histories may also be biased if a connection exists between fertility levels and longevity.
Cambridge Histories Online © Cambridge University Press, 2008
The social implications of demographic change
43
Table 1.4 Children born and surviving to 1911, per 100 families, by date of marriage and 'Social Class', 1851-91 Date of:marriage 'Social Class'
1851-60
1861-70
1871-80
1881-5
1886-91
Children born 1 Upper and middle 2 Intermediate 1-3 3 Skilled 4 Intermediate 3-5 5 Unskilled 6 Textile workers 7 Miners 8 Agricultural labs.
642 731 758 744 781 736 823 794
592 663 711 700 737 671 827 728
480 558 629 624 672 584 776 670
396 468 556 557 614 510 723 617
340 409 491 496 558 441 655 545
All occupied All
747 728
700 679
618 605
547 539
487 482
Children surviving 1 Upper and middle 2 Intermediate 1-3 3 Skilled 4 Intermediate 3-5 5 Unskilled 6 Textile workers 7 Miners 8 Agricultural labs.
445 511 502 501 509 473 500 568
440 489 503 501 507 451 550 555
381 432 470 469 483 418 544 536
325 374 430 431 455 378 525 509
286 333 388 390 421 334 486 457
All occupied All
507 489
501 484
464 454
423 416
383 378
Source: Stevenson, 'Fertility of Various Social Classes', pp. 401-32.
has suggested an important role for certain professions and persons in occupations with a clearly laid out career structure). His data for the earliest years are based, however, on very small numbers of mar riages and the differences, which are much less apparent when age at marriage is controlled, appear to be in great part an artefact of the different combinations of ages at marriage of the tiny minority of survivors who married in the 1860s and still survived to 1 9 1 1 . 100
J. A. Banks, Victorian Values: Secularism and the Size of Families (1981), esp. chaps. 4 and 8.1 am grateful to Debbie Kemmer for sharing with me her results and thoughts on Banks's work and on the difficulties of interpreting possible changes in fertility in the period before 1870.
Cambridge Histories Online © Cambridge University Press, 2008
44
MICHAEL ANDERSON
By the marriages of the early 1880s, however, when the data have become robust enough to merit detailed examination, the gap between the least fertile (represented in Table 1.4 by Registrar General's Class 1) and the highly fertile miners (Class 7) was at its historic widest (over three children; it remained at around two even after child morta lity is taken into account). For this group of marriages, even among wives marrying as early as ages 20-4, men in such occupations as barristers (average 3.16 children), physicians, surgeons and general practitioners (3.48), solicitors (3.52), bank officials (3.62), civil and mining engineers (3.71) and persons in scientific pursuits (3.85) all had families of fewer than four children; by contrast, miners with wives in the same age group at marriage had on average 7.36. In view of their intense public opposition to artificial family limitation, the fact that the wives of clergymen of the Church of England in this age-at-marriage group had only 4.01 children is perhaps also of some interest. 101
One effect of these differential shifts in fertility was to produce in the early twentieth century very clear differences not only in average family size but also in the distribution of numbers of children across families of different occupational groups. In Stevenson's table (Table 1.4), the spread between the group with the lowest number of children per family and the group with the highest number was, for the mar riages of the 1850s, only from 14 per cent below to 10 per cent above the average for the population as a whole. With the marriages of the late 1880s, however, this spread was from 30 per cent below to 36 per cent above the average. Figure 1.9, based on the only surviving occupational data for Scotland from the 1911 census, is confined to marriages where the wife was aged 2 2 - 6 at marriage and the marriages had lasted at least fifteen years. While for some of the upper middleclass groups the trend towards the normative two-child family of the twentieth century is already apparent, in other groups (including but not exclusively those where family labour had a crucial part to play in the family economy) a pattern of almost unrestricted fertility remains. 102
101
102
The data in this paragraph are calculated from the 1911 Census of England and Wales, Fertility Report, Pt. II, Table 35. Crofters would be a group particularly likely to retain high fertility for longest accord ing to the model proposed by R. Lesthaeghe and C. Wilson, 'Modes of Production, Secularization and the Pace of the Fertility Decline in Western Europe 1870-1930', in Coale and Watkins, Decline of Fertility, chap. 6; the special conditions affecting the fertility of heavy industry and mining areas are well reviewed in M. R. Haines, Fertility and Occupation: Population Patterns in Industrialization (1979).
Cambridge Histories Online © Cambridge University Press, 2008
The social implications of demographic change
45
Number of children born Scotland Physicians and surgeons Ministers and clergymen Wool and worsted manufacture Coal, shale and iron miners Crofters 1
~i— —i—•
0
1
i— —i—•—i
• i
• — — r [
10 20 30 40 50 60 70 80 90 100 Per cent of marriages
Figure 1.9 Number of children born by occupation of husband, Scotland, 1911 (wives aged 2 2 - 6 at marriage, and marriage duration at least 15 years) Source: 1911 Census of Scotland, III, PP 1914, XLIV, Table XLVII.
103
The 1946 family census data suggest that for marriages of the first third of the twentieth century occupational differentials changed very little. Even among women aged 45-9 in 1951 (most of whom would have married in the late 1920s), the differential between unskilled manual workers (at 132 per cent of the average) and pro fessional and higher administrative workers (at 76 per cent) remained large; by this date (and probably earlier) there is some evidence that patterns of female employment and types of community involvement had begun significantly to influence family size differentials within the working class. In general, however, only among marriages of the 1930s did the occupational differentials begin to fall, and this was in large part due to a continued slow fall in fertility among lower manual workers at a time when the fertility of the rest of the population was beginning to rise again. 104
A useful summary of the relevant data is given in the Report of the Royal Commission on Population (Cmd 7695, 1949), pp. 24ff; the fuller data are presented in D. V. Glass and E. Grebenik, T h e Trend and Pattern of Fertility in Great Britain', Papers of the Royal Commission on Population, 6 (1954). 1951 Census of England and Wales, Fertility Report, pp. xlivff. D. Gittins, Fair Sex: Family Size and Structure, 1900-39 (1982), chaps. 3 - 5 .
Cambridge Histories Online © Cambridge University Press, 2008
46
MICHAEL ANDERSON 70
-i
r
1400
a
0
0 1750
1800
1850
1900
1950
Year
Figure 1.10 Population age distribution, England and Wales, 1751-1951 Notes and sources: Wrigley and Schofield, Population History, pp. 447, 528-9; later figures computed from censuses of population by Wrigley and Schofield's method. The figures relate to England until the mid-nineteenth century and to England and Wales thereafter. IV
STRUCTURAL IMPLICATIONS
OF D E M O G R A P H I C C H A N G E
The previous sections have shown the significant changes which occurred in each of the different demographic phenomena in the 200 years of our period. When the interactions between these elements are explored, some further points of importance emerge. Turning first to the age structure of the population of England/ England and Wales, Figure 1.10, based on Wrigley and Schofield's figures to 1871 and on censuses thereafter, shows changes in the pro portion of the population in the three broad age bands 0-14, 15-59 and 60 and over. The most striking change in proportional terms clearly occurred in the 60 and over age group. In 1766 rather less than one person in every twelve was in this age group and by 1826 the ratio had fallen to one in fifteen. Thereafter the proportion of old people rose steadily over the nineteenth century, to reach over one in thirteen by 1911, nearly one in eight by 1931 and almost one in six by 1951. Within these figures the proportion of very old people - for example of 75 and over - remained fairly stable over the nine teenth century (1.04 per cent were 75 or over in 1801, 1.03 per cent in 1826 and 1.07 per cent in 1851) but then rose slowly (to one person in sixty-nine aged 75 or over in 1911) and then rapidly so that by
Cambridge Histories Online © Cambridge University Press, 2008
The social implications of demographic change
47
1951 one person in twenty-eight was aged 75 or over. Undoubtedly, the mid-twentieth-century aged population (and certainly those in their late 60s and early 70s) was on average healthier and fitter in some 'objective' sense than that of earlier centuries (though man-days lost through ill-health actually rose); nevertheless, rising numbers against a background of falling employment, and in the context of an increasingly formalised right to income maintenance through pub lic and private pension provision associated with a fixed idea of a 'retirement age', were bound to appear to create significant public problems of economic support for the aged. However, as Figure 1.10 also shows, this rise in the aged element in the population took place against a background where, in the twen tieth century, the 'dependency ratio' (calculated here as the numbers 0-14 plus 60 and over divided by the numbers 15-59) reached an all-time low. The main cause of this rapid reduction in the dependency ratio in the late nineteenth century was the fall in the birth rate, but the effect was startling. In 1826 nearly two persons in every five in the population were aged under 15. By 1911 this figure had fallen to three in ten and by 1951 to only just over one in five. The absolute number of 5-14 year olds in 1951 was almost exactly the same as it had been in 1881 (while the population as a whole was 41 per cent larger) and the figure was 17 per cent below that for 1911. The impli cations of shifts of this magnitude both for public services like edu cation and social welfare and for the occupational structure have not been given the attention that they deserve. 105
Looking, finally, from the point of view of 'adults' (those between 15 and 59 were the main producer group even of eighteenth-century society), two particular points merit comment. First, as Wrigley and Schofield have pointed out, the period 1750-1825, often seen as a crucial phase of the 'industrial revolution', took place against a back ground of steadily (if slowly) deteriorating producer/consumer balance. Secondly, more dramatically and perhaps of potentially 106
105
106
In practice, however, there is some suggestion that as early as the eighteenth century most old people were in fact heavily dependent on poor relief - see D. Thomson, T A m Not My Father's Keeper: Families and the Elderly in Nineteenth Century England', Law and History Review, 2 (1984), pp. 265-86; and R. M. Smith, 'The Structured Dependence of The Elderly as a Recent Development: Some Skeptical Historical Thoughts', Ageing and Society, 4 (1984), pp. 413-15. On the spread of the formal practice of retirement, see Anderson, 'Emergence'; and L. Hannah, Inventing Retirement: The Development of Occupational Pensions in Britain (Cambridge, 1986). Wrigley and Schofield, Population History, p. 449.
Cambridge Histories Online © Cambridge University Press, 2008
48
MICHAEL
ANDERSON
real social and economic significance, the interwar depression coin cided with a peak in the proportion of the population in the principal employed age groups. In spite of war losses, in 1931 the proportion of the population aged 15-59 in England and Wales (the figures for Scotland are a little lower) was 15 per cent (8.2 percentage points) higher than it had been in 1871 and 5 per cent (3.2 percentage points) higher than it had been in 1911. Put at its most stark, the 1931 excess of population in the economically active age groups compared with 1911 was over 1.5 million people, at a time when officially recorded unemployment at its worst did not quite reach 3 million. In addition, over the same period, the population of prime working age was steadily aging. Whereas in the mid-nineteenth century there were nearly two adults aged 20-39 for every one aged 40-59, in the twentieth century the ratio changed rapidly; by 1951 the two groups were more or less evenly matched. The dynamism and flexibility intro duced into the labour force by large and growing successive cohorts of young new entrants was steadily disappearing at the very same time that major and much more rapid shifts in employment patterns were coming to be required. These demographic changes also had a major impact in a quite differ ent area: the family and the kinship group. First, the high rates of mortality of the eighteenth and nineteenth centuries, together with the long periods of childbearing of the pre-fertility decline period, meant that very large numbers of children lived through much of their childhood having lost at least one parent through death; they were thus genuinely 'single parent families' (rather than simply 'single parent households'). Precise estimation of the proportion of children affected is difficult because ages of parents at childbearing varied widely (especially in the pre-twentieth-century period). Table 1.5, however, provides some insight into this problem. It traces the exper ience of cohorts of what we may consider as 'typical' children. These children are all assumed to have been born when their mothers were aged 30 (26 for the 1946 group) and to have had fathers who were older than their mothers by the average number of years for their cohort. The table shows the proportion of such children who could have expected to lose parents by ages 10, 15 and 25, and also the median age of losing these parents, on the assumption that the death of the father was independent of the death of the mother. These figures are somewhat lower than those for all children (particularly for age at losing fathers), since the distributions of parents' ages at marriage
Cambridge Histories Online © Cambridge University Press, 2008
Table 1.5 Estimated percentage of 'typical' children losing parents by certain ages, by children's birth cohort, 1741-1946 Percentage losing parent(s) By age 15
By age 10
Median age at losing
By age 25
Cohort born
Father
Mother
Both
Father
Mother
Both
Father
Mother
Both
Father
Mother
1741 1771 1801 1831 1861 1891 1921 1946
14 12 12 11 11 9 5 2
14 12 12 11 11 8 4 1
2 2 2 1 1 1 0 0
20 20 19 17 17 14 8 3
20 19 19 17 17 12 6 3
4 4 3 3 3 2 0 0
36 35 34 32 33 26 16 10
34 33 32 30 29 22 12 7
12 12 11 10 10 6 2 1
31 32 33 34 35 37 41 45
33 34 35 36 36 41 47 53
Source: Derived from the life tables (see n. 42) and based on children born when their mothers were 30 (25 for 1946), assuming that parents married at the median age for their cohort and that spouse mortality was independent; for qualifications to the figures see text.
Cambridge Histories Online © Cambridge University Press, 2008
50
M I C H A E L
A N D E R S O N
are upwardly skewed, as is the probability that a parent will die for children of higher birth orders. Laslett, using Coale and Demeny model life tables with a male expectation of life at birth of 35 as a reasonable approximation to early eighteenth-century conditions, esti mates that 46 per cent of girls might have lost their fathers by the age of 25; this compares with around 40 per cent on the present esti mates. Nevertheless, because they provide figures on a consistent basis over time, the data of Table 1.5 remain of considerable interest, particularly in establishing the timing of the main changes. Another perspective on this issue - which also takes some account of separation on the one hand and remarriage on the other - could be gathered if we were able to investigate the percentage, of all house holds containing children, which had only one parent present; precise evidence on this point is, however, scrappy at all periods. For nineteen English community listings from various dates between 1599 and 1811, Laslett has shown that about 16 per cent of unmarried persons listed as 'children' of the head of household were recorded as living with a widowed parent who had not remarried; of these, two-thirds were living with mothers, one third with fathers. In addition, 5 per cent of children were recorded as living with a remarried parent and resid ing therefore in that ambiguous and often problematical status of 'step child'. 107
108
At only two other points in our period do we have any further evidence on this topic. For 1851 we can make use of some preliminary tabulations from the National Sample from the 1851 census of Great Britain. Including cases where relationships were inferred from sur names, marital status and position in the household, about 14 per cent of those children who were living with parent(s) were living with a widowed parent who had not remarried, 2 per cent with an unmarried parent and 4 per cent with a parent whose spouse was absent from the home on census night. Of all children under the age of 15, 77 per cent were explicitly stated as living with two married or cohabiting parents (79 per cent if reasonable inferences about rela tionships are allowed). Depending on the criteria used, between 6 and 7 per cent of such children lived with a widowed parent (widows 107
108
Laslett, Illicit Love, p. 162n. In the 1946 birth cohort of the National Survey of Health and Development, 7.2 per cent of girls had lost one or both parents by age 15, compared with 6 per cent as estimated by the technique used here (K. Kiernan, 'Teenage Marriage and Marital Breakdown: A Longitudinal Study', Population Stu dies, 40 (1986), pp. 35-54). Calculated from Laslett, Illicit Love, Table 4.2.
Cambridge Histories Online © Cambridge University Press, 2008
The social implications of demographic change
51
outnumbering widowers by three to one), about 4 per cent with a temporarily or permanently separated parent, and 1 per cent lived with a never-married parent; up to 2 per cent seem to have lived without any parent but in a group of brothers and sisters. At least 6 per cent of children in this 0-14 age group lived separated from any close relatives at all. This last figure was around 4 per cent even for the 0-9 year age group, nearly 5 per cent of whom lived with a widowed parent. Of all family groups, only around three-quarters had two parents present on census night, and 15 per cent were headed by a widowed parent. Finally, for 1921, the Registrars General calculated that just under 6 per cent of 0-9 year olds had lost fathers and rather over 2 per cent mothers; in all, including cases where the sex of the parent was unknown and where both parents had died (this latter group being less than 0.5 per cent of all children), nearly 9 per cent of 0-9 year olds (and about 11.3 per cent of 0-14 year olds) had lost at least one parent. Today less than 1 per cent of first marriages end in death within ten years and only 3 per cent within twenty years duration. Clearly, then, very many children in the eighteenth and nineteenth centuries experienced the death of at least one parent and suffered the emotional, economic and residential consequences. Only well into the twentieth century did a major amelioration of this problem emerge; the end of our period, by chance, coincides with the period of the historically greatest stability in the growing-up experiences of children. The postwar period also, however, saw other major changes. Figure 1.11 plots some of the more significant of the results of analysing the interrelationships between mortality, nuptiality and fertility as they impacted on the life courses of women. For simplicity of compu tation the calculations relate to women who themselves and whose families experienced all life course transitions at the estimated median age for the cohort. The graph is thus a simplification of the complexities of reality, since the distributions of events around some of these medians were in the past very large. Nevertheless, as a single indicator of 'typical' experience, the plots show the broad parameters of change very adequately. 109
110
109
110
The figures are presented in the Reports of the 1921 Census of England and Wales, and of the 1951 Census of Scotland. R. Haskey, T h e Proportion of Marriages Ending in Divorce', Population Trends, 27(1982).
Cambridge Histories Online © Cambridge University Press, 2008
52
MICHAEL
ANDERSON
Own
death
Death of h u s b a n d
Birth of last grandchild 0
M a r r i a g e of last child