~WI LEY-VCH
Konrad Grab
Split and Splitless Injection for Quantitative Gas Chromatography Concepts, Processes, . Pract...
50 downloads
725 Views
20MB Size
Report
This content was uploaded by our users and we assume good faith they have the permission to share this book. If you own the copyright to this book and it is wrongfully on our website, we offer a simple DMCA procedure to remove your content from our site. Start by pressing the button below!
Report copyright / DMCA form
~WI LEY-VCH
Konrad Grab
Split and Splitless Injection for Quantitative Gas Chromatography Concepts, Processes, . Practical Guidelines, Sources of Error Fourth, completely revised edition
Konrad Grob
Split and Splitless Injection for Quantitative Gas Chromatography
~WILEY-VCH
KonradGrob
Split and Splitless Injection for Quantitative Gas Chromatography
Concepts, Processes, Practical Guidelines, Sources of Error Fourth, completely revised edition
Dr. Konrad Grob Kantonales Labor Fehrenstr. 15 CH-8032 ZUrich Switzerland
This book was carefully produced. Nevertheless, author and publisher do not warrant the information contained therein to be free of errors. Readers are advised to keep in mind that statements, data, illustra tions, procedural details or other items may inadvertently be inaccurate.
4th, completely revised edition 2001 Including CD-ROM The Transparent Injector by Maurus Biedermann l st reprint 2003
Die Deutsche Bibliothek - CIP-Cataloguing-in-Publication-data A catalogue record for this publication is available from Die Deutsche Bibliothek ISBN 3-527-29879-7 © WILEY-VCH Verlag GmbH, 0-69469 Weinheim (Federal Republic of Germany), 2001
Printed on acid-free paper All rights reserved (including those of translation into other languages). No part of this book may be reproduced in any form ~ by photoprinting, microfilm, or any other means - nor transmitted or translated into a machine language without written permission from the publishers. Registered names, trademarks, etc. used in this book, even when not specifically marked as such are not to be considered unprotected by law.
Printed in the Federal Republic of Germany
iju3.08'1& c;,~~3
Preface
v
Preface In the scientific literature and in commercial catalogs, methods are almost invariably described as "easy"; there seem to be no limitations and problems. If original papers reflect the eupho ria of the inventors, this is understandable. That catalogs of instrument manufacturers do not mention weaknesses of a product might be attributed to the rules of business. Even review papers, however, tend to neglect problems, maybe because authors do not want to risk good relationships or have insufficient experimental support for criticism. As a result of this, there is a frightening discrepancy between the rose-colored descriptions and the reality in laboratories. Published work, for instance, reports relative standard devia tions that are far lower than commonly obtained in reality - errors by a factor of two are rather frequent, and probably more frequent than recognized. The frustration of the analyst is under standable. His position in relation to his boss, who might have never gone through the reality of chromatography, is weak, because he seems to be an especially incapable analyst. For new techniques, a few chromatograms are usually provided as a proof that they work. Inventors cannot be blamed for not having tested them with all possible samples and under all conceivable conditions - an impossible task. Techniques routinely used by tens of thou sands of users should, however, be investigated rather comprehensively to enable under standing of the mechanisms involved and systematic discovery of the critical samples and conditions. This means, primarily, investigation of possible imperfections - not out of ma levolence towards the inventor or instrument manufacturer, but to prevent failures during applications involving particularly unfortunate conditions. The user should know about the problems so they can be foreseen or, if they occur nevertheless, to avoid his spending days in search of the source, finally to discover he was looking in the wrong place. Instruments are usually evaluated by means of a few injections of some alkanes in a simple solvent. Such quick tests resemble Russian roulette: whether an instrument is shot or escapes alive is primarily a matter of luck. Real evaluation is far more demanding. Even today instru ments differ significantly in their essential parts, which is why the critical details of injector design are a subject of this book. The book also concentrates on weaknesses of the techniques because it is assumed that prob lems are the reason why the analyst takes a look at it. Overemphasis of problems bears a danger, however, that a reader starts wondering why reasonable results were ever obtained or why capillary GC has not been abandoned altogether. He must be reminded that most problems are important only for certain types of sample and conditions. There is no doubt that capillary GC in general and injection in particular are demanding tech niques. They are full of pitfalls, but also rich in possibilities for a creative analyst - and cer tainly never boring. The better an analyst masters it and the more he knows, the more he is likely to be fascinated and the better he realizes how much more could be made of it. Hopefully many will pick up problems and incomplete concepts, work on the subject, and contribute to the further development of capillary GC. Around 200,000 people use capillary
VI
Preface
GC and could, therefore, profit from such contributions. It is my impression that GC injection techniques are still far from being optimized to the point which could be reached. Thousands of analysts go through the same trouble and lose weeks of work because known problems have not been solved. Apart from the frustration, this results in unnecessary costs. The basic problem seems to be that nobody is willing to carry the burden of perfecting these tech niques. We are all paid for specific work (my job is in governmental food control), rather than to help others. Because offering an improved split/splitless injector does not seem to be a way of improving sales of instruments, instrument manufacturers hesitate to invest in this direc tion. This book was started as a revision of "Split and Splitless Injection in Capillary GC", pub lished by Hirthlq (Heidelberg) in 1993, which in turn was an update of "Classical Split and Splitless Injection" from 1986. The new material, primarily on sample evaporation, necessi tated, however, a new structure and finally a large part of the book was rewritten. The CD ROM, produced by Maurus Biedermann, was added because the videos on the processes occurring in devices imitating injectors cannot be replaced by a description. Programmed temperature vaporizing (PTV) injection, on the other hand, has grown into a field requiring more space than is available in this book. I wish to thank Ian Davies, Cambridge, UK, for converting Swinglish (Swiss English) into a more proper language, and Jonas Grob, one of my sons, for turning more than one million letters and many figures into attractive pages. Fehraltorf, October 2000
Koni Grob
Survey of Injection Techniques
VII
Survey of Injection Techniques Is splitless injection a procedure during which you never touch the split outlet valve? If there is a danger of such confusion, please have a look at the following list of short definitions. Injection into GC capillary columns can be confusing, because there are so many different techniques. And if you ask why this is so, the answer is that each of these techniques is better than all others in some respects and has features some analysts do not want to do without. The following table provides a survey of the main injection techniques. It does not mention numerous others which have never become popular or have lost their importance, such as injection through a loop, capsule injection, and moving needle or other solid injection tech niques.
Injection into Capillary Columns Classical vaporizing injection Split/
I
\irect Splitless
Programmed temperature vaporizing (PTV) injection Split / / \ " Direct Splitless Solvent-split
On-column injection
I ""- Precolumn Classical /' (small volume) solvent splittin~ Retention gap technique
Short definitions might be as follows:
Classical vaporizing injection. Sample evaporation in a permanently hot vaporizing chamber
before transfer into the column.
Split injection. Only a small part of the vapor enters the column, the rest being vented. The
technique of choice for rather concentrated samples, as well as for gas and headspace analy
sis.
Splitless injection. Nearly all of the sample vapor is transferred from the injector into the
column; the technique is performed with a split injector. Trace analysis of contaminated sam
ples.
Direct injection. All the vapor is transferred into the column; performed with an injector
without a split outlet. Trace analysis, usually involving instruments converted from packed
column GC.
Programmed temperature vaporizing (PTV) injection. Injection into a cool chamber which
is subsequently heated to vaporize the sample. Newer technique to replace classical vaporiz
ing injection.
Solvent splitting. Most of the solvent vapor is vented; the solute material is transferred into
the column in splitless mode. Usually used for large volume injection in trace analysis.
:VIII
Survey of Injection Techniques
Ion-column injection. Injection of the sample liquid into the column inlet or an oven-thor Imostatted capillary precolumn. Technique providing the best results, but not suitable for highly contaminated samples. Retention gap technique. Use of an uncoated precolumn to overcome band broadening resulting from sample liquid flooding the column inlet. Most important for large volume on column injection and on-line coupled LC-GC. Precolumn solvent splitting. Injection into a precolumn connected to a vapor exit through which most of the solvent vapor is released. Used for large volume injection or on-line trans fer.
Contents
IX
Contents A Syringe Injection into Hot Vaporizing Chambers 1. Introduction ....•.••••...••.••.•.•.....•..•.••......•...•••.•.••.•...•...••••.••••.•...••.•.••.....••.•.....•.•••. 1
1. 1. Syringe Injection .•........•..........•.•... 1
1.2. Sample Evaporation inside the Needle 2
1.2.1. Inaccurate Sample Volume 2
1.2.2. Discrimination against High Boilers 3
1.2.3. Poor Reproducibility 4
1.2.4. Degradation of Labile Solutes 4
1.3. Conclusions ,.................................•...................................... 4
1.3.1. Fast Autosampler? 4
1.3.2. Suppressing Evaporation inside the Needle 5
1.3.3. Thermospray 5
2. Syringes •.•.•••........••..........••.•••............•......•••.•.•....•.•.•••.•.......•.•.•..•••..•.••.......•••••• 6
"T
2.1. P/unger-in-Barrel Syringes ....................................................................•.... 6
2.1.1. Plungers 6
2.1.2. Plunger Guides 7
2.2. P/unger-in-Needle Syringes .................•...........•....•.............•.......•.............. 9
2.3. Syringe Needles .......................•.•.........................•..................................... 9
2.3.1. Dimensions 9
2.3.2. Needle Tips 10
2.3.3. Fixed versus Removable Needles 11
2.4. Cleaning of Syringes .......•............•.........................................•................. 11
2.4.1. Basic Rules 11
2.4.2. Cleaning Procedures 12
2.4.3: Plugged Needles 14
2.4.4. Blocked Plungers 14
I
3. Evaporation Inside the Needle •.••••...•..•••.•.....................••••..........••...•....•.••••.... 15
3. 1. The Three-Step Model ...................................•......................................... 15
3.2. Models of Evaporation inside the Needle 17
3.2.1. Distillation from the Needle 17
3.2.2. Gas Chromatography in the Needle 17
3.2.3. Ejection from the Needle 18
3.3. Conclusions Regarding Optimized Injection ...............•........................... 19
4. How Much is Really Injected? .......••....•......••••.•.••..•••.••.••....•.•.•..•••..•.•.•.••.•...•.•. 20
4.1. Interpretations of "Sample Volume" ..........................•........................... 20
4.2. Communicating "Sample Volumes" 21
4.3. Effects on Quantitative Analy"is 21
X
Contents
5. Syringe Needle Handling Minimizing Discrimination
22
5.1. Definitions of Techniques 22
5.2. Experimental Determination of Losses in the Needle •............................ 24
5.2.1. Method with Two Instruments 24
25
5.2.2. Experiment with a Single Instrument 5.2.3. Test During Routine Analysis 26
5.3. Comparison of Needle Handling Techniques 26
5.3.1. Filled Needle Injection 27
28
5.3.2. Slow Injection 5.3.3. Cool Needle Injection 28
29
5.3.4. Hot Needle Injection 5.3.5. Solvent Flush Injection 32
37
5.3.6. Air Plug Injection 5.3.7. Sandwich Injection 37
5.4. Heating the Needle after Injection? ...•.....•..•............•.............................. 37
5.5. Effect of Injecting Air..........•..............•..••.............................................•.. 38
5.5.1. Concerns Regarding the Column 39
5.5.2. Detectors 39
5.5.3. Oxidized Sample 39
6. Dependence of Discrimination on Sample Volume
41
6. 1. Experimental Results ............................................................•.................. 41
6.2. Discussion of Mechanism ..................................•.........................•........... 42.
6.3. Conclusions .................................................................................•.•......... 43
7. Solvent and Solutes ......•...••...•...•••.•......••••...•..•........••...............•.•.••...•..•.•......• 43
7. 1. 7.2. 7.3. 7.4.
Volatility of the Solvent ...............................•.......................................... 44
Type of Solute ...........................•................•.................................•.......... 44
Adsorption in the Syringe Needle 45
"Memory Effects" Arising from the Syringe 46
8. Injector Temperature ...•.••.•.......................................•..........•.....••••••••...•••.•...... 47
8. 1. Imposed Temperature ................................................................•............. 47
8.2. Temperature Gradient Towards the Septum ............................•..............• 48
8.2.1. Critical Rear of Needle 49
. 8.2.2. Actual Temperature Profiles 50
8.2.3. Effect on Discrimination 51
53
8.2.4. Quantitative Results Differing from One Injector to Another 8.2.5. Conclusions 54
8.3. Thermostability of Septa ............................................•.•..........•................ 55
8.3.1. Upper Temperature Limit 55
56
8.3.2. Some lips 9. Plunger-in-Needle Syringes .......•............••••...•.•..•.....••.•.•......•....••.••.•.•...•..•...•.• 57
9. 1. Accuracy of Sample Volume .........•..........................•...•,..•...•.................. 57
9.2. Premature Expulsion ....•...........................................•....•.•........•.............. 57
10. Possibilities of Avoiding Evaporation in the Needle ••.•..•••.•...••.•••.......•......... 59
10. 1. High Boiling Sample Matrix .. ....•.•....•...•.•.........•.....•........•.•........•.........., 59
10.1.1. Injector Temperature versus Solvent Boiling Point 59
10.1.2. Practical Aspects : 61
r Contents 10.2. 10.3. 10.4. 10.5.
XI
Cooled Septum ... ..•.•.....•.•.••.....•...•.•.•.....•.•.•.•............•.....•.•...•.•...•.......... 62
Cooled Needle Technique .......•.•.•.......•.•........•.••...•........•....................•.. 62
Fast Injection by Autosampler ...........•.•.......••..•..............................•..... 62
Evaporation in the Injector .•....•.......•.•.•.•.......................:•.•.•.•....•.•..•••.... 63
11. Summarizing Guidelines •...•.•••••.......•••.•..••••••••.••••••••••••••••...•.•.•.•...••.•.•.....••••. 64
References A •.••.......•...........•••..•••••••••........••••••.•••••••••••••••••••••••....•.•.••...•.•••.••....•••• 66
B Sample Evaporation in the Injector 1. Introduction •..••••.•.........•...•..•.••.....•••••...•...•.••.•••........•.............•.......•.......••••...• 69
1. 1. Problems Caused by Incomplete Evaporation 2. Solvent Evaporation - Heat Transfer
70
71
2.1. Available Evaporation Time ••••...••••••.•.•.••••••••••••••••••••••••••••••••.•.•••.••.•.••••••• 71
72
2.1.1. Band of Liquid 2.1.2. Nebulized Sample : 72
2.1.3. Deposition on Surfaces 73
2.2. Amount of Heat Required ....................................................•........•...•.•.... 73
2.3. Sources of Heat ..............................................•.....................•.•....•.•.•.....•. 73
2.3.1. Carrier Gas 74
2.3.2. Packed Injector Liners 74
75
2.3.3. Heat from Liner Wall 2.4. Time Required for Heat Transfer 75
2.4.1. Transfer Within the Liner Wall 75
76
2.4.2. Transfer Through the Gas Phase 2.4.3. Residence Time Required for Evaporation 77
2.5. Conclusions ............•....••.•.•..•.•......•....•.••.....•.•.....•..•.....•...•......•..........•..... 78
2.6. Experimental Results ...•••..•.............................•...............•...............•.•...•.. 79
2.6.1. Calculated and Measured Temperature Drop 79
80
2.6.2. Measurement of Evaporation Time via Split Flow Rate 3. Solvent Evaporation - Visual Observation
81
3. 1. Experimental ..•.•.......•....•.......•...•.........................................•.•................. 81
3.2. Liquid Exiting the Syringe Needle 83
3.2.1. Injection through a Cool Needle 83
84
3.2.2. Injection through a Hot Needle 3.3. Three Scenarios of Evaporation in an Empty Vaporizing Chamber 87
3.3.1. Scenario 1- Nebulization 87
88
3.3.2. Scenario 2 - Band of Liquid 90
3.3.3. Scenario 3 - Liquid Splashing on the Liner Wall 3.4. First Conclusions ......••.•............•.........•.....................•.....•................•.•...•. 92
3.4.1. Fate of Sample Liquid "Shot" to the Bottom of the Liner 93
3.5. Stopping the Sample Liquid .•.•..•......•....•.•..•....•.••.•....•.....•.•..•.•....•........... 96
3.5.1. Liner with Baffles 96
96
3.5.2. Cup or "Jennings" Liner 3.5.3. Glass Bead Liner 98
3.5.4. Cycloliner 98
: 99
3.5.5. Laminar Liner
XII
Contents
3.5.6. Metal Liner 3.5.7. Summary - Stopping Liquid with Obstacles 3.5.8. Wool 3.5.9. Glass Frits 3.5.10. Carbofrit 3.5.11. Column Packing Material 3.6. Other Criteria for Evaluating Obstacles ............................•.•.•...........•... 3.1. Duration of Solvent Evaporation
99 100 101 102 103 103 103
105
4. Solute Evaporation .•.•....••......••.•...••.......••..••.•.....•.••..••.••....••.•....•...••••............ 106
4. ,. Evaporation in the Gas Phase
101
4.1.1. Some Key Terms 107 109 4.1.2. Dilution with Carrier Gas in an Empty Liner 4.1.3. Solute Concentrations in the Injector 110 4.1.4. Glass Wool Improving Evaporation? 112 112 4.1.5. Evaporation from Contaminants 4.1.6. Prevention of Column Contamination 114 4.2. Evaporation from Surfaces ........•...•...........................................•.•......... 116
4.2.1. The Iodine Experiment 117 118 4.2.2. Dilution in Carrier Gas 119 4.2.3. GC Retentive Power of a Surface 4.2.4. Experimental Data 120 4.3. Conclusions on Injector Temperature 121 4.3.1. Thermospray Injection 121 . 4.3.2. Deposition on a Surface 121
5. Sample Degradation in the Injector
122
5.1. Degradation in the Injector or in the Column? 5.1.1. Methods for Distinction 5.2. Mechanisms of Solute Degradation ..•................................................... 5.3. Countermeasures against Solute Degradation 5.4. Examples ........................................•...................................................... 5.4.1. Divinylcyclobutane 5.4.2. Carbamate Insecticides 5.4.3. Oxygenated Dibenzothiophenes 5.4.4. Mustard Oils 5.4.5. Chlorohydrin in a Drug Substance 5.4.6. Drugs Requiring an Empty Liner 5.4.7. Empty Liner for Methyl Esters of Hydroxy Fatty Acids : 5.4.8. Brominated Alkanes 6. Retention and Adsorption in the Vaporizing Chamber
122 123
124
125 126
126 126 127 127 127 127 128 128
129
6. 1. Adsorption in the Injector •.....................•....................•...............•......'" 129
6.1.1. Split Injection 6.1.2. Splitless Injection 6.1.3. Column or Injector? 6.1.4. Experimentally Observed Adsorption 6.1.5. Variability of Adsorption 6.2. Retention in the Injector
129 129 129 131 131
'"
.•......
.•....
132
Contents
7. Deactivation of Liners and Packing Materials
7.1. 7.2. 7.3. 7.4.
Deactivation of the Liners? Deactivation of Commercial Wool Application-Related Testing for Inertne••............................................. More Comprehen.ive Te.ting Procedure
7.4.1. Design of the Test 7.4.2. Goals of the Test 7.4.3. Results
7.5. Silylation of Liners 7.5.1. Background 7.5.2. Wettability? 7.5.3. Method Recommended for Silylation of Liners 7.6. Silylation of G/a•• and Quartz Wool
7.7. Packing. Coated with Stationary Pha.e 7.8. Deactivation by Sample Material 7.8.1. 7.8.2. 7.8.3. 7.8.4.
Unstable Deactivation Heating Injector Overnight and at Weekends? Carrier Gas Overnight? Tests with Sample
8. Cleaning of Injector Liners
8. 1. Wa.hing with Strong Acid. or Ba.es 8.2. Burning the Contaminant.8.3. Gentle Cleaning
References B
XIII
133
133
133
134
134
135
135
136
138
138
139
139
140
140
141
141
142
142
142
143
143
144 144
145
C Split Injection 1. Introduction 1.1. Principle. of Split Injection 1.1.1. Basic Injector Design 1.2. Purpo.e. of Sample Splitting 1.2.1. Injection of Concentrated Samples 1.2.2. Splitting to Generate Sharp Initial Bands 1.3. The Two Principle. of Ga. Supply 1.4. Hi.toric Background of Split Injection
2. The Split Ratio
2. 1. Definition 2.2. Adju.tment!Determination of the Split Ratio
149
149
149
150
150
151
151
152
155
155
2.2.1. Determination ofthe Column Flow Rate 2.2.2. Adjustment ofthe Split Flow Rate
156
157
161
3. Sample Concentrations Suitable for Split Injection
163
3. 1. Split Ratio. Commonly Applied 163
3.2. Range of Suitable Concentration•......................................................... 163
4. Initial Band Widths 4.1. Band Width. in Space and Time
164
164
XIV
Contents
4.2. Factors Dete,mining Initial Band Widths 4.3. Expe,imental Observation of Initial Band Shapes ...•..............•.....•...•.•.. 4.3.1. Description of the Experiment 4.3.2. Subjects to Study 4.3.3. Some Results 4.4. Effect on the Final Peak Width....... ..••.............•.......•....•......•.•.....•.... 4.4.1. Isothermal Runs 4.4.2. Chromatography Involving Temperature Increase
164
165
166
166
168
169
169
171
5. Split Injection for Fast Analysis .•.••••.•.•.•••••.••••.............•.•..•••.••..••.....•.•••••...•.• 171
5. 1. 5.2. 5.3. 5.4.
P,e,equisites fo, Fast Analysis Maximum Tole,able Initial Band Widths Limits to the Sha,pness of Initial Bands Examples of Fast Analyses ................•.....•.......•........................•............
172
173
173
174
6. Analysis Requiring Maximum Sensitivity .•.•.•.......•...•••..••.•••••••••...•.•.•..•.•.•.••.• 176
6. 1. Sha,p Bands at Low Split Ratios .•..••............ .....•......... 176
6.1.1. Headspace Analysis 176
177
6.1.2. Rapid Isothermal Runs at Elevated Column Temperature 6.2. Optimized Split Flow Rate ..................•...........•........................•............. 177
6.2.1. Peaks Growing Broad instead of High 178
178
6.2.2. Dilution in the Injector 178
6.2.3. Dilution in the Column 6.3. Maximum Vapo, Concent,ation in the Injecto, •.......•..•...........•............. 179
6.3.1. Sample Volume 179
181
6.3.2. Optimum Liner Volume 6.3.3. Position of the Column Entrance 182
6.3.4. Injection Point 182
183
6.3.5. Syringe Needles 6.4. Column Flow Rate .............................................................•................... 183
6.4.1. Low Split Ratios Resulting from High Column Flow Rates 184
6.4.2. Selection of the Carrier Gas 184
184
6.4.3. Selection of the Column 6.5. Summary: Maximum Sensitivity f,om Split Injection 185
7. High Split Ratios for Reducing the Sample Size 7.1. 7.2. 7.3. 7.4. 7.5. 7.6. 7.7.
185
Diluent as a Hypothetical Sample 186
The Maximum Split Flow Rate 186
Small Sample Volumes .•..... .•............ 187
Low Column Flow Rate. .•..... ...•........... 189
High Column Capacity - Thick Films ....................................•................ 189
Length of the Sy,inge Needle 190
Summa,izing Guidelines ........................................................•....•.......... 191
8. Problems Concerning the Split Ratio .....•.•..•..•.....••.•••..................••••............. 192
8. 1. Pu,poseful Sea,ch fo, E"o,s •.. .••.•..... .••.... 8.1.1. Systematic Errors 8.1.2. Message from Standard Deviations 8.2. "P,e-Set" ve,sus "T,ue" Split Ratio ....................................•..........•...... 8.3. Mechanisms Causing the Split Ratio to Deviate 8.3.1. The Pressure Wave : 8.3.2. Dependence of the Pressure Wave on Gas Regulation
192
192
193
194
195
195
196
Contents
XV
8.3.3. Recondensation in the Column Inlet 198
8.3.4. Incomplete Evaporation 200
8.3.5. Cool Split Line 200
8.3.6. Charcoal Filters 201
8.3.7. Buffer Volumes 201
8.4. Minimizing the Deviation from the Pre-Set Split Ratio •...••.•.•.•..•.......... 202
8.4.1. Wide Injector Liner 202
8.4.2. Long Distance between Needle Exit and Column Entrance 202
8.4.3. Small Sample Volumes 203
8.4.4. Volatile Solvents 204
8.4.5. Packed Liner 204
8.5. Experimental Results .......•..............•.•.....••........•...•.•....•....•.................... 205
8.5.1. Results Concerning Pressure Wave 205
8.5.2. Course of the Pressure Wave 207
8.5.3. Data on True Split Ratios 208
8.6. Working Rules to Prevent Systematic Errors 209
8.6.1. No Quantitation on the Basis of the Pre-Set Split Ratio 209
8.6.2. Use of the Internal Standard Method 209
8.6.3. Apply the External Standard Method with Caution 210
9. Problems Concerning Linearity of Splitting
213
9. 1. uLinear" Splitting •........•.....................................................•.•..•...•......... 213
9.2. First Cause of Non-Linear Splitting: Diffusion Speeds 214
9.2.1. Isokinetic Splitting 215
9.2.2. Insufficient Experimental Evidence 216
9.2.3. Conclusion 217
9.3. Second Cause: Incomplete Sample Evaporation 217
9.3.1. Vapors and Droplets Split at Different Ratios 217
9.3.2. Neat Samples 217
9.3.3. Dilute Solutions in Solvents 219
9.3.4. Conclusion 220
9.4. Third Cause: Fluctuating Split Ratio •......•....•.•.............•........................ 220
9.4.1. Variation of the Split Ratio 220
9.4.2. Pre-Separation of the Sample in the Injector 221
9.4.3. Cognac as an Example 222
9.5. Danger of Systematic Errors .•.................................•....•.•....•.•............... 223
10. Techniques for Improving Quantitative Analysis
225
10. 1. Systematic Search for the Sest Conditions 225
10.1.1. Strategy: Minimized Deviation 225
10.1.2. Determination of the Correct Result 226
10.2. Flash Evaporation .........•.........••.•...............................•......•.................. 226
10.2.1. Concept 226
10.2.2. Selection of Conditions 227
10.2.3. Problems Arising from Aerosol Formation 229
10.2.4 Stop Flow Split Injection 230
10.2.5. An Experimental Result: Determination of Sucrose 230
10.2.6. Evaluation of Flash Evaporation 231
10.3. Evaporation in Packed Liners 231
10.3.1. Deposition of the Sample 232
10.3.2. Injector Packings , 233
10.3.3. Optimization of Conditions 234
XVI
Contents 10.3.4. Elution from the Packed Bed 234
10.3.5. PAHs as an Example 235
237
10.3.6. "Ghost" Peaks as a Result of Packing Bleed 10.3.7. Matrix Effects 237
10.4. High-Boiling Samples ••.•.•..........•.•..•.•.....•..•....•.......•............................ 239
10.4.1. Optimization of Conditions 239
10.4.2. Experiments by Schomburg 242
242
10.4.3. Application to Herbicide Analysis 10.5. Homogenization of Vapor Across the Liner 243
10.5.1. Obstacles Promoting Homogeneous Distribution 244
10.5.2. Chromatographic Experiment with Two Columns 244
245
10.5.3. Fatty Acid Methyl Esters 10.6. Two Case Studies •..........•....................................•......•........•............... 246
10.6.1. About a Dispute: the Methanol/2-Ethyl-1-Hexanol Mixture 246
248
10.6.2. Analysis of Alcoholic Beverages
11. General Evaluation of Split Injection
251
References C
254
o Splitless Injection 1. Introduction 1.1. Concept 1.2. Historical Background
2. How to Perform Splitless Injection 2.1. Basic Steps of Splitless Injection 2.2. Closing the Split Exit 2.2.1. Mechanical Pressure Regulation 2.2.2. Flow/Back Pressure Regulation 2.3. Purging the Injector 2.3.1. Duration of the Splitless Period 2.3.2. Purge Flow Rate Required 2.4. Septum Purge 2.5. "Ghost" Peaks from Septum Material 2.6. Septum Purge During the Splitless Period 2.6.1. Arguments in Favor of Closing 2.6.2. Sample Material Entering the Carrier Gas Supply Line 2.6.3. Reasons to Leave the Septum Purge Open 3. Sample Volumes Suitable for Splitless Injection 3.1. Calculated Volumes of Solvent Vapor 3.2. Determination of Injector Capacity 3.2.1. Determination from Peak Sizes 3.2.2. Detection of Solvent in the Septum Purge 3.2.3. Measurement of Losses through the Septum Purge 3.3. Results 3.3.1. Pressure Wave versus Diffusion 3.3.2. Volume of the Vaporizing Chamber
257
257
257
261
261
261
262
263
263
264
265
265
265
266
266
267
268
269
269
270
270
270
272
272
273
273
Contents 3.3.3. Length of the Syringe Needle 3.3.4. Inlet Pressure 3.3.5. Solvent Recondensation 3.3.6. Volume of Vapor from Solvent 3.3.7. Liners with a Constriction at the Top? 3.3.8. Valve to prevent Backflow 3.4. Pressure Increase during Splitless Injection 3.4.1. Auto-Regulation? 3.5. Slow Injection 7 3.6. Conclusions 4. Injection of Large Volumes 4. 1. Overflow Technique 4.1.1. Evaporation from Cool Surfaces 4.1.2. Injection Rate 4.1.3. Keeping the Liquid in Place 4.1.4. Retention of Volatile Components 4.1.5. Desorption of Solute Material 4.1.6. Instrumental Requirements 4.1.7. Syringe Needles 4.1.8. Flow Rate through the Septum Purge 4.1.9. Column Temperature During Injection 4.1.10. Examples 4.2. Precolumn Solvent Splitting 4.3. Evaluation 4.3.1. Overflow Technique 4.3.2. Solvent Splitting 5. Sample Transfer into the Column 5. 1. Spreading in the Vaporizing Chamber 5.1.1. Observations with the Iodine Experiment 5.2. The Transfer Process 5.3. Flow Rate and Duration of the Splitless Period 5.3.1. Carrier Gas Flow Rates 5.3.2. Liner Bore 5.3.3. Diffusion Speeds 5.4. Accelerated Transfer by Pressure Increase 5.4.1. Principles 5.4.2. Advantages 5.4.3. Extent of Pressure Increase 5.4.4. Duration of the Pressure Pulse 5.4.5. Accentuated Solvent Recondensation 5.4.6. Recommendations 5.5. Accelerated Transfer by Solvent Recondensation 5.5.1. Efficiency of the Recondensation Effect 5.5.2. Experimental Results 5.6. Tests on Completeness of Sample Transfer 5.6.1. Rapid Check via Accentuated Transfer Conditions 5.6.2. Check via On-Column Injection 5.7. Fast GC/Narrow Bore Columns 5.8. Splitless Injection for SPME .. ,
XVII
274
275
275
275
277
278
279
279
280
281
282
282
282
284
284
285
286
287
287
287
288
288
289
291
291
291
292
292
292
293
294
295
296
297
298
298
299
300
302
303
304
304
305
305
306
307
307
308
310
XVIII
Contents
5.9. Conclusions 5.9.1. Diameter of the Vaporizing Chamber 5.9.2. Duration of the Splitless Period
6. Problems with Quantitative Analysis 6.1. List of Problems Discussed in Other Parts 6.1.1. Selective Evaporation from the Syringe Needle 6.1.2. Poor Sample Evaporation 6.1.3. Injector Overloading 6.1.4. Incomplete Transfer of Sample Vapor 6.1.5. Adsorption and Retention in the Vaporizing Chamber 6.1.6. Degradation of Labile Solutes 6.2. Enhancing Matrix Effects 6.2.1. Definition 6.2.2. Descri ption of the Effect 6.2.3. Effect on Quantitative Analysis 6.2.4. Proposed Solutions 6.3. Reducing Matrix Effects 6.3.1. Contaminants Simulated with DC-200 6.3.2. Triglycerides in the Sample Matrix 6.3.3. Interpretation of the Experimental Results 6.3.4. Effects on Quantitative Analysis 6.3.5. Minimizing the Matrix Effect 6.3.6. Glass Wool in the Liner?
7. Reconcentration of Initial Bands 7.1. Distinction between the Two Band Broadening Effects 7.1.1 in Space 7.1.2 in lime 7.2. Band Broadening in Time 7.2.1. Shape of the Band 7.3. Reconcentration by Cold Trapping 7.3.1. Principle 7.3.2. Reconcentrating Power 7.3.3. Reconcentration Required 7.3.4. Practice of Cold Trapping 7.3.5. Problems with Disturbed Baselines 7.3.6. "Ghost" Peaks 7.3.7. Application of Cold Trapping 7.4. Reconcentration by Solvent Effects 7.4.1. Recondensation of Solvent 7.4.2. Requirements for Solvent Effects 7.4.3. Effects on Retention limes 7.5. Band Broadening in Space 7.5.1. Shape of the Initial Band 7.5.2. Extent of Peak Distortion 7.5.3. Avoidance of Peak Distortion 7.6. Uncoated Precolumns - Retention Gap Techniques 7.6.1. Reconcentration of Bands Broadened in Space 7.6.2. Uncoated Precolumn as Waste Bin 7.6.3. Press-Fit Connections
311
312
312
313
313
313
314
314
314
316
316
316
316
317
318
320
323
323
325
327
328
330
332
334
334
334
335
337
337
339
339
340
340
341
344
346
350
350
351
354
356
357
357
361
365
365
366
368
372
Contents
7.7. Examples of the Use of Reconcentration Effects 7.7.1. Dioctyl Phthalate 7.7.2. Traces of Tetrachloroethylene 7.7.3. Extraction of Water with Pentane 7.7.4. Semivolatiles in Cigarette Smoke 7.7.5. Solvent Residues in Pharmaceutical Preparations 7.7.6. Headspace Analysis 7.7.7. Solvent Effects at Elevated Column Temperatures 8. Related Injection Methods
8. 1. Direct Injection 8.1.1. Injector Design 8.1.2. On-Column Injection? 8.1.3. Injection of Large Volumes 8.1.4. Evaluation of Direct Injection 8.2. Solid Injection 8.2.1. Moving Needle Injection 8.2.2. Direct Sample Introduction 8.3. Injector-Internal Headspace Analysis
9. General Evaluation of Splitless Injection
XIX
374
375
375
375
376
377
377
378
379
379
379
381
382
383
385
385
386
388
391
9.1. Data on Precision from the Literature ..........•..•.••......•........•.................. 391
9.1.1. Limited Utility of Literature Data 394
9.1.2. Message to a Lawyer 394
9.2. Comparison with Alternative Techniques 395
9.2.1. On-Column Injection 395
9.2.2. Splitless Injection for Analysis of "Dirty" Samples 396
9.2.3. PTV Splitless Injection 397
9.2.4. Outlook 397
References D
398
E Injector Design 1. Vaporizing Chamber
1. 1. Classical Teaching 1.1.1. Longitudinal Axis 1.1.2. Internal Diameter for Splitless Injection 1.1.3. Internal Diameter for Split Injection 1.1.4. Conclusions 1.1.5. Column Installation 1.2. Newer Developments 1.2.1. Pressure and Flow Programming 1.2.2. Fast Autosampler .., 1.3. Room for Improvement7 1.3.1. Preference for Thermospray or Band Formation? 1.3.2. Optimized Thermospray 1.3.3. Optimized Injection with Band Formation
406
406
407
.408
.409
410
410
412
412
412
413
414
414
414
XX
Contents
2. Surroundings of the Vaporizing Chamber
416
2.1. Seal between Liner and Injector Body? ..•.•..............•............................. 416
2.2. Accessible Volumes around the Vaporizing Chamber .•••.•••.••.•••....••.....• 420
2.2.1. Reversed Split Flow? 422
2.3. Septum ...................•......•.....•..•.................•.•...•.....................•................ 423
2.3.1. Required lightness 423
424
2.3.2. Septum Bleed 425
2.3.3. Effect of Particles on Sample Evaporation 2.3.4. Recommendations 426
427
2.3.5. Merlin Microseal 2.4. Heating of the Injector ................•.•....................................................... 427
2.4.1. Injector Head 428
429
2.4.2. Base of the Injector 3. Autosamplers .....•....•••••.....•......••............•.......•.....•...•....•......•...•....••..•........... 429
3.1. Injection Speed.......•••..•••..••..•....•••.•....•...••.•.•..••...••••.....•...••••....••..•••...••• 429
3.1.1. Injection Rate 430
430
3.1.2. Adjustable Depth of the Needle 4. The Gas Regulation Systems ........................•...•......•.....•........•......•.....•..•.•.... 431
4.1. Mechanical Pressure Regulation/Flow Restriction 431
4.1.1. Pressure Regulators 432
434
4.1.2. Manometers 4.2. Mechanical Flow/Backpressure Regulation 435
4.2.1. Comparison of the Two Systems 436
4.3. Electronic Regulation Systems•...••.•••.•..•.••••.•..•..................•.••••.•.•......... 437
4.3.1. Flow/Backpressure Regulation 437
4.3.2. Pressure Regulation/Flow Restriction 438
4.4. Charcoal Filters in the Split Outlet 439
4.4.1. Adva ntages 439
4.4.2. Drawbacks 440
4.4.3. Suitable Size 440
4.5. Septum Purge ..•••..•.............•.....•......•..•.•......•••..•••.....••...••.....•....••...•...••. 441
References E .•••...•.•......•......•••..................•..•...•.•.••...•......•.•......•....•.......•....•••...•• 443
Appendix 1 .••..••........•........•...••............••...•.••••..••...•.•••.......•............•.•.••.•....•.•.•..• 445
Selection of the Injection Technique .........•.......................•........................... 445
Appendix 2 ..••....•...............••...••.....•••....•.••.....•...•..•....••...•.....•••....•..•..•.•..••.......... 446
Selection of Conditions for Classical Split and Splitless Injection ....•.......... 446
Appendix 3 •.....•....•.....................................••....••..•..••....•.......•....•.•.•..••..•.....•..••.. 448
Glossary of the Most Important Terms Used in the Text •••.•••..•••.••••••..•••....••• 448
Subject Index •...•.•.•..•.•...••.•.....•.....•.•.•..•••....••••...••..•.•.......•.....••...•...•..•...••.......•.. 453
1.1. Syringe Injection
1
A Syringe Injection into Hot Vaporizing
Chambers
1. Introduction 1.1. Syringe Injection
There are several reasons for the general success of the syringe for sample introduction in chromatography: the flexibility with which the sample volume can be ad justed; the possibility of releasing the sample in a predetermined region of the vaporizing chamber; withdrawal of the device after depositing the sample; easy cleaning of the sampling device; easy construction of autosamplers - the sample can be picked from the vial closed by a septum using the same device. This does not mean, however, that the syringe only has ad vantages, as will be shown below, but the alternatives en gender just as many problems and inconveniences.
Alternatives
In fact, in the past, some alternatives have been tested, but none has become a serious competitor with the syringe. Systems based on rotating switching valves, similar to those used in HPLC, have been proposed several times (e.g. [1)). They are widely used for gaseous samples, but not for the liquids commonly analyzed. Samples have been placed in small capsules which were opened in the vaporizing chamber. For solid (solvent-free) injection solutions were placed in glass tubes of ca. 15 x 0.7 mm i.d., from where the solvent was evaporated in a manifold that could be evacu ated. These tubes were then dropped into the vaporizing chamber from a rotating block situated above the chamber.
2
A 1. Introduction
Complex Process
At first sight, the concept of syringe injection into the classi
cal vaporizing injector seems to be obvious - the needle re
leases a liquid sample into the hot vaporizing chamber, where
the Iiq uid quickly evaporates such that only vapors reach the
column entrance. On closer inspection, the process is more
complicated.
1 The sample solvent (normally more than 99 % of the sam
ple consists of volatile solvent) evaporates at least par tially inside the needle because the latter enters a zone at a temperature far above the solvent boiling point. Fast autosampler injection is an exception to this. 2 Evaporation inside the needle produces a spray effect that largely determines sample evaporation inside the vaporizing chamber. It is, in fact, the prerequisite for sample evaporation inside empty injector liners.
Neglected Subject?
The problem of syringe injection into vaporizing injectors has long been neglected, although some analysts, mostly working with packed columns, have been aware of it since the sixties. Perhaps the complexity of the problem was the reason, hindering the discovery of simple, generally valid solutions. The discussion of how to inject a liquid sample also has a touch of awkwardness, comparable perhaps with teach ing an adult how to eat Italian spaghetti without smearing the red tomato sauce over his face and tie. Evaporation in side the needle is, however, often the major source of error in quantitative analysis, and it might well turn out that introducing a sample in a volatile matrix into a hot injec tor is even more difficult than eating spaghetti properly in front of a very important person.
1 .2. Sample Evaporation inside the Needle
It is tempting to think of sample introduction into the injec tor as a purely mechanical process executed by depressing the plunger ofthe syringe - an injection as in medicine or liquid chromatography. In cold on-column injection this is indeed the case, but in vaporizing injection it is the excep tion rather than the rule. Partial evaporation in the needle causes two main problems.
1.2. 1. Inaccurate Sample Volume
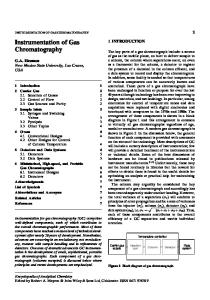
Sample (solvent) evaporation in the syringe needle renders the amount of sample delivered into the injector unreliable (Figure A 1). Syringes are conceived to inject an amount of liquid that corresponds to the volume read on the barrel of the syringe. The liquid inside the needle is not measured by the commonly used plunger-in-barrel syringes (of, e.g., 10 Ill) because it is supposed to remain there at the end of the injection. If a solution in a volatile solvent is introduced into an injec tor at 250 to 300°C, it is difficult to prevent some liquid evapo rating and emptying the needle largely. Because of this, the
amount of sample injected is greater than that meas ured. Because the volume inside the needle is 0.6-1 III and
1.2. Sample Evaporation inside the Needle
3
Syringe
Injector insert
Sample liquid Evaporating solvent + volatile solutes Layer of high boilers
~.~
:.:.:::':
Ejected sample liquid
..~;:
Figure A1 Basic problems caused by syringe injection of samples in volatile matrices into hot injectors. a) Some of the sample material which should remain in the syringe needle at the end of the injection is expelled. in creasing the volume of sample actually introduced above that measured on the barrel. b) Part of the high-boiling solute material remains on the internal wall of the needle and is finally taken out of the injector with the syringe, resulting in a distortion of the sample composition (discrimination).
the sample size commonly injected between 1 and 2 ~L, the needle volume is anything but negligible. Injection of a vol ume below ca. 0.6 ~L is not possible if the needle volume is emptied. 1.2.2. Discrimination against High Boilers
Discrimination resulting from selective elution from the syringe needle is often even more troublesome. When the analyst withdraws the plunger after an injection, he might find little liquid hanging on the tip of the plunger. It is tempt ing to conclude that most of the needle volume has been transferred into the injector and that a nominal injection of, e.g., 1 ~L in reality introduced 1.6-2JlL. While this conclusion may be correct for the solvent and the most volatile solutes, components with an elevated boiling point are likely to be only transferred partially; of these an equivalent of only, e.g., 1JlL was injected - the exact amount cannot be determined visually. Thus, high-boiling sample components enter the vaporizing chamber in amounts which are too low relative to the others, and hence are "discriminated" against compared with the volatile material.
Overdosage of Volatiles
It may be objected that one should speak of "overdosage" of the volatile components rather than "discrimination"
4
A 7. Introduction
against the high boilers because, in fact, too much of the volatile material is analyzed. However, such terminology has not become popular. Samples of Broad Range of Volatility
Discrimination by selective elution from the needle is a severe problem for samples containing components of a wide range of volatility, particularly when some have elevated boiling points; it is mostly negligible when all solutes are volatile, and absent if gases are injected (including headspace analysis). Discrimination is one ofthe main reasons why the volatility of internal standards should be similar to that of the solutes of interest.
1.2.3. Poor Reproduc ibility
Deviations because of partial elution from the syringe nee dle call for compensation by means of calibrated correction factors (often wrongly termed "response factors"). The de viations are, however, usually poorly reproducible both within a series of injections of the same solution (random error) and between injections of different solutions, such as the calibration mixture and the samples. This results in in creased standard deviations and possibly systematic errors.
1.2.4. Degradation of Labile Solutes
Degradation of labile solutes on the hot metallic needle' surface or on the layer of contaminants deposited on the internal wall of the needle may be another problem. GC in struments are constructed such that the sample does not make contact with metal surfaces, but if a component evapo rates from the needle wall, such contact is intense.
1.3. Conclusions
As sample evaporation inside the vaporizing chamber is linked with that inside the needle, Sections A and B are inter related and are directed towards the following conclusions.
1.3. 1. Fast Autosampler?
In the second half of the nineteen eighties, Hewlett-Packard introduced the fast autosampler which avoided sample evaporation inside the needle. For some time this seemed to be the solution of the problem, although it meant that manual injection was no longer equivalent - the autosampler was no longer an automated version of manual injection, but a different technique often producing significantly different results.
Handicapped Evaporation in the Injector
This conclusion was questioned again when it became obvi ous that the fast autosampler not only solved a problem, but also created a new one - it rendered sample evaporation in side the vaporizing chamber more difficult (Qian et al. [2]). Figure A2 anticipates the conclusions of Sections A and B; there is a dilemma - performance regarding syringe intro duction is traded against evaporation performance inside the vaporizing chamber.
1.3. Conclusions
5
Evaporation inside the needle nebulizes the liquid
Sample liquid forming a band that must be stopped
.~i~lR} Microdroplets ;l~~ evaporating in the -~~~ :\~?:. gas phase
Packing
Injection suppressing evaporation inside the needle
Thermospray resulting
from partial evaporation
In the needle
Figure A2
The dilemma regarding sample evaporation: fast autosamp
lers avoid evaporation inside the n_dle, but render vapori
zation inside the liner difficult. Slower injection causes par
tial evaporation inside the n_dle, which improves vaporiza
tion inside the liner by production of a thermospray.
1.3.2. Suppressing Evaporation inside the Needle
With regard to the accuracy of the sample volume injected and the composition of the sample analyzed, the best tech niques for introducing the sample into a hot chamber are those preventing sample evaporation inside the syringe needle. This can be achieved by injection at a velocity such that heating and evaporation of the sample inside the syringe needle is avoided (fast autosampler), injection of samples in high-boiling solvents, or injection through a short needle. Programmed temperature vaporization (PTV) and on-column injection are also solutions to this problem.
Band Formation
Injection suppressing evaporation in the needle causes the sample liquid to leave the needle as a band (jet). As this band moves at high velocity and covers long distances in hot cham bers, it must be stopped by a packing (such as deactivated glass wool) or by obstacles (Section B). This may lead to losses of high-boiling, adsorptive, or labile solute material.
1.3.3. Thermospray
The most gentle sample evaporation inside the vapor izing cha.mber is obtained when some solvent evaporation inside the needle nebulizes the sample liquid at the needle
6
A 1. Introduction exjt. The resulting microdroplets readily evaporate while suspended in the carrier gas. This avoids contact with adsorptive or contaminated surfaces. Because vaporization inside the needle often causes uncon trolled elution, the technique must be optimized such that transfer from the needle is as complete as possible. Sample volumes will be too large, however, and discrimina tion against high boilers cannot be totally avoided.
2. Syringes Here syringes suitable for vaporizing injection are described. Catalogs of syringe suppliers provide useful further infor mation. A summary of the subject has been published by Hinshaw [31.
2.1. Plunger-in-Barrel Syringes
Figure A3 shows the front of the most commonly used microsyringe with a fixed needle. The needle is sealed into the glass barrel by means of a droplet of epoxy glue. The· sample volume to be injected is measured in the barrel of the syringe and does not include the liquid inside the needle. Measurement assumes that the needle remains filled with liquid. Seal with glue
Plunger
I \~.----.~~------+{
Needle
I
I
/
Sample volume
Glass barrel
Figure A3 The most commonly used syringe with fixed needle end steel plunger.
2.1.1. Plungers
Steel plungers seal against the glass barrel by closely fitting dimensions: clearance between the plunger and the barrel is approximately 0.5 urn. Because the glass barrels and steel wires cannot be fabricated with the appropriate precision, plungers are adjusted individually by immersion in acid. This explains why plungers should not be exchanged from one syringe to another (if they seem to fit, they might not be tight).
PTFE Tips
Plungers with a PTFE tip have been less successful. They enable the production of syringes with exchangeable plung ers at lower cost, but tightness usually becomes a problem after prolonged use.
2.1. Plunger-in-Barrel Syringes
7
Tightness of the Plunger in the Barrel
Moderately high pressures are encountered when the nee dle is inserted into the injector and the carrier gas inlet pres sure is high. Far higher pressures can, however, be reached during depression of the plunger, because the cross section of the latter is only ca. 0.2 mm 2• Force on the plunger corre sponding to 100 g (which is clearly more than normally ap plied) relates to 50 bar or 5 MPa.
Maximum 80 % Withdrawal of Plunger
lightness of steel plungers without PTFE tips depends on the position inside the barrel - the further the plunger is withdrawn, the shorter is the tight section. This is why it is sometimes recommended that the plunger is not withdrawn by more than about 80 % of the syringe capacity. This means that in a 10 IJ.L syringe, the tip of the plunger should not be behind the 8IJ.L mark.
Viscosity of the Sample
lightness also depends on the viscosity of the medium between the plunger and the barrel- seals are tight up to far higher pressures when there is a film of liquid instead of gas; the type of liquid (usually the solvent) also has a strong influence. Syringes with capacities of 50-500 IJ.L are available with steel plungers fitting tightly in the barrel (as for 10 IJ.L syringes), as well as with "gas-tight" plungers equipped with PTFEtips. Steel plungers are more reliable because they are not de formed during prolonged use, as are PTFE tips. If they are used for injection of gases, however, tightness is critical be cause of the low viscosity of the gas.
Test of Tightness
In case of doubt, the tightness of the fit of the plunger in the barrel should be tested. For injection of liquids a solvent of low viscosity, such as hexane, is picked up and pulled backwards out of the needle into the barrel. The needle is inserted into an injector with a high gas pressure inside. If there is leakage, the meniscus of the liquid moves upwards and liquid accumulates in the region where the plunger leaves the barrel. The test becomes sensitive when the plunger is inserted a short distance only into the syringe and when waiting for a time longer than during a normal injection. The most sensitive test involves a dry syringe. The plunger is pulled out of the barrel and allowed to dry. The needle is introduced into an injector, causing a stream of carrier gas to flow backwards through the syringe and dry it. The plunger is then re-introduced to the level to be tested and a drop of a solvent of low viscosity (such as hexane) is placed around the plunger where it enters the glass barrel (Figure A4). Some liquid flows into the narrow gap between the plunger and the barrel. Escaping gas (leakage) is sensitively detected by visual observation.
2.1.2. Plunger Guides
With manual injection, death of syringes most frequently results from deformation of the plunger - when not de
8
A 2. Syringes
Figure A4 Test of the tightness of the plunger by application of a drop of liquid in the region where gas would leave.
pressed concentrically, the steel wire is bent. Plungers can not be re-straightened properly, because there remains a deformation that rubs on the glass wall. This hinders fast depression (as required for hot needle injection). Grayish sludge containing fines from the plunger and the glass soon further hinders the movement of the plunger. The plunger guide was introduced as a solution to this problem. The, plunger guide can also be of advantage for the injection of samples in highly volatile matrices, because warm ing of the barrel by the fingers can be avoided. Elongated Barrel
SGE elongated the glass barrel by adding a region of wider bore in which a thicker rear part of the (also elongated) plunger moves (Figure A5). Only this robust thicker section leaves the barrel. Hamilton produces removable metal plunger guides working on the same principle. One draw back is that the syringe is heavier and more difficult to han dle with one hand only. Measuring section with fine plunger
Plunger guide with more robust plunger
I Figure A5 Syringe with plunger guide.
5 ul: Syringes
As prices of syringes decreased, fewer 10 ~L syringes with plunger guides are used. For 5 ~L syringes, however, the use of a guide is recommended. Their plunger has only half the cross section and is bent correspondingly easily.
Reinforced Plunger Neck
Because a high proportion of all plungers are bent when they reach the zero position (they are pushed excentrically into the barrel), SGE produces syringes of standard length, but with reinforcement of the last section of the plunger that enters a specially designed nut at the rear of the barrel. The plunger button is reinforced also. This facilitates fast depres sion of the plunger as needed forthe "hot needle" technique.
Flexible Plunger
SGE also offers a syringe with an elastic plunger which can not snap off or be deformed permanently.
2.2. Plunger-in-Needle Syringes
2.2. Plunger-in-Needle Syringes
9
Plunger-in-needle syringes keep the sample inside the needle. The plunger is equipped with a thin wire protruding into the needle to displace the liquid (Figure A6). The barrel of the syringe indicates the position of the wire inside the needle, but does not make contact with the sample. All the liquid is displaced. Measured sample volume
Needle
Figure A6
Plunger in needle syringe.
1ul: Syringe
Plunger-in-needle syringes of 0.5 to 25 III capacity are avail able commercially, but only the 1 III syringe has found wide spread use. It enables accurate measurement of ten times small:er sample volumes than standard 10 III syringes, i.e. as little as 0.05 Ill, and suggests itself for the injection of non-diluted samples. Standard needles are 56 or 70 mm long. 56 mm needles have a 90° cut at the outlet; the internal and external diameters are 0.15 and 0.70 mm, respectively. 70 mm needles have a 17° tip; internal and external diameters are 0.15 and 0.47 mm, respectively.
Problems
There are several problems connected with injection into hot chambers; they will be discussed in Section A9. Cleaning is more difficult and there is no visual control of whether or not air bubbles are included in the sample plug.
No Withdrawal of Plunger
One should resist the temptation to take a look at the fine tungsten wire serving as the plunger - after the plunger has been fully withdrawn from the syringe, it is extremely dif ficult to insert it again.
2.3. Syringe Needles
Needle diameters are standardized by "gauge". Those most important for GC are listed in Table A1. The intemal diameter is kept as small as possible to minimize the inner volume of the needle (extra volume being transferred when the needle is heated). On the other hand, the needle should not cause build up of an excessive pressure drop, because this hinders sucking up the sample liquid, particularly when volatile solvents are involved. The outer diameter is a compromise between robust ness and a minimized effect on the septum.
2.3.1. Dimensions
Length
Standard syringes are equipped with needles 51 mm long (2 inches, including the section glued into the glass barrel). As will be shown later, split injection at low split ratios and splitless injection often require longer needles, commonly
A 2. Syringes
10
Table A1 Diameters of the most important syringe needles and internal volumes for needles of 51 mm length.
Gauge
22 225 23 235 25S 26 26S
Diameters (mm) internal external 0.41 0.15 0.64 0.64 0.15 0.26 0.13
0.72 0.72 0.34 0.15 0.52 0.46 0.47
Internal volume (Ill) 6.73 0.90
Main use
0.90
Headspace Autosampler Autosampler Autosampler Autosampler
0.68
Manual injection
71 mm (3 inches). For injection with band formation, 3.7 mm (1.5 inches) needles are most suitable. Gas syringes for headspace analysis should have an 80 mm needle with a side port hole. Syringes with needles of custom length are available at a small extra cost.
2.3.2. Needle Tips Beveled Tips
The standard style needle tip for injection through a septum, the beveled point, is polished at an angle of 17·20°. The tip is bent slightly inward, i.e. towards the center of the tubing, for better displacement of the septum and to reduce the chance of the needle cutting away a particle of the septum material. The tip is easily bent, e.g. after the syringe is dropped on the floor. The deformation is more easily felt by sliding the fingers over the needle tip than seen by eye. It affects the way the liquid exits the needle (see Section 83.2) and scrapes a hole into the septum. Needle tips should, therefore, be regu larly checked.
Conical Style
Syringes for autosamplers, in particular, are often equipped with conical style needles - cut squarely, but polished to a cone with an 8° angle. If they always pierce the septum at the same position, they are supposed to reduce septum coring (and resulting deposition of particles inside the va porizing chamber).
Side Port Hole
The tip of needles with a side port hole is closed to a rounded point. About 1 mm back, there is a small hole in the side wall. This needle style practically rules out cutting of septum particles and is unlikely to be plugged, which is particularly suitable for headspace syringes, because other needles tend to be plugged. They have, nevertheless, never become popular. For injection of liquid samples, release through the side port influences sample evaporation and distribution within the vaporizing chamber- sometimes advantageously, some times not.
2.3. Syringe Needles
2.3.3. Fixed versus Removable Needles
11
Most manufacturers offer syringes with fixed needles, ce mented into the barrel at a position corresponding to the zero graduation, or removable needles, tightened against the barrel with a small PTFEferrule. When a fixed needle is dam aged, the entire syringe must be replaced; this is probably the only argument in favor of the removable needle.
Problems with Removable Needles
Prices of syringes with removable needles are substantially higher, and this investment is justified only when the needle is ruined rather frequently. Furthermore, connection of the needle to the barrel can be a problem, firstly, because it usu ally retains some air and encourages bubble formation, like a boiling stone, when picking up volatile solvents. Sec ondly, some connections have significant dead volume sample material enters this by diffusion, particularly when the syringe is lying around after the injection with sample liquid remaining in the critical region. Because rinsing with solvent does not clean dead volumes, this readily generates "memory effects".
2.4. Cleaning of Syringes
Before investing much effort in sophisticated procedures for cleaning syringes, it is useful to consider some general rules which help minimize the effort required. Such rules might even become parts of validated methods, because the reliability of the results easily depends on them.
2.4.1. Basic Rules
When performing series of analyses, it is usually sufficient to remove 99 % of the material from the previous sample, because solute concentrations vary by less than a factor of 10. Such cleaning is readily achieved.
At the opposite end of the scale of difficulty, a syringe might
first be used to prepare a standard solution, measuring a
neat substance. Afterwards it is used for injection in trace
analysis, in which picogram quantities of the same compo
nent, levels maybe 100,000,000 times less, are detected.
Cleaning the syringe to remove 99.9999999 % of the mate
rial is virtually impossible.
Classify the Cleaning Re quired
Use the Same Syringe
Use the same syringe throughout a series of analyses (as autosamplers inevitably do). This renders the requirements more transparent. It rules out introduction of materials from other sources (such as from the preparation of a standard solution). It also ensures that the sample always leaves the needle in the same way - small deformations of the needle tip may have a strong effect on the evaporation process (e.g. through a spray effect).
Estimate the Required Cleaning Effect
lfthe samples contain the solutes of interest in amounts vary ing by not more than one order of magnitude (e.g. analysis of the fatty acid composition of edible oils), 99 % cleaning is sufficient. In the analysis of pesticide residues, a high con centration' might be 100 times above the lower detection limit
12
A 2. Syringes of ,the method, i.e. 99.9 % cleaning guarantees that subse
quent samples will be free from residues, i.e. there is no
memory effect.
Efficiency of 99.9 % is probably about the limit of reli
able syringe cleaning by autosamplers or manual injection
without special precautions. If higher efficiency is required,
a blank must be run after the analysis of every sample.
Beware of Concentrated Samples
A common experience, e.g., in residue analysis, is that a
highly concentrated solution of a standard is injected to find
the peak of interest (setting up the method). The samples
analyzed subsequently are all positive. As the analyst recog
nizes that his results are puzzling, he runs a blank and con
firms the carry-over. It is concluded that injection of highly
concentrated solutions should be avoided and that blanks
must be analyzed before running the first analysis.
Separate Syringes for Adding Standard
Although addition of standards by use of a 10 III syringe is
not highly accurate, it is frequently used in the interest of
working with small sample sizes and vials. The danger of
this procedure is that the same syringe is subsequently used
for injection of the sample. As the standard solutions are
usually 100-10,000 times more concentrated, cleaning
is demanding.
Label Syringes
It is convenient and advantageous for the reliability of the
results to use different syringes for different purposes.
It might be necessary to label them to rule out confusion,
e.g. by use of colored rings at the top of the glass barrel. Alternatively, syringes with especially short needles can be used for purposes other than injection.
Silylation Reagents
If samples contain high concentrations of derivatization rea gents, such as for silylation or acylation, the syringe must be cleaned immediately after injection, since hydrolysis by humidity from the air easily plugs the needle otherwise.
2.4.2. Cleaning Proce dures
The most simple cleaning procedure is moving the plunger up and down. The effectiveness of this procedure is limited by the volume of liquid inside the needle, which is moved up and down without really being replaced - it is merely mixed with the solvent or the subsequent sample. Because turbulence caused by transition from the narrow bore needle into the wider barrel provides most of the mix ing, the liquid should be withdrawn as fast as possible. Rapid suction also prevents all the material deposited on the sy ringe wall dissolving in the first small amount of liquid en tering the needle; this is most difficult to remove afterwards. Use of autosamplers shows that reliable 99.9 % cleaning is achieved in this manner.
Sample material between the plunger and the barrel is
not efficiently removed. The amount is, however, small - if
there is a 1 11m gap between the barrel and the plunger, this
Movement of the Plunger
2.4. Cleaning of Syringes
13
volume amounts to ca. 0.7 % ofthe whole internal volume of the barrel and 99.9 % cleaning efficiency is, hence, hardly endangered. Solvent or Subsequent Sample?
Often syringes are not cleaned with solvent, but with the subsequent sample. Whether or not this is acceptable is de termined by the tolerable carry-over. Material from the first sample corresponding to a volume of about 1 ~L might be transferred into the following sample. If it is assumed that the component of interest was present at a concentration 100 times higher in the first sample and that the volume of the second sample is 10 mL, contamination reaches 1 %. If the sample volume is only 1 mL (autosampler vial), contami nation reaches 10 %. Cleaning with the subsequent sample is, hence, acceptable if 90-99 % cleaning efficiency is sufficient.
Discharge Backwards
When performed manually, cleaning efficiency can be sub stantially improved by passage of a plug of liquid backwards out of the syringe. Some 5 ~L of liquid is sucked into the syringe and the plunger is removed from the barrel. At this moment, the 5 ~L are in the upper region of the barrel. The syringe is then shaken sharply such that most of the liq uid leaves the barrel. In this way, the poorly exchanged plug is removed and the whole channel in the barrel is rinsed. The plunger can be immersed in solvent to clean its outside before it is brought back into the syringe.
Vacuum
A source of vacuum can be used to suck solvent through the syringe. The plunger is pulled out ofthe barrel, the nee dle immersed in a suitable solvent, and the vacuum applied. Soft rubber or silicone tubing connecting to the vacuum is suitable - if the rear of the syringe is pressed against it, sufficient tightness is obtained. The plunger is again rinsed before being re-inserted. A weak vacuum is preferable, par ticularly for a volatile solvent, because a strong vacuum causes evaporation instead of rinsing.
Pressurized Solvent
Syringe cleaners are available consisting of a solvent con tainer connected to a source of pressurized gas. They are equipped with a septum through which the syringe needle is introduced. The plunger is removed, opening the way for the solvent to rinse the syringe needle and the barrel. The solvent may need frequent replacement, not least because septum particles tend to accumulate and release silicone components which show up in the chromatograms.
Drying the Syringe by Vacuum
Other syringe cleaners (e.g. Hamilton, SGE) heat the needle and evacuate it. The needle is introduced through a septum into a chamber that can be heated to 380°C. The plunger can be moved backwards and forwards to move the vapors, or removed completely to allow passage of a stream of air.
14
A 2. Syringes
Such a device cannot eliminate high-boiling or involatile material- on the contrary, once lacquered at the high tem perature, it can no longer be removed even by use of sol vent, as observed for injector liners. Hence the syringe should be rinsed with solvent before introduction into this type of cleaner. The device is particularly effective for plunger-in-needle syringes, because the whole part in contact with sample liquid is heated. Drying in the Injector
An equally efficient method simply uses a normal vaporiz ing injector. The plunger is removed and the syringe needle is inserted through the septum. With a low pressure in the injector a stream of carrier gas purges the volatile mate rial from the syringe. Because the syringe is purged outwards, no material enters the injector.
2.4.3. Plugged Needles
Needles may become plugged, e.g., after injection of silylated ortrifluoroacetylated samples containing high concentrations of residual reagent. When the syringe is left for some time, hydrolysis forms a plug near the tip of the needle. Plugged needles should not be cleared by applying high pres sure to the plunger because all too easily the barrel cracks (pressures exceeding 100 bar are easily reached).
Cleaning Wire
New syringes sometimes contain thin wires in the needle which can be used to unblock the needle. Hamilton and SGE supply thin tungsten wires for the same purpose.
Heating
A rapid method involves warming of the needle at the site where blockage is assumed. Some solvent is placed in the barrel from the rear - by removing the plunger and introduc ing solvent by means of another syringe with a long, thin needle. Modest pressure is then applied to the plunger while the needle is warmed gently in a yellow flame (e.g. cigarette lighter). The plug softens and is displaced by the solvent, which flushes the needle. The needle must not reach high temperatures, however; otherwise it turns permanently soft.
2.4.4. Blocked Plungers
The plunger moves with difficulty if gray sludge contain ing the fines of abraded glass and metal accumulates between the plunger and the barrel. Solvent usually does not remove it. Although against the advice of syringe manufacturers, pull ing the plunger through the fingers removes such material rather efficiently and can solve the problem if repeated. If this does not help, the sludge must be removed by use of hydrochloric or phosphoric acid. Immediately afterwards, the syringe and the plunger must be thoroughly rinsed with water and a solvent, such as ethanol or acetone. Alkali must be avqided because it attacks the glass.
3.1. The Three-Step Model
15
3. Evaporation Inside the Needle When the plunger of the syringe is pulled upwards after a manual injection of a solution in a commonly used solvent, hardly any liquid is seen clinging to its tip (plunger-in-barrel syringe). This implies that not only the volume of sample read on the barrel of the syringe was injected, but also that which should have been left inside the needle. What we see by eye, however, is the sample solvent, which is the sample component of least interest. Manual Injection
This section deals with sample (solvent) evaporation inside the needle and transfer of solute material as it occurs with manual injection or with autosamplers which imitate this. It does not apply to autosampler injection at such a speed that evaporation inside the needle is suppressed.
3.1. The Three-Step Model
At first, the problem seems to be the fate of the liquid re maining inside the needle after the plunger was depressed. A closer look reveals that things might be more complicated.
Assumptions
Below we consider the injection of 1 J!L of liquid measured on the barrel of a syringe equipped with a 71 mm needle of 1 J!L internal volume. We assume that the liquid is with drawn into the barrel of the syringe before introduction of the needle into the hot injector.
1. Evaporation of the First Liquid
The first 1 I!L of liquid injected, which is actually that left in the needle and not that observed when measuring the sam ple volume, encounters a needle wall which has been heated above the solvent boiling point, primarily during passage through the septum. Violent evaporation is initiated vapors formed along the needle wall push some ofthe liquid out of the needle. Overpressure is built up, increasing the boiling point of the solvent; when the liquid leaves the nee dle, it explodes into small droplets, driven apart by the va pors (thermospray). The evaporating solvent leaves high-boiling material on the needle wall, because the temperature of its environment does not exceed the (pressure-corrected) boiling point of the lat ter (left in Figure A7).
2. Cooling of the Needle Wall
Consumption of heat by the evaporating solvent cools the surface of the needle wall. When its temperature falls to the solvent boiling point, the sample liquid wets the wall and the following liquid passes without evaporation (center
16
A 3. Evaporation Inside the Needle
2
1
•
•
Sample
evapor ation
in hot needl e;
no welting of
Ihewall
3
Syringe needl e
Liquid wets the needle cooled by solvent eva poration
: ~{
J
!
• '"
Remaining liquid eluted by partial evaporation
•
Figure A7 Three steps during injection through a hot syringe needle.
in Figure A7) . The liquid might even re-dissolve the material previously deposited on the needle wall and carry it into the injector. This picture obviously simpl ifies - only continuing solvent evaporation keeps the needle temperature at the boiling point. When the surface is wetted again after the formation of some vapor, however, the essential point is still achieved: transfer without loss of high-boiling material. 3. Expulsion of the Remain ing Liquid
When the plunger reaches the bottom, the syr inge needle is filled with the second microliter of liquid (that observed in the barrel). Before the needle can be withdrawn, its surface is again heated above the solvent boiling point, caus ing the content to undergo partial evaporation; a mixture of vapor and droplets is ejected into the vaporizing chamber. Again high-boiling solute material from the evaporating liq uid is left on the needle wall.
Effect on Discrimination
Steps 1 and 3 in Figure A7 result in loss of high-boiling sol ute material as a result of incomplete sample evaporation on the needle surface. If the internal wall is sufficiently cooled to enable step 2, however, losses occurring during the first step are recovered .
Sufficient Cooling for Wet ting?
It is largely speculation whether cooling is sufficient for a step 2. If we assume that the plunger is depressed at a veloc ity of 1 mis, liquid enters the needle during a period of 15 ms. Partial evaporation of 2 III of liquid absorbs a consider able amount of heat, but the heat capacity of the needle far exceeds the heat consumed (the mass of the needle exceeds that of the sample by a factor of about 25). The sample can,
3.7. The Three-Step Model
77
therefore, cool a thin surface layer at best and, because of the high thermal conductivity of the metal, the cooling process must be very rapid if it is to be quicker than the rate at which heat is supplied. This also means that the tempera ture increase in step 3 is rapid - too rapid to give us a chance of (manually) withdrawing the needle before evaporation starts again. Experimental data on losses in the needle suggest that liq uid does wet the needle wall if the sample volume exceeds a certain minimum and depression of the plunger is fast. The videos on the CD, on the other hand, do not support this since a band of liquid should then be expected to leave the needle. 3.2. Models of Evapora tion inside the Needle
Losses of high-boiling solute material depend on the spe cific nature of the injection. It is helpful to consider the three models below which describe how the solutes can leave the needle. First we concentrate on the liquid remaining inside the needle after depression of the plunger.
3.2. ,. Distillation from
If the sample evaporates fully, only vapor leaves the needle. Vapor is expelled because of the expansion in volume ac companying evaporation (a factor of 100-500). According to the most simple model, transfer should be almost com plete, as the volume of vapor remaining in the needle is less than 1 % of the original liquid content (0.6-1 ~L of the 100 500 ~L of vapor formed). This assumes that all of the sample is vaporized at once. If a needle temperature of 200°C is assumed (in an injector thermostatted at 250°C), the distillation model would pre dict that of the n-alkanes only those with a molecular weight below that of n-undecane should reach the injector. It is, how ever, obvious that this does not accord with common experi ence.
the Needle
Theoretical Treatment
Guha [4] studied the effects of sample evaporation inside the needle both theoretically and for some test mixtures, as suming complete evaporation and a distillation-like model. He used basic gas laws to calculate the effect of needle size, injector temperature, carrier gas inlet pressure, and sample volatility on the amount injected. The conclusion was that representative sampling could be achieved only by use of plunger-in-needle syringes without dead volume in the nee dle.
3.2.2. Gas Chromatogra phy in the Needle
The above distillation model is inadequate, because it is not generally necessary that the solute vapor reach at mospheric pressure to leave the needle. In particular, the material deposited on the needle wall near the exit of the needle is well flushed out of the needle by the passage of the vapor of the volatiles (solvent).
18
A 3. Evaporation Inside the Needle
Small Vapor Pressure Suffices
Transfer of high-boiling material through and finally out of the syringe needle resembles a gas chromatographic proc ess - the needle is the capillary column, the condensed sam ple material and the contaminants from previous injections on the needle wall are the stationary phase, and the vapor of the sample (solvent) evaporating in the rear of the needle is the carrier gas (see upper scenario in Figure AS).
Chromatography in the Needle Chromatography of solutes .:~::.'
.:.:.
...:.:.....•.'.
Stream of vapor serving as carrier gas
.:~
"
Dirt layer acting as retaining
stationary phase
Ejection from the Needle
~=F
Expanding vapor bubbles
build up pressure
Figure AS Two models describing the elution of the sample from the syringe needle at the end of the injection.
The components are partitioned between the gas (vapor) phase and the liquid phase on the needle wall in accordance with their vapor pressure. A small amount evaporates. This vapor is immediately removed by the stream of sol vent vapor, which prompts more solute material to evapo rate, etc. This model correctly predicts that the solutes eluted may include components which boil at temperatures far above that of the needle.
3.2.3. Ejection f,om the
Needle
The above models require fairly gentle evaporation condi tions inside the needle, in particular an amount of time which is usually not available. This gives rise to a third mechanism, which again is not realistic in the extreme form. Rapid depression of the plunger might introduce the plug of liquid into the syringe needle at a speed such that no signifi cant evaporation occurs until the plug is fully introduced. Violent evaporation on the needle wall then forms bubbles of rapidly expanding vapor, building up high pressure and discharging the liquid through the center of the needle.
Ejected liquid carries all dissolved sample material out of the needle. irrespective of volatility. Losses and dis crirnination are restricted to the amount of solution evapo rated on the needle wall.
3.3. Conclusions Regarding Optimized Injection
19
3.3. Conclusions Regard ing Optimized Iniection
The above models enable us to draw the following conclu sions about how best to perform syringe injection into a hot injector.
Ejection rather than Evapora tion
Injection must be performed in such a way that ejection of sample liquid is privileged over evaporation. This means that evaporation should be rendered violent, the needle wall should be as hot as possible to build up maximum pressure with a minimum evaporation, and the liquid should be moved as rapidly as possible. This results in the recommendation to inject by the "hot nee dle" technique: see below.
Losses of Solute at the Rear of the Needle
It has been confirmed experimentally that most of the loss of solute material occurs at the rear of the syringe needle (Figure A9). Elution of sample components deposited on the needle wall near the needle exit is relatively easy, be cause this front section is flushed by the largest volume of vapor (the vapors of the solvent evaporated behind this polnt), At the rear of the needle, the opposite is true: only a small volume of vapor passes over the sample material, and the latter must move a large distance to reach the nee dle exit. The solute material must have a high vapor pres sure if it is to evaporate in the presence of only a small amount of solvent. Point at which evaporation
~ _ro:,: 10' h,•
).,f'
---"»,.. ~-m~$;~'
Solute to be flushed through a long distance by a small volume of vapor. A high vapor pressure is needed.
Solute near the needle exit. flushed forward by a large volume of vapor. A small vapor pressure is sufficient.
Figure A9 Elution from the syringe needle, considered for two small piles of solute material at the front and rear of the needle. 1 ng of material forms some 0.0001 j.1.L of vapor, i.e. the solute material cannot leave the needle without being carried by solvent vapors.
High Temperature at the Rear of the Needle
If high-boiling solute material is to have a chance of leaving the rear of the needle, the temperature must be higher there than at the front. Usually the opposite is true - because the rear of the needle is heated by the head of the injector (septum area), its temperature might well be more than 1000 below that regulated in the center of the injector (see Sec tion A8.2).
Contaminated Needles
It is well known that injections performed with different sy ringes can furnish different quantitative results. There are probably many reasons for this. One is a layer of contami nants on the inner wall of the needle which retains
20
A 3. Evaporation Inside the Needle
the solute material in the same manner as would a sta tionary phase in a capillary column. It is normal to care about the cleanliness of the injector liner - because "dirt" is visible there. Analysts hardly go peering into syringe needles, however, although we can safely as sume that internal wall of many needles is coated with a thick, dark-brown layer of contaminants. The solutes are, further more, in more intimate contact with this layer on the needle wall than with that on the liner wall. If significant quantities of high-boiling solutes are lost inside the needle, involatile sample by-products would be expected to remain on the needle wall to an even greater extent. They form a lacquer-like layer which can often no longer be washed out - at least not by solvents such as hexane, as we learn from cleaning injector liners. Matrix Effects as a Result of Expulsion from the Needle?
By "matrix effects" we understand effects of the sample on the quantitative results for the solutes of interest. The re sults depend on the sample by-products. It would not be surprising if injection of a "dirty" sample were to result in greater losses inside the syringe needle than a mixture of standards in pure solvent - a relatively thick layer of retaining material on the needle wall retains the high-boiling components more strongly. No data are, . however, available on this point.
4. How Much is Really Injected? The following discussion on the practical implications of sam
ple evaporation in the syringe needle applies to 5 and 10
ilL syringes; plunger-in-needle (one-microliter) syringes are
not recommended for the analysis of samples in a volatile
matrix (Section A9).
If evaporation inside the syringe needle interferes, the vol
ume injected is poorly defined. There is, in fact, little benefit
in having syringes graduated with an accuracy usually guar
anteed at ±1%.
4.1. Interpretations of "Sample Volume"
The sample volume really injected is often shrouded in con fusion. The following three definitions are common.
Calibrated Volume
The first analyst means the volume marked on the bar reI. i.e. the volume he adjusted by depressing the plunger after having withdrawn a volume in excess of that required. He ne~lects the volume eluted from the needle and uses the syringe in the way it was conceived.
4.1. Interpretations of "Sample Volume"
2 1
Absolute Measurement
The second analyst is more knowledgeable. He withdraws the plunger before and after the injection and determines the total volumes of liquid present in the syringe. His sample volume corresponds to the difference between these two absolute measurements. He is probably closer to the truth, but, if the sample is a solution, he actually only knows the volume of solvent injected.
Adding Needle Volume
The third analyst adds the internal needle volume to the vol ume read on the barrel without having a closer look at it, saying that the volume of liquid remaining in the syringe is of little importance in relation to the other uncertainties in volved.
4.2. Communicating "Sample Volumes"
Because there is no convincing way of accurately determin ing sample volumes, there is a need to define what is meant by, e.g., "sample volume, 1 Ill". Was injection performed by a fast autosampler which avoided transfer of the needle vol ume or by a technique causing the needle volume to be emptied? Is the 1 III mentioned or read in a method just the needle volume? Is it 1 III measured on the barrel of the sy ringe plus the needle volume? It is, of course, important to know whether effectively 1 or 2 III were injected.
Proposed Definition
Distinction must be made between injections with and with
out sample evaporation inside the needle.
1 If there is no evaporation (including PTV and on-col
umn injection), the volume is written in the normal way, i.e. without quotation marks. 2 If there is evaporation, we suggest that the volume cor responding to the graduation on the barrel is written between quotation marks, i.e. as a quotation from the syringe. It indicates that the real vol ume is or was larger. 3 The read-off sample volume plus the internal volume of the syringe needle is written without quotation marks, because, for volatile components at least, it is closer to the truth.
Example
If, for instance, a needle volume of sample is manually in jected into a hot injector and the syringe needle has an inter nal volume of 0.9 Ill, the sample volume is 0.9 III or "0 Ill". For the same syringe, "1 Ill" is equivalent to 1.9 ul.,
4.3. Effects on Quantita tive Analysis
The problem of measuring an accurate sample volume when evaporation occurs inside the needle leads to the following three working rules:
1. Absolute Quantitation only for Volatiles
It is possible to measure the sample volume accurately ifthe solutes leave the syringe in the same proportion as the sol vent. When the injector temperature is 250°C and the septum cap well heated, this is usually a reasonable approximation for components up to, e.g., the n-alkane C20 or the methyl
22
A 4. How Much is Really Injected? ester of the C'6 fatty acid. For higher boiling solutes, the quantitation procedure must be independent of the sample volume because the amount injected must be re garded as unknown.
2. External Standard Method - Constant Sample Volume
If the external standard method is used, the sample volume must be kept constant, because an essentially unknown volume cannot be changed by a known proportion. It is, for instance, impossible to double a sample volume accu rately (e.g. to increase sensitivity). "1 ~L" is certainly far less than twice "0.5 ~L" (1.9 and 1.4 ~L, assuming a needle vol ume of 0.9 ~L), but for high-boiling solutes, 2.8 ~L is also more than twice 1.4 ~L, because the proportion of material expelled increases with the sample volume injected. In split injection, the sample volume must also be kept constant to keep the true split ratio constant.
3. Internal Standard Method - Less Critical
For analyses involving internal standards, the sample vol ume is less of a problem because a wrong volume is wrong to the same extent for the solutes as for the internal stand ard. Since discrimination arising from losses inside the sy ringe needle depends on the volume of sample injected, however, it is nevertheless advisable to keep the sample volume constant.
5. Syringe Needle Handling Minimizing Discrimina
tion Discrimination against high-boiling compounds is usually more troublesome than assessment of the amount of sam ple material injected. Maximizing Transfer from the Needle
If the composition of the sample entering the injector is to be identical with that in the vial, all solutes must leave the syringe needle in the same proportion. For a mix ture containing components with a wide range of volatility, this can only be fulfilled if transfer is either totally suppressed or approaches completeness. Here we consider the second option and search for the needle handling technique which performs best.
5.1. Definitions of Tech niques
Discussion of ways of handling the syringe during the injec tion is facilitated if some methods are referred to by name.
Filled Needle Injection
Injection by the filled needle method means that the needle is full of sample liquid when inserted into the injector, i.e. the sample is not withdrawn from the needle into the
5.1. Definitions of Techniques
23
barrel. The plunger is depressed as soon as the needle is fully introduced. Autosamplers classically apply this method. Cool (Cold) Needle Injection
The measured sample is withdrawn into the barrel of the syringe (usually by more than is necessary to pull the sam ple liquid out of the needle); the empty needle is inserted into the injector and the plunger depressed immediately. "Cool" refers to the needle temperature at the moment the plunger is depressed.
Hot Needle Injection
The sample is withdrawn into the barrel of the syringe as with cool needle injection, but the inserted needle is pre heated in the injector for 3-5 s so that its temperature ap proaches that of the injector. Depression of the plunger oc curs as fast as possible; to achieve this it is advisable to with draw the sample 1-2 cm behind the needle entrance.
Slow Injection
Slow injection is used to release the sample at a rate such that the vapors generated are transferred to the column more or less concurrently. The sample liquid is withdrawn into the barrel just above the entrance of the needle. After the needle is inserted, the plunger is pushed down slowly (some 5-10 s per microliter of sample).
Wet Needle Injection
This is a method for the introduction of extremely small sam ple volumes by making use of 5 or 10 III syringes. Shortly before injection, the sample is withdrawn into the barrel of the syringe. The needle is introduced into the injector as rap idly as possible and withdrawn again after 2-3 s with out depressing the plunger. Only the liquid coating the needle wall is injected; this corresponds to 20-100 nt, de pending on the viscosity of the sample, the speed at which the sample plug is pulled out ofthe needle (rapid withdrawal leaves a large amount in the needle), and the wettability of the needle wall by the sample.
Solvent Flush Injection
The syringe needle is filled with pure solvent followed by ca. 0.2 III air and then the sample. The solvent is sup posed to rinse the sample from the needle. Other conditions are not specified, but solvent flush injection is usually per formed according to the cool needle method.
Air Plug Injection
Approximately 3 III of air are sucked into the syringe, followed by the sample. The air is supposed to push the plug of sample liquid through the needle. The sample must be withdrawn into the barrel of the syringe, because a slight expansion of the air plug (solvent vapor, warming of the sy ringe by the fingers) would otherwise push some sample liquid out of the needle. The injection speed is not defined.
Sandwich Injection
The syringe needle is filled with pure solvent, followed by ca. 0.2Ill'air, the sample, another plug of air and about 1 III of pure solvent. Again, no further details are stipulated.
UNIVERSIDAD DE ANTIoqUlJ'
BmLIOTBCA Ch"'NTRAL
24
A 5. Syringe Needle Handling Minimizing Discrimination
Fast Injection
Some authors describe their (manual) injection as "fast". They usually mean a cool needle technique performed at high speed. Other times they mean a filled needle injection.
5.2. Experimental Deter mination of Losses in the Needle
Comparison of different needle handling techniques requires a method for determining the loss of high-boiling solutes inside the syringe needle. It must, in particular, be possible to differentiate between losses in the needle and losses in the injector (such as insufficient sample transfer in splitless injection and non-linear splitting in split injection).
Principle
A mixture containing solutes with a wide range of volatilities is injected by the technique to be tested and peaks areas are integrated. Solvent is sucked into the syringe needle and this "needle rinse" is injected into the same or a second instru ment. The peak areas obtained from the two injections are compared.
5.2.1. Method with Two Instruments
A test sample consisting, e.g., of equal amounts of n-alkanes from C,o to C44 or the sample currently being analyzed is in jected by the split or the splitless method into the first instru ment. Peak areas are calculated as percentage of the most volatile component. If the latter is sufficiently vola tile (such as n-C,o), it can be considered to be fully eluted from the needle, i.e. in the same proportion as the solvent.
Alkanes - Equal Response
Because alkanes give practically equal FlO response per unit weight, peak areas can be interpreted directly. The results can be represented by a so-called discrimination curve, as shown in Figure A10 (lower curve, "first chromatogram"). At this stage, however, discrimination resulting from selec tive losses inside the syringe needle cannot yet be distin guished from other types of discrimination.
Needle Rinse Injection on Second Instrument
A second instrument is used to determine the solute mate rial left inside the syringe needle by means of a "needle rinse injection" [5]. Conditions are selected such that dis crimination is minimized - high injector temperature (e.g. 350°C for alkanes), hot needle injection of '" Ill". Absolute peak areas obtained from this instrument are calibrated by injecting the test sample. After injection into the first instrument, a "'Ill" volume of solvent (the same as used for the calibration of the second instrument) is drawn into the syringe without moving the plunger up and down, accepting the air plug behind the liq uid (otherwise solute material is lost). After giving the sol vent some time to dissolve the material on the needle wall, the liquid is slowly withdrawn into the barrel of the syringe and injected.
Correction for Liquid Left in the Needle
The peak area obtained for the most volatile solute in the needle rinse analysis can be assumed to correspond to the
5.2. Experimental Determination of Losses in the Needle relative
peak
25
area
80
60
40
first
chromatogram
20
10'2
14
22
28
34
40
44
alleane C.
Figur. A10 Exp.rim.ntal d.t.rmination of 10•••• in the .yringe n••dl. for cool n••dl••plit inj.ction of a n••dl. volum. (0.9 Illl. Inj.ctor t.mp.rature, 250°C. Th. low.r curv• •how. the m.anp.ak ar.a. obtain.d from r.peat.d .plit inj.ction of the t.st .ampl. (C,G-44 ...alkan••, 100 ppm .ach in h.xan.l. Th. m.an 10•••• in the n••dl. (hatch.d ar.al, d.t.rmin.d on a ••cond instrum.nt, w.r. add.d to the p.ak ar.a. of the first inj.ction. (From [5]).
amount dissolved in the sample liquid which remained at the tip of the plunger after the first injection, i.e. to the por tion of which nothing entered the injector (it was inside the cool section of the needle fitted into the barrel). It is sub tracted from the areas of all the higher alkanes. Plotting Needle Rinse Results
After subtracting the area e.g. n-C,o, the peak areas obtained from the needle rinse injections are expressed as percent ages of the areas obtained by calibration and added to the top of the discrimination curve from the first injection, as shown by the hatched area in Figure A10. If there is no dis crimination during the first injection other than that arising from the syringe needle, the combined peak areas should approach 100 % - they do so sometimes but not always.
5.2.2. Experiment with" Single Instrument
A similar experiment can be performed with a single instru ment only, injecting the needle rinse after the first analy sis. Unless highly volatile solutes are included in the mix ture, solute losses from the needle during the time taken for the first analysis are negligible (e.g. n-C,o did not leave the needle to a significant extent during a period of one hour). Quantitation can be simplified - if the same volume of the same solvent is used for the needle rinse injection as for the first injection, peak areas obtained from the two injections can be compared directly (otherwise the split ratio might be different). It remains, however, unknown how much mate rial still remains in the needle after the second injection.
A 5. Syringe Needle Handling Minimizing Discrimination
26
5.2.3. Test During Rou tine Analysis
5.3. Comparison of Needle Handling Tech niques
In everyday GC it is often difficult to ascribe strong dis crimination and/or excessively high standard devia tions to the correct cause - there are too many possible causes of similar phenomena. In such circumstances it is helpful to obtain a quick estimate of losses inside the nee dle. The experiment is performed as described above forthe one-instrument method; after analysis of a sample a needle rinse is injected using the sample solvent or a solvent ensur ing complete dissolution of critical sample components. The result immediately tells the analyst whether losses in the syringe needle contributed significantly to his problems.
Figure A11 compares discrimination by split injection with different needle handling techniques. A needle volume ("0 ul," or 0.9 ut.) of n-alkanes between Cg and C44 in hexane was injected (Carlo Erba Mod. 4160 instrument). Results from on-column injection show the "true" (undiscriminated) com position of the sample -the peak areas follow the 100 % line, as might be expected. All methods of needle handling resulted in discrimi nation starting just beyond ",C20 , even though the injec tor temperature (the temperature in the center of the injec tor, not that of the septum cap) was as high as 350 DC. Filled needle injection can be regarded as a double injec tion. During insertion of the needle, the volume of sample contained therein is expelled. This is followed by the rneas
peak area
normalized for Cg (=100)
':;:--'
100
--
---
50
25
9
12
16
20
26
Figure A11
Discrimination against high-boiling sample components as a result of losses inside the sy
ringe needle for different injection techniques. Equal concentrations of Ce-CoM n-alkanes in
hexane; peak areas normalized relative to n-C e (average values from at least six injections).
Needle rinse analyses confirmed that discrimination was virtually exclusively a consequence of selective elution from the needle. (From [6]).
5.3. Comparison of Needle Handling Techniques
5.3. t. Filled Needle Injection
Loss Through the Septum Purge
High Losses
Speed of Needle Introduc tion
Poor Reproducibility
2 7
ured sample volume when the plunger is depressed. Injec tion must be performed rapidly to avoid peak splitting. The results in Figure A 11 were obtained by injection of a needle volume only, i.e. injection consisted of the first step only. A full needle was introduced; the plunger was kept at the "0 Ill" position throughout the injection. The injection point is ill-defined. Evaporation and elution usually start as soon as the needle pierces the hot septum. Material eluted while the needle tip passes through the injector head is vented through the septum purge. losses of high-boiling components relative to n-Cg were ex tremely high: they amounted to almost 10 % for the rather volatile n-C20 , 40 % for n-C32 , and 80 % for n-C 44 (Figure A 11). Whether sample material was lost through the septum purge could not be determined, because absolute areas var ied too much from one needle technique to another. The results shown in Figure A 11 are somewhat arbitrary av erages because the discrimination was highly dependent on the speed of needle introduction. If the needle en tered smoothly and rapidly, the results were far better than average; occasionally they even approached those obtained by hot needle injection. During such exceptionally success ful injections the sample apparently remained in the needle until the latter was fully inserted and most was then ejected as a liquid by the sudden onset of violent evaporation (simi lar to delayed evaporation). losses were particularly high when a new septum had to be pierced. possibly with a long and already somewhat distorted syringe needle. In such instances it was often found that vir tually no peaks of n-C36 -44 were detected. Slow introduc tion of the needle provides much time for sample evaporation from the needle. The reproducibility of results obtained by filled needle injec tion depends on the ability of the chromatographer always to inject with the same rhythm, but also on factors not under the control of the analyst. The presence of nuclei initiating evaporation, e.g. of porous material on the needle wall behaving as a boiling stone, is expected to influence the results. Sometimes an air bubble included in the sample plug expands rapidly upon warming and pushes the liquid out of the needle before violent evapo ration starts. Such mechanisms lead to high standard devia tions and frequent runaway results (which seem inexpli cable and all too often the analyst assumes it was his fault). No statistical data are given here because such results are representative of the person rather than the techn ique. Maybe candidates for a job in GC could be evaluated by the stand ard deviation they achieve for such injections.
28
A 5. Syringe Needle Handling Minimizing Discrimination
Autosamplers
5.3.2. Slow Injection
Extreme Discrimination
Visual Observation of Evaporation
5.3.3. Cool Needle Injection
Classical autosamplers apply the filled needle method, a ba sically poor technique. Introduction of the needle is, how ever, rapid and highly reproducible, which eliminates the important weaknesses of manual filled needle injection. Autosamplers are, in fact, known to be considerably more reproducible than manual injection (often even when the latter involves the best needle handling techniques). Slow depression of the plunger has been recommended for splitless injection to reduce the vapor cloud to a size that could be temporarily stored in the vaporizing chamber. If injected at a rate enabling the vapors to be concurrently trans ferred into the column, large samples can be introduced into small chambers. Depending on the carrier gas flow rate and the volume of vapor created by a given volume of liquid, 1 JlL of sample would have to be injected within 5-20 s. This idea was a flop because it usually led to severe losses of high-boiling compounds inside the needle - it favors evaporation over ejection. n-C24 , for instance, was lost almost completely inside the needle (injector temperature, 250°C). Results from "dirty" samples were even worse, ow ing to the additional retentive power of the by-products ac cumulated at the point of sample evaporation in the needle. No results from slow injection are shown in Figure A 11, be cause they are highly dependent on whether the plunger was moved in small steps (each causing some violent evapora tion) or continuously and smoothly.
Wang et al. [71 observed evaporation from a 0.37 mm i.d. glass capillary heated in an oil bath, imitating a syringe nee dle. Water containing a red dye was introduced at a ve locity of 1 cm/s (corresponding approximately to slow injec tion). At 120°C, water was expelled from the capillary with a vigorous pop, transporting the dye. At 155 and 200 °C, the water evaporated at the rear. The dye was deposited near the center of the capillary and colorless water left the device. Plugs of liquid sporadically moved the dye from the rear to the center of the heated capillary. The red dye is a substitute for the high-boiling sample com ponents and showed how slow injection can cause totalloss of solute material. Cool (or cold) needle injection, in earlier times the most com monly used method of manual injection, afforded consider ably better results than manual filled needle injection - only ca. 40 % of n-C44 was lost (Figure A 11). The liquid seems to be eluted more rapidly and violently, moderately favoring non-discriminatory ejection. The reproducibility of results obtained by manual cool nee dle injection is often rather poor. Losses in the needle are highly dependent on the speed of the injection process, be
29
5.3. Comparison of Needle Handling Techniques
Reproduction of Injection Speed
Results Depend on the Analyst
Relative Standard Deviations
cause the latter determines the needle temperature at the moment of sample introduction. If an easy-going and a nervous analyst both perform injec tions by this technique, the needle temperature at the mo ment of importance will be different and so will the results. With the slower procedure, the results are better, because ejection from the warmer needle is more violent. This ex plains why two persons injecting the same sample often obtain different results. The dependence of discrimination on the speed of injection is probably the main reason why an experienced analyst in jecting with a reproducible rhythm obtains the best re producibility. It might, however, happen even to him that the needle enters the septum with more difficulty than usual, or that the plunger does not move as freely as it should and he obtains runaway results. The relative standard deviations given in Table A2 were ob tained, from manual injections by an analyst who knew about the factors affecting reproducibility. There were, furthermore, no special problems, such as a new septum. Thus results could .easilv be worse. Needle volumes (7.1 cm needle, 0.9 Ill) were injected with an injector temperature of 350°C. Table A2 Relative standard deviations (%) for peak areas of n-alkanes normalized on n-C•• Split injections of needle volumes using different needle handling (n .. 8). (From [8]).
5.3.4. Hot Needle Injec tion
Injection method
C20
C32
C36
C44
Vaporizer cool needle hot needle solvent flush air plug On-column
1.7 1.0 2.1 2.9 0.7
12.5 1.2 4.7 3.0 0.9
11.0 1.1 5.7 3.0 0.7
10.6 1.1 7.6 3.4 0.8
Hot needle injection differs from the cool needle method in that the needle is pre-heated to the injector temperature be fore the plunger is depressed. The temperature of the nee dle approaches that of the surrounding injector within ca. 3 s [6]. Pre-heating for 3-5 s is, therefore, recommended. The plunger should be depressed as rapidly as possi ble, because a minimum amount of evaporation along the needle wall should eject as much of the sample as possible as a liquid. Explosive evaporation, particularly important in the rear of the needle, should expel most of the sample in the liquid state.
30
A 5. Syringe Needle Handling Minimizing Discrimination
Low Discrimination
Optimum Reproducibility
Speed of the Plunger
Hot needle injections resulted in the lowest discrimination of the methods tested. 23 % of the n-C44 was recovered by re-injection (needle rinse), which, although far from negligi ble, was the best that could be achieved for a needle volume and the given injector (temperature gradient to the septum cap). Reproducibility was far better than for the alternative needle handling techniques tested (Table A2). This is because of the reproducible needle temperature when the plunger is depressed. The speed of needle introduction is not impor tant. The results are, therefore, more easily reproduced by different persons. The only parameter found to contribute substantially to the standard deviation of the results was the speed with which the plunger was depressed. Optimum results cannot be obtained by use of syringes with distorted plungers which move only with difficulty. It has been found [8] that losses in the needle were smaller if the sample plug was withdrawn further back into the barrel than just out of the needle, obviously because the liquid en tered the needle at a higher speed when introduced with a run-ue. en
• •
z en
...." II
Z
J
z UI
5
~
S,
o-~
B
B
La..
2be).
1l1L
-'
'
164
Progr. 5°/min 100°
Figure A12 Analysis of mustard oils and a related nitrile from radishes. 15 m x 0.3 mm i.d. glass capillary column coated with an 0.08 ~m film of Pluronic L 64 (a polyglycoll; AFID in the N mode... 1 ~L" of a dichloromethane solution injected splitless by the hot needle technique into an injector at 225°C. S, internal standard; B, degradation products. With cold on column injection, no degradation products were observed. Vaporizing injection required careful optimization to find the injector temperature providing an acceptable compromise between high discrimination/standard deviation and severe degradation. (From [9], see also [10)).
5.3. Comparison of Needle Handling Techniques
Minimum Degradation of Labile Solutes
Pre-Peaks
3 1
The hot needle method minimizes degradation of labile solutes inside the needle. At first this might seem sur prising, because "hot needle" is inevitably associated with pyrolysis or roasting in a frying pan. The opening statement was, however, the result of a study on the optimization of a method for injecting mustard oils and related compounds from radishes into a vaporizing injector (see Figure A12). These sulfur-containing compounds degrade rapidly on hot metal surfaces, such as hot syringe needles. Hot needle injections proved superior to the alternatives, be cause most sample material leaves the needle in the liquid phase. Material ejected as a solution in a volatile sol vent neither touches the hot needle wall, nor is it heated above the solvent boiling point. The concept of hot needle injection assumes that an empty syringe needle is introduced into the injector. This is a sim plification, because a layer of sample liquid remains on the needle wall after the sample plug has been withdrawn into the barrel of the syringe. In reality, the hot needle tech niqueinvolves a double injection: the sample left in the nee dle, 0.02-0.1 ul., evaporates from the needle on insertion into the injector. After 3-5 s, when the plunger is depressed, it is followed by the bulk of the sample. A small pre-peak should, therefore, be expected some 3-5 s before the main peak (Fig ure A13). Main peak from depressing the plunger
Pre-peak from inserting the needle
J ~~'--------" '---------' Needle pre-heating, e.g. 3-5 s
Figure A13 Pre-peaks arising from hot needle injection: isothermal run after split injection.
When is it Observed?
Although initial bands are always split, pre-peaks are sel dom actually observed. 1 If the peak is broader than about 7 s, the small pre-peak is contained by the main peak (see last peak in Figure A13). 2 If temperature-programming is used, the two bands are recombined by cold trapping.
32
A 5. Syringe Needle Handling Minimizing Discrimination 3
In splitless injection reconcentration is needed to focus the broad initial band. This also combines the band re sulting from needle introduction with that from the main injection. In isothermal runs, solvent effects are used. Thus peak splitting is observed solely in the early part of isothermal runs after split injection.
Countermeasures
5.3.5. Solvent Flush Injection
Air Plug to Avoid Mixing
Concept Requires Cool Needle ...
Most applications showing this kind of peak splitting involve volatile components for which discrimination is anyway no problem. Thus pre-heating of the needle can be reduced or might be totally unnecessary. Pre-peaks can also be prevented by picking up ca. 0.2 ilL of pure solvent after the sample. When the liquid is withdrawn into the barrel, it is this pure solvent that coats the needle wall. Some autosamplers provide the option of injecting in this way (e.g. AS800 from CE Instruments). There are three arguments favoring the use of solvent flush injection. 1 . The name "solvent flush" suggests that at the end of the injection the needle is rinsed with solvent, trans ferring into the vaporizing chamber what would other . wise remain on the needle wall. 2 The plug of pure solvent elongates the plunger' such that the whole sample is pushed through the nee dle. Just solvent is left in the needle when the plunger reaches the bottom, i.e. final evaporation from the nee dle involves solvent only. 3 Only the volume of sample measured on the barrel of the syringe is injected, enabling introduction with accu rate measurement. The plugs of sample and solvent must be separated by a small plug of air to prevent mixing of the two liquids (Fig ure A14). Such mixing would occur primarily as a result of turbulence when the liquid passes from the narrow bore needle into the wider barrel. Keeping the plug of air short (0.2 Ill) facilitates withdrawal of the correct volume of sam
ple (small elastic gas volume).
Roeraade (11) showed that, despite the presence of the air
plug, rapid injection results in considerable mixing of the
liquids (some 15 % when a 1 III air plug separates 1 III plugs
of liquid): the film of sample in the air plug section carries
sample material into the flushing solvent. The sample mate
rial was mixed with more than 1 III of a 31ll volume offlush
ing solvent.
At first, the advantages of the solvent flush method seem beyond doubt, but a closer look revealed problems. Results remained puzzling [5,6). There are two options: 1 The solvent following the sample must touch the needle wall in order to rinse solute material from it,
5.3. Comparison of Needle Handling Techniques
33
Solvent flush injection Air plug Plunger
:
\ Flushing solvent
'SamPle
Air plug injection Sample Plunger
i
:
Air plug
Sandwich method Sample Plunger
( Flushing s"olvent
Figure A14 Arrangements of the plugs of sample. air. and flushing sol vent f~Jr three needle handling techniques.
but this is as difficult as cleaning a hot cooking plate with water. Wetting the needle wall with solvent presup poses that its temperature is reduced to the solvent boil ing point. 2 The sample does not evaporate during passage through the needle. Both require that the needle temperature is not far above the solvent boiling point; this calls for an injection performed as rapidly as possible - cool needle solvent flush injection.
...but Hot Needle Gives Better Results
Counterproductive Air Bubble
Volume of Flushing Solvent
Experiments with a mixture of n-alkanes (CWC44 ) in hexane produced the opposite result, however. When 1 ~L of sam ple and a needle volume (0.9 ~L) of solvent were injected, losses were ca. 40 % lower with the hot needle solvent flush method (injector at 250°C). The result suggests that the needle is too hot to be wetted even when injection is performed as rapidly as possible. Another puzzling result obtained with the same test sample was that the losses in the needle were nearly halved when there was no air bubble separating the sample from the flushing solvent - even though tests with a colored liq uid confirmed that then the two liquids were considerably mixed. This again casts doubt on the validity of the concept of the solvent flush method. If 1 ~L of sample and a needle volume of solvent were in jected into an injector at 250°C (a in Figure A15), nearly 40 % of the n-C40 and n-C44 was left inside the syringe needle eventhough it was a hot needle solvent flush injection. The result in (b) shows that the losses were almost halved
34
A 5. Syringe Needle Handling Minimizing Discrimination peak oreo [%]
peokall!O[%] 100
50
to 12
16
22
28
peak area[%)
40
44
alkane C.
peak areo [%] 100
50
50
to 12
16
22
28
34
40
44
alkane C.
Figure A15 losses of solute material in the syringe needle. determined for the same mixture of ... alkanes as used for Figure A10. Split injection (20:11; injector at 250°C. lower curves: peak areas from the first injection normalized to ",C,o. Hatched area: solute materia. recovered from the syringe needle by r8-injection. Averages from five experiments. ' al Hot needle solvent flush injection of 1 III and a needle volume (0.9 Illl of solvent. bl As al. but with 2 III of flushing solvent. cl Hot needle injection of 2 III of sample without added solvent. dl As b), but with the order of the plugs reversed: the sample flushed the pure solvent out of the needle! (From [5]).
when 2 III of flushing solvent were injected behind the 1 ul, of sample. As a rather typical side effect, the increased injection volume resulted in increased discrimination by other mechanisms (the upper curve now being up to 30 % below the 100 % line), such that the analytical result (that of the first injection) hardly improved. Sample Flushing out Solvent
Any remaining esteem in which the method might have been held was lost as a consequence of the result shown in (dl: the losses in the needle were practically identical whether the 2 III of flushing solvent was behind (b) or ahead (d) of the sample, i.e. were not increased when the sample flushed the solvent out instead of vice versa. One might speculate that this (strong) improvement com pared with the hot needle injection of merely a needle vol ume resulted from cooling of the needle surface by the evaporation ofthe preceding solvent. The sample might have entered the needle more easily, to be violently ejected shortly afterwards. The sandwich injection method uses solvent ahead of the sample. Is this the reason?
Solvent Flush versus Hot Needle
FigureA15c shows that hot needle injection of a volume of sample equal to the total volume of liquid introduced by solvent flush injection (1.9 IlLI results in lower losses in
5.3. Comparison of Needle Handling Techniques
35
side the needle than the solvent flush method (a). This is no longer surprising, bearing in mind that all the features of the solvent flush method had no effect, or even negative ef fects, and the order of solvent and sample plugs could be reversed without adverse consequences. In fact, hot needle injection was superior to hot needle solvent flush injection because the latter was still performed with an air plug. Rodriguez et al. [12] found that with an injector at 200°C losses in the needle were substantially greater when using the hot needle technique, but a 1 III injection was compared with solvent flush injection of twice as much liquid. Solvent Flush at Low Injector Temperatures?
It is possible that the solvent flush method is advantageous at low injector temperatures or for relatively high-boiling solvents: evaporation inside the needle might be of insufficient violence for effective hot needle injection; the solvent flush method is more likely to fulfil expecta tions, because the sample passes through the nee dle with less evaporation and the solvent might re ally have some flushing action. Try and check by the needle rinse method!
Reproducibility
Relative standard deviations of results from injections per formed by the classical cool needle solvent flush method were several times higher than those from the hot needle method (Table A2). This can be explained by the poorly reproducible needle temperature at the moment of injection and the (poorly understood) influence of the air bubble.
Poor Suitability for Splitless Injection
When evaluating the solvent flush technique, it is important to consider also other aspects. Splitless injection is used if high sensitivity is important. The volume of liquid which can be introduced without overfilling the injector liner is limited. If the solvent flush method is used, the flushing solvent takes away at least half of it (and of the sensitivity other wise achieved). Another drawback of the solvent flush method in splitless injection is the tendency of the vapor of the flushing sol vent to displace the sample vapor (which enters the in jector first) from the column entrance into the upper part of the injector. If transfer of the sample vapor to the column is incomplete, it is paradoxical to introduce the vapor of the flushing solvent into the column preferentially. If the injector is overfilled, it is, moreover, primarily the sample which is flushed through the septum purge.
Split Injection: Circumvented Dilution
When using split injection, the analyst is usually not inter ested in high sensitivity. Even the opposite may apply - he wants to inject as little as possible. For reasons discussed in Section A9, plunger-in-needle syringes should be avoided for samples tending to evaporate inside the needle and sam ples containing high-boiling components. The use of 10 III
36
A 5. Syringe Needle Handling Minimizing Discrimination syringes with the hot needle method implies, however, work ing with sample volumes corresponding at least to the nee dle volume and preferably to "0.5 ~L" or even" 1 ~L", i.e. ca. 1.5-2 ~L (Section A6). The solvent flush technique enables injection of sample vol umes as small as 0.2 III (limited only by the readability of the scale on the syringe) behind a larger plug of flushing solvent. Instead of adding more solvent to the sample in the vial, the additional solvent is picked up with the syringe.
High Boiling Flushing Solvents
High boiling solvents provide more efficient flushing of the needle, because they wet the needle surface more eas ily. The possibility of using these depends, however, on the sample and the solutes to be separated from the solvent. Recondensation in the column inlet might, furthermore, se verely affect the split ratio. Distinction must be made between high-boiling solvents which are still expelled from the syringe needle and even higher-boiling solvents which essentially remain therein. The former rinse the solute material from the, needle wall into the injector, whereas the latter have a flushing effect only if their volume exceeds that of the nee dle.
n-Octsne Compared with Pentane
As shown in Figure A 16, discrimination arising from losses' in the syringe needle was nearly halved by use of n-octane (b.p. 126 ec) rather than pentane (b.p, 36 "C) as a flushing solvent behind a sample dissolved in hexane (injector tem perature, 250°C; split injection, needle volume of flushing solvent).
Problems with High-Boiling Sample Solvents
Schomburg et al. [13] advocated the use of high-boiling sol vents to reduce or eliminate discrimination. This advice was rarely followed, presumably for practical reasons: high-boil ing solvents are seldom sufficiently clean and of limited suit ability for sample preparation, because sample reconcen tration by solvent evaporation is impossible. When used solely as a flushing solvent, however, no reconcentration is needed. peak area [%J
peak area [% J
lool---aZZU';'7;"
50
50
to 12
16
22
28
34
40
alkane
44
e.
Figure A16 Cool needle solvent flush injections of n-alkanes in hexane (1 ~LI, comparing n-pentane (al and n-octane (bl as flushing solvents (needle volumes, 0.9 ~LI. (From [5]).
5.3. Comparison of Needle Handling Techniques
37
5.3.6. Ai' Plug Injection
It is a severe drawback of the solvent flush method that al most 1 ul, of solvent (and the impurities therein) must be injected merely to reduce losses inside the needle. If the plug of flushing solvent is just an elongation of the plunger into the needle, an obvious idea would be to use a plug of air instead of solvent (Figure A 14). Air has no rinsing effect, but rinsing of a hot needle wall with solvent seems, anyway, illusory.
Method
Air plug injection is performed by starting to suck sample liquid into the syringe with the plunger at a position of ca. 1 ul., i.e. with some 2 ul, of air between the plunger and the sample. The plunger is not moved up and down, as is other wise normal. The needle is withdrawn from the liquid when the rear meniscus reaches the required mark. The liquid must be withdrawn from the needle into the bar rel of the syringe, because otherwise it is easily lost. Upon warming, the air plug (saturated with solvent vapor) expands. The plunger is depressed as rapidly as possible to mini mize evaporation during passage of the sample through the syringe needle.
Severe Discrimination
The discrimination determined with the air plug method was greater than that with cool needle injection. After in jection, some 0.1-0.2 ul, of liquid were usually observed to cling to the (initially dry) plunger, suggesting that the air plug was not sufficiently effective at moving the sample. Evapo ration during passage through the syringe needle might cre ate such pressure that the air plug is compressed and liquid driven back to the plunger.
5.3.7. Sandwich Injec tion
The sandwich method is well known in packed column GC. The sample plug is located between two plugs of solvent, each separated from the sample plug by a short plug of air (Figure A 14). On injection, a plug of solvent passes through the needle first, maybe to cool the needle surface, fol lowed by the sample. The second plug of solvent is supposed to serve as an elongation of the plunger into the needle and for flushing the needle.
Large Volume of Liquid
Adaptation of the sandwich method to capillary GC is hin dered by the inevitably large volume of liquid which must, as a consequence, be injected. The two plugs of solvent usu ally contribute 2 ut, to the total sample volume, which is al ready nearthe maximum compatible with splitless injection. Considering the volume of the vapor cloud, larger sample volumes are tolerable for split injection. It is, however, gen erally observed that other deviations are then accentuated.
5.4. Heating the Needle after Injection?
Is it expedient to leave the syringe needle in the injec tor for a certain time after the plunger has been depressed to improve the elution of the solute material from the nee
38
A 5. Syringe Needle Handling Minimizing Discrimination
dle? The answers generally given range from "important" to "useless" or even "bad". No Improvement for Volatile Solvents...
The discrimination curves in Figure A 11 were little affected. When the filled needle technique was used, losses of solute material were slightly reduced when the needle was with drawn after waiting for 1 s, but no such differences were observed for the cool or the hot needle method. Cool needle injection resulted in the same relatively strong discrimination even when the needle was left in the injector throughout the whole run, giving the high-boiling solutes more than 15 min to be eluted and recombined with the bulk of the solute material by cold trapping .
...but for High-Boiling Solvents
With some higher boiling solvents and/or lower injector tem peratures, however, noticeably reduced losses of high-boil ing solute material were observed when the needle was heated for 1-3 s after injection. The evaporation process ob viously takes longer.
Solvent Vapor as Carrier
Solutes cannot leave the needle by expansion of their vol ume during evaporation. 10 ng of solute material, for in stance, forms a vapor cloud which is a thousand times smaller than the internal volume of the needle. Trou- ' blesome solutes, furthermore, evaporate to a small extent only (low vapor pressure at the needle temperature). Solute vapor must, therefore, be flushed from the needle by other vapor serving as a carrier.
Until the End of Solvent Evaporation
The most abundant carrier available is vaporized solvent even if merely 0.1 III of solvent evaporates behind the de posited solute, it creates a volume of vapor which flushes the needle volume ca. 10-50 times. When solvent evapo ration in the needle ceases, however, because the sol vent is exhausted or because some of it remains in the cool rear of the needle, elution of solute material essentially ends and there is no longer any reason to keep the needle in the injector.
5.5. Effect of Injecting Air
Most injection methods proposed involve withdrawal of the sample liquid into the barrel of the syringe, which means sucking up several microliters of air and injecting it with the sample. A further (maybe even larger) amount of air is dissolved in the sample liquid. Surprisingly little has been done to check possible negative effects of this air.
Concentration in the Carrier Gas
Mixed with the carrier gas inside the injector, the air injected together with a liquid sample reaches a concentration of 0.2 0.5 %. This is far more than generally considered tolerable in the carrier gas (a few ppm). During the first part of the analysis, the sample is in contact with maybe 10 ml of carrier gas. Injected in splitless mode the air carried into the column with the sample builds up an
5.5. Effect of Injecting Air
39
average concentration of about 200-500 ppm, about 100 times more than in high-grade carrier gas. 2 III of air con tains some 600 ng oxygen, i.e. theoretically more than enough to oxidize the components of interest. Is it reasonable to invest into traps in the carrier gas supply line to remove the last traces of oxygen and humidity when the sample introduces 10-100 times more? Headspace Analysis
Classical headspace analysis introduces even 100-1000 times more air into the injector. As injection usually involves splitting, 10-100 III of air reaches the column, representing concentrations in the percentage range. Fortunately tem peratures are usually low - injector temperatures seldom need to be above 100°C and column temperatures during injection are even lower.
5.5. 1. Concern. Regard ing the Column
Air can damage the stationary phase of the column. Every beginner knows this and is careful about selecting a suffi ciently clean carrier gas. Again, little has been done to deter mine the real requirements. Probably large sums of money are paid for a purity which is of no use.
Carbowax
Carbowax or FFAP columns are sensitive to air even at mod erately high temperatures. When filled with air, e.g. while lying around on an instrument, a few hours at 40-50 °C, par ticularly in the light, may be sufficient to cause extremely high bleed. This bleed indicates the beginning of a self-sup porting oxidation process that cannot usually be stopped; there is then no way to save the column. In contrast with this it should be stated that nobody has reported that headspace injections at around 100°C have demeged a Carbowax column. Nor have injections of liquid samples at higher temperatures. This does not rule out accelerated aging, but there is no experimental evidence identifying the various factors causing normal column dete rioration.
Silicone Stationary Phases
Columns with silicone stationary phases of low polarity have been used with air as carrier gas (actually non-purified, humid air from a compressor) for several months (for test ing purposes - air is as poorly suited as nitrogen for capil lary GC). The column was heated to 350°C over dozens of hours. The bleed was higher and the stationary phase be came lacquered somewhat sooner than usual, but no spec tacular column degradation was observed.
5.5.2. Detector.
Detectors like ECD or MS are sensitive to air. In fact, the per formance of ECDs deteriorated somewhat after frequent use for headspace analysis. particularly when the split ratio was low. Nevertheless, no special precautions usually are taken.
5.5.3. Oxidized Sample
In contrast with the column, little attention has been paid to oxidation of the sample. In fact, triglyceride analysis with
40
A 5. Syringe Needle Handling Minimizing Discrimination air as carrier gas was not hindered by column degradation, but by oxidation of unsaturated fatty acids. Trilinoleate was totally lost.
Trilinoleete
The experimental set-up enabled switching between air and hydrogen as carrier gas. Most interestingly, little trilinoleate was lost when the carrier gas consisted of air during analy sis up to 350°C as long as hydrogen was used during injec tion, but most trilinoleate was degraded when air was the carrier gas during the 1-2 min of injection and solvent evaporation. It was introduced on-column as a solution in tridecane at a column temperature of 200°C. These are gen tle conditions compared with the alternative, split injection at an injector temperature approaching 400 °C.
Dependence on Concentra Oxidation is a radical chain reaction. The solvent vapors tion supported this reaction and caused the mixture to "catch fire". During chromatography, the concentration ofthe readily oxidizable material is too low (silicone resists oxidation well), except when a sufficiently large amount of solute material was injected. Check for Solute Losses
This experiment generated more questions than it answered. The real danger seemed to be loss of solute material by oxi- . dation in a vapor phase supporting radical reactions. The
vaporizing chamber of hot injectors is a particularly peak area ["10] 100
~~~
50
50
to 12
t6
22
28
40
44
alkare CJ peak area ["!oj
peak area ["!o) lOOt-~~_~_
lOO.--_-'Qo___
50
50
to
'2
16
22
28
40
44
alkane CJ
Figure A17 Comperison of solute losses in the needle for ..0 ~L" (e end blend ..2 ~L" (c end d) injections using the cool needle (e end c) end hot needle (b end dl techniques. Injector et 250°C. Differ ences between needle hendling methods become smell if the semple volume exceeds ebout ••1 ~L". (From ref. [5]).
5.5. Effect of Injecting Air
4 1
dangerous zone - together with the air there is a high con centration of solvent and solute material and the tempera ture is high. Solvents such as isoalkanes support radical re actions more than others (e.g. toluene), i.e. the sample sol vent could well be even more important than the tempera ture. Peroxides?
No such effect is mentioned in literature - either because it never occurs or, more likely, because nobody has investi gated it. There is a related subject that has not been deeply investigated: peroxides in solvents. Diethyl ether and tetra hydrofuran often contain high concentrations of peroxides. Alkanes contain far less, but concentrations in hexane might still approach 1 ppm. Considering the nature of the chain reaction, this could be sufficient to severely affect the sam ple.
6. Dependence of Discrimination on Sample Volume The results discussed above were obtained by injecting nee dle volumes of sample. They are pessimistic because losses and discrimination are considerably reduced upon in jection of larger sample volumes. 6.1. Experimental Re sults
Figure A17 compares "0 Ill" and "2 Ill" cool and hot nee dle split injections of ClO-C44 n-alkanes in hexane (71 mm needle, 0.9 III internal volume). When only a needle volume was injected, the loss of n-C22 inside the needle by cool nee dle injection (ca. 50 %) was at least four times higher than by hot needle injection. For the C3o-C 44 n-alkanes, the difference amounted to a factor of two.
Losses Decrease with Increasing Volume
As the sample volume was roughly doubled from needle volume to "1 u],", the relative loss of solute material inside the syringe needle decreased substantially. For hot needle injection, loss of n-C22 decreased from 13 % ("0 Ill", Figure A17b) to 3 % ("1 Ill", Figure A15c), that of n-C34 from 42 to 12 %, and that of n-C40 from 50 to 28 %. The relative loss of n C44 remained about constant, however. As shown by the results for "2 Ill" hot needle injection in Figure A17d, increasing the sample volume from "1 j.lL" to "2 u]," no longer resulted in significant improve ment.
Difference between Cool and Hot Needle
Figure A 17 also shows that differences between cool and hot needle injection are no longer significant when "2 j.lL" are injected. Cooling of the needle surface by pas
42
A 6. Dependence of Discrimination on Sample Volume sage of the liquid might be so effective that temperature dif ferences at the beginning of the injection are no longer im portant.
Sample Volumes of "0.5"-"1 j1L"
The greatest reduction of losses in the needle, i.e. of dis crimination, is achieved by increasing the sample volume from "0" to "0.5 IiL". An increase to "1 IiL" provides a fur ther significant improvement. Beyond "1 IiL", the gain is small and is often overridden by other, rapidly growing prob lems. In Figure A17, involving split injection, discrimination resulting from mechanisms other than losses inside the needle reached 20-30 % for "2 IiL" sample volumes; for hot needle injection, this almost offset the improvement brought about by reduction of losses in the needle.
6.2. Discussion of Mechanism
Semiquantitative estimates enable us to obtain further infor mation about what happens inside the syringe needle. As a working model, it is assumed that a "1 IiL" injection com prises two steps, viz. mechanical displacement of a 1 IiL vol ume through the needle and introduction of a similar vol ume into the needle followed by ejection or evaporation therefrom.
Calculated Losses for each Step
The losses of solute material during passage through the needle (i.e. forthe first microliter) can be estimated from the results obtained by solvent flush injection of a 1 IiL volume of sample ahead of a needle volume (ca. 1 IiL) of solvent (Figure A 15a). The losses during the second step are com pared with those observed on injection of a needle volume (Figure A17). To facilitate the comparison, relative losses are transformed into absolute amounts. In Table A3 they are expressed in terms of sample volumes containing a corresponding amount of solute. The sum of the first two columns, the losses expected from the two steps, far exceed those actually ob served for the" 1 IiL" injection (last column).
Smaller Loss for Second Step
There is no reason to assume that losses during the first step (passage through the syringe needle) should be different, depending upon whether the sample is followed by pure solvent (solvent flush injection) or by more sample ("1 IiL" injection). The difference between observed and expected losses can, therefore, be explained only in terms of smaller losses during the second step, i.e. the elution from the needle after the plunger reached the bottom. According to the data, up to n-C34 the second step proceeds without any losses. In absolute terms, losses during the "1 IiL" hot needle injection are equal to (actually insignificantly lower than) those during the "0 u]," injection.
Temporary Cooling of the Needle Surface
The small losses during the second step of injection could be explained by temporary cooling of the internal surface of the needle by partial evaporation of the most advanced sam
6.2. Discussion of Mechanism Table A3 Losses of solute material, expressed as sample volumes amounts.
(~L)
43
containing the corresponding
n-Alkane
1 ~L = ,,0 ~L" Hot needle
1 ~L + 1 ~L Solvent flush
2 ~L = ,,1 ~L" Expected
Hot needle Observed
C22 C28 C34 C40 C44
0.10 0.22 0.42 0.50 0.45
0.10 0.20 0.22 0.35 0.35
0.20 0.40 0.64 0.85 0.80
0.08 0.20 0.22 0.55 0.45
pie material. Such cooling could enable the following liquid to pass through or enter the needle without much evapora tion; a moment later, re-heating of the needle surface results in violent expulsion of most of the sample in the liquid phase. Arguments in Favor of Solvent ahead of Sample
If losses occur primarily during entrance of the first liquid into the needle, this favors positioning of solvent ahead of the sample plug and is evidence in favor of the sandwich rather than the solvent flush method. The same logic might also explain why "solvent flush" injection with the sequence of solvent and sample plug reversed (Figure A 15d) produced results similar to those obtained by the regular solvent flush method.
6.3. Conclusions
The experiments suggest two conclusions. 1 Unless evaporation inside the needle can be suppressed, at least "1 ~L" should be injected; the gain from increas ing to "2 ~L" is small. 2 As losses occur primarily when the first of the sample liquid enters the needle, solvent ahead of the sample liquid (i.e. drawn into the syringe after the sample) might be more useful than solvent behind the sample ("sol vent flush"). As injection of more than ca. "2 ~L" of liquid should gener ally be avoided, however, the possibilities of co-inject ing solvent are severely restricted.
7. Solvent and Solutes The solvent influences the evaporation process inside the syringe. Should it be volatile or high boiling? At this point we do not consider solvents boiling so high that evapora tion in the needle can be suppressed.
44
A 7. Solvent and Solutes
7.1. Volatility of the Solvent
As. shown in Table A4, hot needle injection produced re sults with no significant difference whether the sample was dissolved in n-pentane (b.p. 36°C), n-heptane (b.p. 99°C), or n-nonane (b.p. 151°C). With the filled needle technique, however, the higher boiling solvent clearly resulted in less discrimination (although still morethan hot needle injection). Table A4 Relative peak areas of alkanes, normalized with respect to n-nonane or n-dodecane (%1, comparing various solvents; hot needle or filled needle injections of needle volumes; injec tor at 300 °C. (From ref. [6]).
Hot Needle Solvent C20 n-Pentane n-Heptane n-Nonane
C44
80.2 83.6 84.1
67.9 75.1 72.3
Sample component C36 C32
C44
99.7 102.6 101.3
Filled Needle Solvent C20 n-Pentane n-Heptane n-Nonane
Sample component C32 C36
94.3 96.4 100.2
84.0 85.1 82.7
68.6 75.1 97.1
62.4 61.8 72.3
21.2 26.1 53.2
Tentative Explanation
Losses in the syringe needle depend on the ratio of evapo rated and expelled sample. Volatile solvents evaporate more readily and should be inferior in this respect; they do, how ever, also evaporate more violently, with a tendency to expel a larger proportion of the sample. Apparently, the two fac tors just about balance each other such that there is surpris ingly little difference between solvents of different volatility. Experience from practice largely confirms this, but there were also exceptions.
7.2. Type of Solute
All experiments discussed above were performed with alkanes as solutes. Other types of solute of comparable volatility are lost in different proportions, surprisingly to an extent which is often considerably lower. Losses of triglycerides (tri-C,o to tri-C'B) were between 20 and 28 %, in another instrument only 12 to 17 % (injection of needle vol umes; hot needle method at an injector temperature of 400 °C [14]). These losses amounted to hardly half those expected for n-alkanes of similar boiling point. No systematic comparison has been made, nor are there ex planations or conclusions.
7.3. Adsorption in the Syringe Needle
45
7.3. Adsorption in the Syringe Needle
If peaks are too small and the possibility of adsorption in the column is excluded, the injector is commonly blamed for the losses. Often this is true, but the losses arise from adsorp tion inside the syringe needle more often than is recognized. The sample comes into closer contact with the needle wall than, e.g., the wall of the injector liner.
Influence of Solvent Polarity - a Case Story
Le Bel and Williams [151 thoroughly studied a case which is probably relevant to a wide range of analyses. They encoun tered problems in the quantitative analysis of dimethoete and beta-phosphamidon (two pesticides) when injecting solutions in hexane by the solvent flush method. When a few nanograms ofthe compounds were introduced, only 64 and 43 % were recovered at the detector. The losses de creased when larger amounts were injected - behavior typical of adsorption.
Needle Rinse with Hexane and Acetone
After injection of a hexane solution, a needle rinse injec tion with hexane revealed no solute material from the need_e. When the needle rinse injection was repeated with acetone, however, using the same or a different column from that used for the sample, the missing solute material was recovered (Figure A18). When the sample in hexane was followed by acetone using another, clean syringe, no solute material was detected. This tells us that needle rinse analy sis produces a false negative result ifthe solvent is unable to desorb the solute material from the wall (or a layer of con taminants on it).
...
c
8
Ul
z
A
0
e,
...a: Ul
a:
...u ...w... 0
0
'"
~
10
5
o
10
5
RETENTION TIME
0
10
0
(min)
Figure A1S 4 ng dimethoate and S ng beta-phosphamidon in hexane in jected on to a packed column by the solvent flush method. A: hexane as flushing solvent; only about half of the solute material is detected. B: needle rinse injection with hexane does not recover the missing material. C: subsequent needle rinse injection with acetone. (From Le Beland Williama(5)).
46
A 7. Solvent and Solutes
Sample Solvent Avoiding Adsorption
This example demonstrates the importance of adsorption inside the syringe and choosing an appropriate solvent. This choice is, however, often restricted by sample preparation. LeBel and Williams solved their problem by a solvent flush injection with acetone as flushing solvent behind the sam ple still in hexane.
Adsorption Suppressors Another Case Story
Brotel/[16] described problems with the analysis of tertiary amines (packed column GC).The pentafluoro ethers of pen tazocine and ketobemidone were almost completely lost when injected after the syringe had been washed with metha nol. He assumed the source of the problem was adsorption of the compounds on the glass surface of the syringe barrel.
Silylating the Syringe?
Silylation of the glass barrel resulted in only slight improve ment. Numerous other analysts attempted to deactivate the syringe, but it seems that it has never been successful. The efficiency with which a syringe can be silylated is, how ever, anyway limited, because syringes should not be heated above 60-80 "C, Deactivation would, furthermore, be effec tive for the glass barrel only, while the needle is the more probable site of adsorption or degradation.
Sandwich Injection
losses were prevented by adding a large excess of an ad~ sorption suppressor, desipramine. The sandwich injection method was used with 2 III plugs of n-heptane containing 0.2 % desipramine on each side of a 5 III plug of sample (packed column GCI).
Injection Speed
Brotell also observed that without an adsorption surpressor, rapid and slow (10 s) injection resulted in higher losses than injection performed in ca. 4 s (0.5 s/Ill). When the adsorption suppressor was used for non-adsorptive solutes, no such effects were noted. He cites other authors who made similar observations. It remained unclear, however, whether the effects resulted from the syringe, the injector, or even the detector.
7.4. "Memory Effects" Arising from the Syringe
Some solutes are strongly adsorbed by or otherwise retained inside the syringe. This not only causes losses of solute ma terial for the on-going analysis, but is also responsible for "memory effects" and unsatisfactory blanks, because part of the lost material is likely to be transferred to subsequent injections. Horning's group [17] reported an analysis in which a set of syringes had to be used for different concentra tion ranges, because the adsorbed material could not be sat isfactorily removed. We had a similar experience with triphenylphosphine oxide or 2-oxazolidinone.
Misleading Blanks
"Memory effects" create the danger of false-positive r. suits. Blank tests are misleading when "memory effects" are absent or negligibly small upon injection of pure solvent, but strong for the real sample injected subsequently. Sam
7.4. "Memory Effects" Arising from the Syringe
47
pie material obviously displaces adsorbed material better than does the solvent. This is related to the effect mentioned above, i.e. needle rinse with hexane did not re veal loss inside the needle whereas acetone caused the ma terial to be transferred. Addition of a few percent of a polar solvent or a component with adsorptive functional groups to the sample might help the problem. Needle Attachment as a Cause of "Memory Effects"
Solute material may diffuse into dead volumes or fittings in the zone in which either fixed needles are fitted to the barrel of the syringe with cement or removable needles are sealed with plastic material. The extent of such diffusion depends on contact time - large amounts of solute material can dif fuse into the needle attachment if the syringe still contains sample when put aside after an injection. To overcome such problems, it is recommended that sol vent be sucked into the syringe and positioned in the region of needle attachment immediately after an injec tion. In this manner, solute material diffuses out of, rather than into, dead volumes or plastic components.
8. Injector Temperature 8.1. Imposed Tempera ture
The optimum injector temperature is determined by many factors. Here we restrict ourselves to aspects concerning transfer from the needle and to samples and conditions for which evaporation in the syringe needle cannot be prevented. By "imposed" injector temperature we mean the ther mostatted temperature given in the readout of the instru ment. As injectors are cooler at the top (septum cap) and toward the oven, real temperatures can differ substantially, particularly in the region surrounding the needle.
High Temperatures Substantially Reduce Discrimination ...
Table A5 shows the influence of the imposed injector tem perature on discrimination of the previously discussed mix ture of C9-C44 n-alkanes (Carlo Erba 4150 instrument). Dis crimination is strongly reduced when the injector tempera ture is increased.
... but Do Not Eliminate It
The results also show, on the other hand, that substantial discrimination remains even when extremely high injector temperatures are used. Even at 400°C, 6 % of n-C26 was lost compared with n-Cg (not shown in Table A5), and 23 % of n C44 • Discrimination against n-C26 was not much greater at only 275°C (8 %1. whereas that against n-C44 increased to 72 %. The data suggest that for each compound there is an upper temperature limit beyond which discrimination cannot be further reduced.
48
A 8. Injector Temperature Table A5
Influence of the imposed injector temperature on discrimi
netion egainst higher boiling ... elkenes. Hot needle split in
jection of needle volumes (0.9 Ill). Peek erees normelized to
n-C. (= 100 %1. (From ref. [6]).
Injector temp. [OC] 250 275 300 350 400
Relative peak areas C32 C36 C20 100 102.4 101.2 102.7 100.5
65.9 85.9 85.8 86.0 86.2
41.6 72.1 83.6 83.5 85.1
C44 14.2 27.6 67.9 75.0 77.2
Effect on Reproducibility
The effect on reproducibility of increasing the injector tem perature is even more pronounced. The reproducibility of the results might be largely determined by the reproduc ibility of discriminative losses in the syringe needle. If they are reduced by increasing the injector temperature, they also contribute less to the standard deviation of the results. Increasing the injector temperature also reduces the impor tance of accidental influences, e.g. air bubbles or sites behaving like boiling stones, on evaporation process in the needle.
Some Data
As shown in Table A6, the relative standard deviation of normalized n-C44 peak areas was reduced from 50 % at 250 °C to 7.6 % at 300 °C and to 1 % at 350 °C. Probably more sur prising than that, high injector temperatures reduced rela tive standard deviations even for relatively volatile solutes, such as n-C20, indicating that the evaporation characteris tics of the sample as a whole and of the solvent in particu lar are just as important as the volatilization of the individual solutes.
Conclusion
The injector temperature should be set as high as the sample components tolerate. Even peak areas of rather volatile solutes are optimally reproduced only at high injec tor temperatures. n-C 20 , for instance, is analyzed more reproducibly at an injector temperature of at least 300 °C. The injection of samples in high-boiling solvents is an ex ception to this because evaporation inside the needle can be avoided when the injector temperature is kept low - pre supposing that this also suits the components to be analyzed.
8.2. Temperature Gradi ent Towards the Septum
The syringe needle must either remain cool enough to pre vent sample evaporation or be as hot as possible to approach complete transfer even of relatively high-boiling solutes. The former requires an injector head as cool as possible, the lat ter a high temperature along the entire length of the needle, including the rear part close to the barrel.
8.2. Temperature Gradient Towards the Septum
49
Table A6
Relative standard deviations obtained by hot needle split in
jection of needle volumes at different injector temperatures,
calculated from peak areas normalized relative to n-C•. (From
ref. [6]).
Injector temp.
Relative standard deviation [%]
lOCI
C20
C32
C36
C44
250
4.6 2.8 2.6 0.9
18
5.6 4.4
27 9.3 6.6
50 20
1.2
1.1
1.1
0.2
0.4
0.8
0.8
275 300 350 400
B.2. 1. Critical Rear of
Needle
7.6
The syringe needle is a dead volume. A higher vapor pres sure is, therefore, needed to elute the solute material from the rear of the needle than is required for evaporation inside the injector. If sample evaporation occurs inside the needle,
the temperature of the region of the injector respon sible for heating the rear part of the needle, hence of the injector head (Figure A19), is particularly critical. Seen from this angle, the temperature of the top of the injector should even exceed that of its center. In reality, profiles are the other way around, however.
1
Syringe
Septum
Temperature determining the elution from the syringe needle
~
Dead volume
Temperature determining the evaporation of the sample
Rinsed volume
Column
II
Figure A19 Temperatures at the top and in the center of the injector determine different processes.
Cooler Septa
The call for a hot injector head conflicts with restrictions concerning the septum. Essentially consisting of silicone rubber, septa become soft at temperatures above 250-300 °C.
50
A 8. Injector Temperature For this reason, earlier instruments had septum caps equipped with cooling shells to accentuate the temperature drop towards the septum.
8.2.2. Actual Tempera ture Profiles
The actual temperature in different regions of the injector depends on the construction, in particular on the design of the heating block. The injector body, made of stainless steel, a rather poor thermal conductor, is seated in a heating block which contains the heating cartridges and the thermocouple serving for thermoregulation (Figure A20).
Syringe
Healing bloc Healing cartridge
Figure A20
Typical heating system for vaporizing injectors.
Thermocouple
The thermocouple also measures the "injector tempera ture" given on the display. It must be positioned close to the heating cartridges to prevent overheating and oscillat ing temperatures, but this has two consequences: 1 On heating the injector, the vaporizing chamber and par ticularly the injector head reach their temperatures only substantially after the readout shows the set value. Hence more time is needed than is suggested by the display. 2 The readout gives a higher temperature than is reached by the parts projecting from the heating block.
Two Examples
Hewlett-Packard [181 reported the temperature profile along the axis of the vaporizing injector of their 5890 gas chroma tograph for a setting of 350 DC. The septum cap was at merely 140 DC, and only the needle tip reached into the zone thermo statted at the temperature indicated by the display (Figure E11). This injector was designed for the fast autosampler.
8.2. Temperature Gradient Towards the Septum
5 1
Figure A21 shows analogous profiles through the injector with, probably, the most constant temperature (CE In struments, 8000 series to TRACE). the heating block also set at 350°C. The injector temperature is close to the regulated value for a length of over 5 cm. This is achieved by use of a heating block which is as long as the injector body. 150
200
250
300
350
top heated
E oS
top unheated
E 20 :J
C. CI)
(/J
E 40
g
CI)
0
c:
nI
iii 60
0
80
100
150
200
250
300
350
Measured temperature 1°C)
Figure A21 Temperature profile through the vaporizing injector of the CE Instrument thermoBtatted at 350°C; temperatures corre spond to the positions in the injector drawn at the right. The top region of the injector can be heated by an extension of the heating block and additional insulation.
Variable Heating of the Injector Head
The temperature of the injector head can be varied. If the septum cap is exposed to ambient air, the septum tempera ture is at ca. 220°C (imposed injector temperature, 350 "C). Alternatively, the heating block can be extended to the top of the injector and the septum cap insulated, which increases the septum temperature to nearly 300°C. This de sign maintains the septum below 300 °C when the injector is thermostatted at an extremely high temperature, whereas a rather straight temperature profile can be achieved at lower settings.
8.2.3. Effect on Discrimi nation
The effect on discrimination of various temperature drops towards the septum resulting from losses in the nee dle was studied with an injector heated by an aluminum heat ing block only 3 cm high and positioned some 5 mm above
52
A 8. Injector Temperature
the bottom ofthe vaporizing chamber [191.The temperature of the top of the injector was varied by the following means: Test Configurations
A)
the injector body above the heating block exposed to ambient air without any insulation; B) insulation with a PTFE ring, 4 cm high and 8 mm thick, but the injector head still exposed to ambient air; C) the whole injector, including the septum cap, packed in a large amount of glass wool; D) the top of the injector heated to the injector tempera ture by means of heating tape. On setting the injector temperature to 300°C, the profiles given in Figure A22 were obtained. Because the tempera ture inside the injector could not be determined for configu rations (C) and (D), only that of the septum is given.
300
__0
_ ------:---
200
100
........--
'---
.
i"
,--~-----.------~
2
3
5
7.5
[em] from septum Figure AZZ Temperature gradients in a vaporizing injector for which dis crimination curves are shown in Figure AZ3. Positions meas ured from the septum cap downwards into the vaporizing chamber as far as the distance reached bV the svringe nee dle (71 mm). The heating block, thermostatted at 300 °e, was located between 6.5 and 9.5 cm below the septum. (From ref. (19]).
Resulting Discrimination Curves
Discrimination was determined by means of a test mixture containing equal amounts of CWC44 n-alkanes in hexane. Needle volumes were injected by the split technique, the hot needle method, and a 71 mm needle. The mean relative peak areas obtained are shown in Figure A23. Needle rinse injections confirmed that discrimination was almost exclusively a result of losses inside the needle. Temperature profile A with a septum at about 80°C resulted in 27 % loss for n-Cn and a loss of 90 % for ,..C44 . Profile
8.2. Temperature Gradient Towards the Septum
53
B (septum at 157°C) led to greatly improved transfer from the needle. With the injector (and the syringe needle) ther mostatted at 300°C over its whole length (D), merely some 10 % of n-C28 and 20 % of n-C44 were lost. relative peak area 100
80
B
60
40
20 A
() 12
16
22
28
34
40 " alkane
C.
Figure A23
Peak areas normalized relative to n-C,o' obtained bV hot nee
dle split injection into an injector set at 300°C; results for
the temperature profiles A-D in the upper part of the injec
tor according to Figure A22). (From ref. [19]).
Independent of Needle Length
With cool needle injection, differences were even more pro nounced than shown for the hot needle method (19). losses inside the needle were similar, irrespective of whether the length of the syringe needle was 38,51, or 71 mm (con stant injection volume of 0.9 Ill). This confirms that most of the losses occurred in the rear, i.e. the part heated inside the injector cap.
8.2.4. Quantitative Results Differing from One Injector to Another
The reader might have noticed that discrimination against n-C44 differed considerably between Figure A 17 and Table A5, although conditions, including the nominal injector tem perature (250°C), were identical. The two injectors (of iden tical geometry, Carlo Erba/CE Instruments 2000 and 4000 Series) were heated by differently shaped heating blocks. The 85 % loss (Table A5) was obtained with a block only about 3 cm in height, positioned near the bottom of the vaporizing chamber. With the extended heating block, the loss was reduced to 50 %.
Difference between Injectors
Some heating blocks have a height of merely 3-4 cm whereas others are as long as the injector body, minimizing tempera ture gradients towards the top and the bottom of the injec tor. This is one reason why injectors from different manufac turers or in instruments of different series will seldom have
54
A 8. Injector Temperature
the same real temperature - no surprise that they pro duce different results!
8.2.5. Conclusions
2
Losses inside the needle can be substantially re duced by thoroughly heating the injector up to the septum. Relative standard deviations are lowered even more dramatically. Even with an optimally heated injector, losses inside the needle cannot be completely avoided.
What is Really Optimized?
Some analysts carefully optimize injector temperatures for given applications - but which temperature do they really optimize: that in the vaporizing chamber orthat atthe rear of the syringe needle? This determines whether the optimum found has a more general value, e.g. is transferable to other instruments. When it is taken into account that experimen tal optimization of the injector temperature is. in re ality. often an optimization of the needle temperature, strange situations are likely to be frequent.
High Injector Temperature to Achieve Warm Septum Cap
Perhaps an injector temperature of 400°C is found to pro duce the best results. The analyst might not be aware that this extremely high temperature was needed simply because this was the only way to heat the injector head to, say, 200°C. It is still more disconcerting to realize that often cool needle injection is applied, not even fully exploiting the 200°C achieved with such difficulty, l.e. that the 400 °C "injector temperature" was required to achieve a needle temperature of maybe 150°C. A hot needle injection into an injector homogeneously heated at 150 °C might. therefore. provide equally good results.
Reporting Injector Tempera tures
In the description of analytical methods, the injector tem perature is regarded as important information. Reported in jector temperatures are of limited usefulness, however, be cause they refer to the center of the vaporizing chamber only. It would be useful to add at least the easily measurable tem perature of the septum. As the temperature profile of the injector cannot be described in a method, the injector must be specified. Commonly the instrument manufacturer and the model ofthe gas chro matograph are indicated. This is not fully satisfactory, how ever, because, on the one hand, the same injector is usually mounted on several instrument models, and, on the other hand, parts like the heating system might be changed dur ing production of a model without the user being aware of it.
8.2. Temperature Gradient Towards the Septum
On the Illusion of Rapid Evaluation of GC Instru ments
55
Many analysts have attempted to evaluate GC instru
ments. e.g••wt'len tIleyJntended to purchase one. by means
of a few injections. There is usually 8m8zing disagr. .
~bout the conclusions - one analyst finds far less
discrimination With ins .yment 1.whereas another greatly
prefersil'lstrument 2 reotly for the same reason. What
did they really test7\~n it turns out to be the t ..........
tare profile of the injector.
If (me l:l,na!yst h~~ned to use.. a.~e~t s~ll1plein. aJ~ther
hiSt'l-boi!i.l'lg. a pool septum cap of in~rument 1
ll1ight~a~~pre d evaporation Inside tile needle (.pro videdheinjecte with the cool needle mathodl. At the
same nominal injector temperature on instrument 2. the
same sample might. however. have partially evaporated
in the needle. because the injector was more intensely
heated towards the top.
The other anaIYfit might have used a slightly more vola
tile solvent or injected somewhat moreslgwly. During in
jection into instrument 1 his test sample started evapo
ratingin.the nee.dle. It was poorly transferred (cool injec
tor head) and di$Crimination was terrible. He found that
the more intensely heated injector of instrument 2 pro
vided better results.
Testing and comparison of instruments is,gf course.• im
portant. but the rElsultsare usually valid only for the test
sample. the injectionyolume. the injector temperature.
the needle handling technique. and all the other condi
tionsapPUl:ld. which Wpyld be obvious ifthe background
were understood.
The story should. nevertheless, not be put aside with a
smile about ignorant instrument testers. Serious account
must be taken of the observation that a certain temPElra
ture distribution along the axis of the injector is prefer
able for one application, but a drawback for another.
me"
8.3. Thermostability of Septa
As mentioned above, an injector with a perfect temperature profile is of limited practical usefulness if low discrimination is obtained at the expense of severe septum problems. What are the problems and where are the limits? Other aspects concerning septa will be discussed in Section E2.3.
8.3. 1. Upper Tempera
In the past. injectors were designed to keep the septum cool to avoid excessive septum bleed -volatile components from the septum produced complex patterns of peaks and drift ing baselines, particularly in temperature-programmed chromatograms. after bleed material had been accumulated in the column inlet while the oven temperature was low. Septum bleed was a severe problem for classical packed col umn inlets. Modern injectors for capillary GC. however. are equipped with a septum purge, i.e. a permanent stream of gas removes the vapors released by the septum.
ture Limit Septum Bleed
56
A 8. Injector Temperature
Excessive Softening
Today the temperature limit of a septum is primarily deter mined by softening. Excessive heating causes the septum to flow like honey into the narrow channel towards the liner. After a few injections, such material is torn away from the septum and drops into the vaporizing chamber. The septum also becomes baked on to the metal parts such that it must be scraped off in small pieces when it needs to be replaced.
Advertized Thermostability
When septa are advertized as resisting high temperatures, the temperatures indicated usually refer to those set, not to the real temperatures of the septum cap. This renders comparison of data rather confusing - a septum might well resist "400°C" on one injector yet melt on another at "300 °C".
8.3.2. Some Tips
We are used to high injector temperatures - encouraged by data such as those shown above. We should keep in mind, however, that often these were necessary simply to achieve a modest temperature at the injector head. With a more constant temperature distribution, lower temperatures are sufficient; an injector thoroughly heated at 250°C might well perform better than another at 350 °C.
Lower Injector Temperatures
Tightening Septum Cap
Leakage upon Cooling
If high temperatures are applied, the septum cap must be tightened especially carefully. Septa expand upon heat ing. If the cap is tightened at ambient temperature, heating of the injector builds up a pressure on the septum that squeezes it into all corners, including the channel through which the syringe needle should pass. The needle will enter with difficulty and frequently cut off pieces of septum. The septum cap should be tightened only when the in
jector temperature has been reached.
To avoid leakage, the carrier gas must be switched on
only then.
Apply minimum force, just sufficient to prevent leakage,
because the septum will last longer and there will be
fewer septum particles in the vaporizing chamber.
Septa contract when cooled, wh ich means that there is a risk of leakage after cooling of the injector. The injector should, therefore, remain heated when the instrument is kept in stand-by (consuming 30-100 WI. It also means that the carrier gas must be switched off before the injector is cooled. Some septum caps are equipped with a spring, providing a more constant pressure on the septum when the tempera ture changes. This also prevents leakage upon cooling after an electric power breakdown.
9.1. Accuracy of Sample Volume
57
9. Plunger-in-Needle Syringes No Needle Problems?
One-microliter syringes have been claimed to be a solution to the needle problems described above - the plunger is supposed to displace the whole of the measured sam ple mechanically, i.e. to prevent volatilization of liquid re maining inside the needle after the injection. The sample volume should, therefore, be accurate and the introduction non-discriminating. One must differentiate between samples evaporating inside the needle and those for which this can be avoided. If evapo ration can be prevented. plunger-in-needle syringes fulfil the above expectations. Otherwise, however, they have several serious shortcomings rendering their use ques tionable.
9.1. Accuracy of Sample Volume
One-microliter syringes are graduated to dispense an accu rate volume of liquid under conditions which exclude evapo ration inside the needle. There is, however, an annular space between the internal needle wall and the plunger which is also filled with sample liquid. When evaporating, it leaves the needle in addition to the measured volume. In this way, the actual volume injected exceeds that measured by easily 0.1-0.2 p.L (in many cases corresponding to an in crease of 100 %). The sample material between the needle and the plunger often, moreover, causes problems with sy ringe cleaning.
Reproducibility
Transfer of the material from the space between the needle and the plunger tends to be poorly reproducible. Optimum reproducibility presupposes that it is complete. This might require the syringe needle to be kept inside the injector for 5-10 s.
9.2. Premature Expulsion
In contrast with plunger-in-barrel (5-10 Ill) syringes. plunger in-needle syringes offer no possibility of withdrawing the sample into the barrel when the needle is inserted into the hot injector. Thus injection is always performed by the filled needle technique.
Evaporation before the Plunger is Depressed
Mechanical displacement ofthe sample liquid from the nee dle presupposes that the liquid is still there when the plunger is depressed, but this is rather unlikely for samples dissolved in the most commonly used solvents. At the moment the analyst pushes the plunger - to "inject" • as he fondly imagines - the needle is already empty.
58
A 9. Plunger-in-Needle Syringes
It is not completely empty, as there is still high-boiling sol ute material on the internal needle wall. The plunger is, of course, unable to scrape these nanograms of solute mate rial from the wall - 10 ng forms a layer about 2 nm thick. Depression of the plunger locks it up between the needle and the plunger, where, maybe, it acts as a lubricant. Hence injection does not proceed as intended. Losses through the Septum Purge
The maximum sample volume of 1 III fills the 5-cm needle. A volume of 0.1 III corresponds, therefore, to a plug 5 mm in length, and when the plunger is left at the "0.1 Ill" mark, the sample is located in the front 5 mm of the needle. When the syringe needle penetrates the septum, the sample starts evaporating and is expelled into the septum or the area just below it (Figure A24). From there it is likely to be flushed out of the injector by the septum purge. The first 1-2 cm of the syringe needle, the content of which might be transferred into the stream of the septum purge, contains 0.2-0.4 III of sample. This might be the total amount of sample to be in jected.
10-20 mm
Figure A24
Premature elution from plunger-in-needle syringes during in
jection of samples with volatile matrices. Material leaving
the syringe needle before its exit reaches the vaporizing cham
ber iii vented through the septum purge.
Switching off the septum purge during injection is of little help because the sample vapors eluted into the injector head are not efficiently transported into the vaporizing chamber. The needle must reach the vaporizing chamber be fore it releases the first solute material. The sample must, therefore, be withdrawn by at least a corresponding distance (0.2-0.4 ul, read on the barrel) before the needle is inserted into the septum. This means that only part of the capacity of the syringe can be exploited. In conclusion, plunger-in-needle syringes might well create more new problems than they solve.
10.1. High Boiling Sample Matrix
59
10. Possibilities of Avoiding Evaporation in the Needle This section lists suggestions and possibilities for avoiding evaporation inside the syringe needle. 10.1. High Boiling Sam ple Matrix
In quality control of industrial production, many samples are injected without prior dilution. Often they are in a matrix of sufficiently high-boiling point that evaporation inside the syringe needle can be avoided. For other samples it is possi ble to use high-boiling solvents, such as alkanes between octane and tetradecane, alkylated benzenes, dimethylfor mamide (DMF), glycol ethers, or esters of fatty acids with intermediate chain lengths.
10.1. 1. Injector Tempera ture venus Solvent Boiling Point
In the 'design of a method exploiting this concept, the differ ence between the sample (solvent) boiling point and the in jectortemperature plays a key role. The sample (solvent) must not evaporate inside the needle, but should be vaporized within a reasonably short time inside the vaporizing chamber.
Minimum Injector Tempera ture
A low injector temperature helps prevent evaporation inside the needle. Hence, as a first step of method development, an estimate is made of the minimum injector temperature required for volatilization of the solutes. This tempera ture is usually substantially below the boiling point of the solutes, but depends on tolerable initial band widths (required speed of evaporation) and possible adsorption effects in the vaporizing chamber.
Solvent Boiling Point
The second step is selection of the solvent. Its boiling point must lie above the temperature the syringe needle reaches in the injector, but is preferably below that of the injector. This might, at first, seem an impossible task, but several fac tors contribute to rendering it rather easy.
Rapid Injection
Injection must be performed by the cool needle technique and as rapidly as possible, so that the syringe needle is with drawn before it approaches the injector temperature. The faster the injection, the lower may be the solvent boiling point compared with the injector temperature. Injection speeds are usually high and highly reproducible if autosamplers are used; in manual injection, the design of a method has to bear in mind that some injections will be slower than others.
60
A 10. Possibilities of Avoiding Evaporation in the Needle
Short Syringe Needles
Rapid introduction of the syringe needle through the
septum is greatly facilitated when it is short. Short needles
protrude, furthermore, less far into the well heated part
of the injector.
Temperature Gradient towards Septum
A cool septum is advantageous, because it transfers less
Testing
Whether or not the sample evaporates inside the needle can
easily checked by withdrawing the plunger after an in
jection. A volume of liquid corresponding to the needle vol
ume should have remained there.
If injection is performed manually, the test injection is car
ried out slightly more slowly than normal to ensure that the
liquid remains inside the needle even when the needle en
ter.s with more difficulty (e.g. because a new septum has been
installed) or the plunger does not move as freely as it should.
An Experimental Result
Schomburg et al. [13] investigated discrimination against n alkanes when manually injecting solutions in ...octane'
(b.p. 126°C) or ...dodecane (b.p. 216°C) at injectortem peratures of 210 or 310°C using the cool needle technique (see also Section C10.4.2). Injection of the octane solution at 210°C resulted in severe discrimination against the high-boiling compounds, indicat ing that evaporation inside the needle could not be sup pressed by use of a solvent boiling 84° below the injector temperature. The dodecane solution, on the other hand, af forded perfectly linear results even at an injector tempera ture of 310°C. Thus there was no evaporation inside the needle despite a solvent boiling point 94° below the (imposed) injector temperature. The difference probably resulted from the steeper temperature drop towards the septum cap when the injector temperature was high.
Thermal Conductivity of the Carrier Gas
The maximum difference between the solvent boiling point and the injector temperature also depends on factors d.
heat to the needle. Furthermore, the needle tip preferably
does not reach into the truly thermostatted region of the in
jector, calling for a short needle. In fact, whether or not evapo
ration inside the needle should be as complete as possible
or totally avoided requires opposite conditions.
termining how rapidly the syringe needle is heated, such as the contact with hot surfaces and the thermal con ductivity of the carrier gas, as shown by Schomburg et al. [20]. Reglera et al. [21] optimized split injection for a test mixture of C,,-C 20 n-alkane standards. Hydrogen as carrier gas re sulted in relative standard deviations of absolute peak areas of 25-35 % (I) (sample volume, "0.4 ul," ); they were 8 % with helium and 4-5 % with nitrogen. The effects were probably the result of variable transfer from the needle, depending on the thermal conductivity of the carrier gas.
10.1. High Boiling Sample Matrix
61
Although such results are impressive, they do not furnish sufficient arguments for use of nitrogen as carrier gas; hy drogen remains first choice in almost all situations.
Conclusion
There is no simple rule about how much the sample or sol vent boiling point should be below the injector temperature, because there too many interfering factors, the temperature of the injector head being the most important. In practice, solvents with boiling points up to some 1000 below the injector temperature were successful. The experimental test is simple!
10.1.2. Practical Aspects
High boiling solvents are seldom suitable for the analysis of volatile solutes, because the latter tend to be obscured by the often broad peaks of the solvent and its impurities. Components eluted before the solvent form peaks distorted (broadened or even split) primarily by partial solvent trap ping [22,23]. Injection at high split ratios is an exception to this.
Not for Volatile Solutes
Split Injection
In split injection, three factors determine the upper limit of the solvent boiling point. Volatilization of the sample in the injector may become so slow that the initial bands of the solutes are ex cessively broadened. This is important in isothermal runs; temperature-programmed analysis is more toler ant because cold trapping reconcentrates the initial bands. 2 If the oven temperature during injection is well below the solvent boiling point, the solvent strongly recondenses in the column inlet. This increases the flow rate into the column and affects the split ratio (see Section C8.3.3). It might, moreover, cause non-linear splitting iftransport into the column is enhanced for vola tile solutes only. 3 Depending on the instrument, the solvent may recondense in the split outlet line, which again af fects the split ratio. The split outlet line, including the restrictor determining the split flow rate, should, there fore, be short and heated. 4 As a result of all these effects, the reproducibility of absolute and, to a lesser extent, relative peak areas tends to be poor.
Solvent Trapping at Elevated Oven Temperatures
Besides solving the needle problems, in splitless injection the use of high-boiling solvents can accelerate the analy sis, because solvent effects can be achieved at elevated col umn temperatures and less cooling of the oven is required. This might even enable the analyst to perform GC isother mally at elevated temperatures.
Solvent Purity
The purity of high-boiling solvents tends to be a limiting fac tor. Efficient redistillation in the laboratory is usually diffi
62
A 10. Possibilities of Avoiding Evaporation in the Needle cult. In practice, use of high-boiling solvents for splitless in jection is often restricted to applications employing selective detectors.
10.2. Cooled Septum
Intimate contact with the septum efficiently transfers heat to the syringe needle. Pankow et al. [24] investigated the possi bility of preventing evaporation inside the needle by active cooling of the septum cap. Unfortunately, improved repeatability of the results was reported rather than the ex tent of evaporation in the needle. The injector temperature of 330°C was, furthermore, too high to give hexane (used as solvent for the test mixture) a real chance of remaining unevaporated inside the syringe needle.
10.3. Cooled Needle Technique
In 1984, Schomburg et al. [25] described an accessory for cooling the syringe needle inside the vaporizing cham ber: a double tube was introduced with coolant flowing through the outer tube to keep the inner tube at a low tem perature. The syringe needle passed through the cooled in ner tube and only its tip protruded into the hot chamber. A modification described later [26] included better insulation of the cooling mantle against the liner and the use of a wider vaporizing chamber.
Absence of Discrimination
For split injection of a mixture of ClO-C32 n-alkanes in a sol vent not specified, discrimination of the high-boiling com ponents could be eliminated completely, indicating that evaporation in the needle was successfully suppressed. The same test mixture showed absence of discrimination also for splitless injection. These data were used to support the opinion that no high-boiling solute material condensed on the outer wall of the cold finger reaching into the vaporiz ing chamber. As the sample vapors could not expand up wards (the space being filled by the cooling finger), there seemed to be no room for them.
10.4. Fast Injection by Autosampler
In 1985 Hewlett-Packard introduced an autosampler (HP 7673A) injecting at a speed suppressing evaporation in the syringe needle. The maximum needle dwell time, i.e. the maximum residence time of the needle inside the injector not initiating sample evaporation inside the needle, was de termined [27]. As is shown in Figure A25 for an injector set at 350°C and a sample in hexane, there was no discrimi nation against n-C40 with needle dwell times up to 300 ms. Since results were similar for pentane as solvent, evaporation inside the needle could be ruled out for all the commonly used solvents. Typical fast manual injection is es timated to take 1-2 s.
Cool Injector Head
The results in the above figure are valid only for the injector used, because they are influenced by the temperature pro file in the injector head. In fact, the temperature of the injec
10.4. Fast Injection by Autosampler
63
1.2
1.1
~ U
7673A Fest Injsctlon (100 ms, 1.0
!
l!
•
!
c
0.9
Typical menusl Injection
0.8
0.7 0.0
1.0
2.0
Needls dwell time (seconds'
Figure A25 Dependence of the r8tio of the pe8k 8re8S, n-C.Jn-C,o' on needle dwell time in the injector, determined using 8n 8utosampler with progr8mm8ble injection speed. An 8re8 ratio of unity indic8tes no discrimin8tion 8g8inst n-C4Q' i.e, th8t the s8mple did not eV8por8te inside the syringe n_dle. (From· Snyder [27]).
tor head was low: the injector temperature set at 350 "C brought the septum to hardly 140 °C. Such fast injection has several advantages: it eliminates the most important source of discrimination against high
Advantages
boiling components, improves reproducibility by virtually eliminating a poorly reproducible deviation, enables the in jection of sample volumes smaller than that of the needle, and provides peak areas proportional to a well defined injec tion volume. Dilemma
There are hardly objections against a low septum tempera ture as long as injection is performed exclusively by means of the fast autosampler, thus suppressing evapo ration in the needle. If, however, the same injector is used for manual injection of samples in volatile solvents, the low temperature of the injector head results in severe dis crimination against high-boiling components. For samples sensitive to discrimination, performance with manual injec tion is rather poor. It is probably impossible to perform autosampler injection at a speed preventing evaporation inside the needle with an injector well heated up to its top. Hence the temperature pro file is either optimized forthe fast autosampler or for manual injection.
10.5. Evaporation in the Injector
When samples are injected by a technique preventing evapo ration in the needle (high-boiling solvents or fast auto-
UNIVERSIPAP DE ANTIOQUlA
BlBLIOTBCA CENTRAL
64
A 10. Possibilities of Avoiding Evaporation in the Needle
sampler), the evaporation process in the vaporizing chamber is also influenced. As shown in more detail in the next section, evaporation inside the needle nebulizes the sample liquid upon leaving the needle, which greatly facili tates further evaporation. Nebulization is, in fact, the prereq uisite for sample vaporization in an empty If the sample leaves the needle as a band of liquid, it must be stopped by means such as glass wool or obstacles built into the liner. A large proportion of the sample, at least, evaporates from surfaces and often suffers from adsorption or retention by non-evapo rated material from previous injections. One Problem Traded Against Another
Hence partial evaporation in the needle causes the prob lems outlined in this section. but avoids those de scribed in the next.
Autosampler Injection is not Automated Manual Injection
It is tempting to think of autosampler injection as automa tion of manual injection. Some autosamplers really imitate manual injection, enabling hot needle injection to be per formed with the addition of some solvent ahead or behind the sample plug (Section E3). A fast autosampler, however, fundamentally changes the evaporation process. Methods must specify the kind of a sample introdu'ction for which they are written, and they must be r.validated when chang ing from manual injection to fast autosampling or vice versa.
11. Summarizing Guidelines At the risk of making simplifications which are not always appropriate, the following working rules can serve as con cluding guidelines. They refer to the injection of liquid sam ples. Injection of gases is not considered here because there are no problems related to those discussed in this chapter. Strategy
1) Decide whether to go for suppression of evaporation in side the needle or a transfer of the needle content which is as complete as possible.
Suppressed Evaporation inside Needle
2) If suppression is chosen: a) Inject with a fast autosampler, select a high-boiling sample matrix, or use an extremely short syringe needle (20 mm or longer needle inserted only par tially). b) Unless injecting with a fast autosampler, use the low est injector temperature ensuring satisfactory evapo ration of the solutes.
11. Summarizing Guidelines
65
c) A cool injector head helps to keep the needle tem perature low. d) Pack the injector liner with deactivated glass wool or use a liner with a suitable obstacle to stop the band of liquid and promote its vaporization. 3) If partial evaporation inside the syringe needle is pre ferred or cannot be avoided, render elution from the nee dle as complete as possible. The following remarks ap ply to samples containing solutes of intermediate to high elution temperatures (volatility below that of, e.g., n pentadecane). a) Do not use plunger-in-need/e (one microliter) sy ringes. b) Use a hot injector head, i.e. septum caps without cool ing fins, and insulate the top of the injector. c) Use injector temperatures as high as can be toler ated by the solutes. d) Use the hot needle method, i.e. withdraw the sample into the barrel of the syringe, pre-heat the needle in the injector for 3-5 s, and depress the plunger as rapidly as possible. e). At injector temperatures below ca. 200°C, use the solvent flush technique. f) Inject sample volumes exceeding the needle volume: "0.5" to "1 ~L". If smaller sample volumes are to be introduced, use the solvent flush technique. g) Do not quantitate on the basis of the sample volume. The accurate amount of injected solute material must be considered unknown, although reproducible. h) Do not change the volume injected between calibra tion and analysis of the sample - even relative peak areas might depend on the injection volume. i) Use the same syringe throughout a quantitation pro cedure to rule out systematic deviations resulting from contamination of the needle wall. k) Use solvents of a polarity sufficient to avoid adsorp tion in the syringe (perhaps as pure solvent behind the sample plug, applying the hot needle solvent flush method). I) Test the losses of solute material in the needle by needle rinse injections, using a strong solvent if adsorptive solutes are involved. m) Use long syringe needles and empty liners (accord ing to the requirements of thermospray injection).
66
A References
References A
2
3 4 5 6 7
8 9 10
11 12 13
14
15
16 17
18 19 20
21
22
D. Tong, AM. Barnes, K.D. Bartle, and AA Clifford, "Valve Injection for Gas Chromato graphic Analysis on Small-Bore Open Tubular Columns", J. Microcolumn Separations 8 (1996) 353. J. Qian, C.E. Polymeropulos, and R. Ulisse, "Liquid Jet Evolution from a GC Injector", J. Chromatogr. 609 (1992) 269. J.v. Hinshaw, "Syringes", LC-GC International 1 (4) (1988) 24. O.K. Guns, "Effect of Injection Needle Dimensions in GC", J. Chromatogr. 292 (1984) 57. K. Grob and S. Rennhard, "Evaluation of Syringe Handling Techniques for Injections into Vaporizing GC Injectors", HRC & CC 3 (1980) 627. K. Grob and H.P. Neukam, "The Influence of the Syringe Needle on the Precision and Accuracy of Vaporizing GC Injections", HRC & CC 2 (1979) 15. F.-S. Wang, H. Shan field, and A,. Zlstkis, "Injection Temperature Effects Using On-Column and Split Sampling in Capillary GC", HRC & CC 6 (1983) 471. P. Hilling (personal communication) K. Grob and K. Grob, "On-Column Injection on to Glass Capillary Columns", J. Chroma togr. 151 (1978) 311. K. Grob, and Ph. Mati/e, "Capillary GC of Glucosinolate-Derived Horseradish Constitu ents", Phytochemistry 19 (1980) 1789. J. Roeraade, "Factors Affecting Sample Transfer from Microlitre Syringes", J. Chroma togr.441 (1988) 367. P.A Rodriguez, C.L. Eddy, G.M. Ridder, and C.R. Culbertson, "Automated Quartz Injection Trap for Fused-Silica Capillary Columns", J. Chromatogr. 236 (1982) 39. G. Schomburg, R. Dielmann, H. Borwitzky, and H. Husmann, "Capillary GC of Compounds of Low Volatility", in: G. Schomburg and L. Rohrschneider(Eds.), Proc. 12th Int. Symp. on Chromatography, Baden-Baden, 1976, Elsevier, Amsterdam (1978) P157. K. Grab, "Evaluation of Injection Techniques for Triglycerides in Capillary GC", J. Chro matogr. 178 (1979) 387. G.L. Le Bel, and D. T. Williams, "Effect of Injection Solvent on GC Quantitation of some Polar Organophosphorus Pesticides", J. Assoc. Off. Anal. Chem. 62 (1979) 1353. H. Brotell, "Syringe and Column Adsorption of Tertiary Amines in GC", J. Chromatogr. 196 (1980) 489. D.I. Carroll, I. Dzidic, R.N. Stillwell, M.G. Horning, and E.G. Horning, "Subpicogram De tection System for Gas Phase Analysis Based upon Atmospheric Pressure Ionisation (API) Mass Spectrometry", Anal. Chem. 46 (1974) 706. M.S. Klee, "GC Inlets - An Introduction", Hewlett-Packard Co., Avondale (1991) 42. K. Grob and H.P. Neukam, "Should the Septum Part of Vaporizing Injectors be Kept at Lower Temperature?" J. Chromatogr. 198 (1980) 64. G. Schomburg, H. Husmann, and R. Rittmann, "Direct (On-Column) Sampling into Glass Capillary Columns. Comparative Investigations on Split, Splitless and On-Column Sam pling", J. Chromatogr. 204 (1981) 85. G. Reglero, M. Herraiz, and M.D. Cabezudo, "Sampling in Capillary GC: A Comparison
between the Split and the PTV-Split Procedures", Chromatographia 22 (1986) 333.
K. Grob, "Broadening of Peaks Eluted Before the Solvent in Capillary GC. Part 1: The Role
of Solvent Trapping", Chrornatoqraphia 17 (1983) 357.
A References
67
23 K. Grob and B. Schilling, "Broadening of Peaks Eluted Before the Solvent in Capillary GC. Part 2: The Role of Phase Soaking", Chromatographia 17 (1983) 361. 24 J. F. Pankow, ~E. Asher, and L.M. Isabelle, "Reduction of GC Needle Volatilization and Septum Bleed with Active Septum Cooling", Anal. Chem. 55 (1983) 1451. 25 G. Schomburg, U. Hiiusig, H. Husmann, and H. Bebleu, "Sampling onto Capillary Col umns. Difficulties with Various Types of Samples. A Simple Accessory to Split Injectors for Avoidance of Discrimination", Chromatographia 19 (1984) 29. 26 G. Schomburg and U. Hiiusig, "Application ofthe 'Cooled Needle' Technique to Split and Splitless Sampling onto Capillary Columns", HRC & CC 8 (1985) 572. 27 ~D. Snyder, "Automatic Sample Handling. Fast Injection with the HP 7673A Automatic Injector: Chemical Performance", Technical Paper Nr. 108, Hewlett-Packard (1985).
1. Introduction
69
B Sample Evaporation in the Injector
1. Introduction According to the classical concept of split and splitless injec tion, the sample liquid leaving the syringe needle must be evaporated before it reaches the column entrance. Then the vapor is either split or transferred into the colum n in splitless mode (Figure B1). For many years, there was little solid knowledge about the vaporization process, but much specu lation. It is, in fact, difficult to tell what has happened inside Syringe
Septum
Injector liner
Vaporizing chamber
~ Split outlet
Sample leaving the syringe needle with or without partial evaporation inside the needle (subject of Section A) The sample must evaporate before reaching the column entrance (subject of Section B)
Split or splitless transfer into the column (Section C and 0)
Column
Figure 81
The steps of the injection process.
70
B 1. Introduction
the injector merely by looking at chromatograms and com paring peak areas. Visual observations made in recent years, discussed here and shown on the CD-ROM, have im proved matters substantially.
1.1. Problems Caused by Incomplete Evaporation
Incomplete evaporation does not produce obvious effects in the chromatograms, such as broadened or distorted peaks, nor are there other simple indicators of whether or not a sam ple was completely vaporized before it reached the column. Incomplete evaporation can severely affect quantitative re sults, but not all problems in quantitative analysis are re lated to sample evaporation. Hence the subject is complex and requires the attention of the analyst.
Inaccurate Split Ratio
In split injection, non-evaporated sample material is usually split by an incorrect ratio (Section C8.3.4), because the prob ability of larger droplets or a band of liquid hitting or pass ing the column entrance is independent ofthe gas flow rates, i.e. of the adjusted split ratio. As the liquid has a poorly reproducible flight path, the amount of sample material entering the column is not under control. This is not neces sarilytrue for small droplets or particles, since aerosols might behave like vapors.
Non-Linearity of Splitting
The other problem, discussed in more detail in Section C9.3, is the "Iinearity of splitting". Incomplete evaporation is one reason why the composition of the sample material entering the column can differ from that injected. If the volatile components evaporate, while the rest passes the split point as droplets or as a band of liquid, vapor and liquid (and the sample components in these two phases) are likely to be split in different ratios.
Splitless Injection
In splitless injection, incomplete evaporation causes sample material to be "shot" to the bottom of the vaporizing chamber, from where it may not return to the column en trance. Particularly if septum particles or other material ab sorb the higher-boiling sample components, they are lost to the analysis. As a result, peak areas are too small and high boiling components likely to be affected more severely than the volatiles. Again, the process is not under control.
Poor Quantitative Results
Problems associated with incomplete sample evaporation be come apparent from experiments on the accuracy of results - peak areas differ from what they should be. Detection of deviations from the correct peak size is not always easy, since it presupposes comparison with a reference. Conclu sions are further complicated by other mechanisms result ing in similar deviations.
High Standard Deviations
The phenomenon most likely to be noticed is poor reproduc ibility of absolute and relative peak areas. High standard de
1.1. Problems Caused by Incomplete Evaporation
71
viations are the result of poor reproducibility of the de viations from the peak areas required. Unfortunately there are, again, other reasons for high standard deviations.
2. Solvent Evaporation - Heat Transfer Some information on the vaporization process can be drawn from the heat consumed by sample evaporation and the time available for heat transfer. The estimates presented below are semi-quantitative, aimed at painting a picture of the situation. Assumptions are not sufficiently accurate to en able practical conclusions to be drawn, as is also shown by the visual observations discussed subsequently. Solvent Evaporation as First Obstacle
Solvent evaporation is the first serious problem. It seems simple to evaporate 2 III of a solvent with a boiling point below 100°C in a vaporizing chamber at, e.g., 250°C. The facts presented below show, however, that it is not. As long as the solvent is not fully evaporated, the tempera ture of the droplets is the solvent boiling point. Only ex tremely volatile solutes can then evaporate; all the compo nents eluted after the solvent peak remain in the liquid phase. Hence, because solutes evaporate after the solvent, va porization of the solvent is the first obstacle to overcome.
2.1. Available Evapora tion Time
The time available for sample evaporation depends on the movement of the sample liquid in the vaporizing chamber. Three scenarios will be considered, two of which are shown in Figure 82.
Carrier gas supply Injector insert
Split outlet
Scenario 1 Band of liquid
Scenario 2 Nebulized liquid
Figure 82 Two scenarios of sample evaporation. (From ref. [1]).
72
B 2. Solvent Evaporation - Heat Transfer
2 3
The sample liquid forms a narrow band "shot" through an empty chamber. The sample liquid is nebulized, forming a fog driven by the carrier gas. The liquid is deposited on to the liner wall or a pack ing material.
2. 1. 1. Band of Liquid
The sample liquid leaves the syringe needle as a narrow band
of liquid and is "shot" through the chamber, as observed
when the sample is "injected" into ambient air.
Speed of the Sample Liquid
The sample liquid leaves the needle at a velocity determined
by the speed of the plunger and the type of syringe used. In
manual injection, the plunger is normally depressed at 1-2
m/s. The liquid is further accelerated when it passes from
the wide-bore glass barrel into the narrower-bore syringe
needle. For 10 III syringes and 26S gauge needles, accelera
tion corresponds to a factor of 15, i.e. the liquid leaves the
needle at a speed of 15-30 mls (50-100 krn/h). Since friction
is low, the band continues traveling at this speed for quite
some distance, certainly to the base of the injector.
Time for Evaporation
The band of liquid covers a 4-cm distance to the column
entrance in ca. 2 ms. In this situation, the time available '
for evaporation is primarily determined by the duration of
the injection. If the plunger is depressed at 1 mis, a 1 cm
plug of liquid is introduced in 10 ms. Visual experiments
(video on the CD-ROM) confirmed that the liquid mostly left
the needle in a single frame of the film (40 ms) even when
5 III were injected.
2.1.2. Nebulized Sample
As a Scenario 2 we assume that the sample liquid is nebulized
upon leaving the needle (thermospray, see below). Initially
the speed of the small droplets is the same as that estimated
above for the band or even higher (the vapors formed in the
needle act like gunpowder), but friction between the drop
lets and the carrier gas rapidly slows the former to the speed
of the gas. To a first approximation, they cover the distance
between the needle exit and the column entrance at the
speed of the carrier gas.
Speed of the Carrier Gas
Some calculated carrier gas velocities in the injector are given
in Table 81. A 1 mlzmln flow rate is typical for splitless in
jection; 20 and 100 rnt/mln refer to the flow rates in split
injection.
In split injection into a 2 mm i.d. liner, it takes the carrier gas
75 ms to 1.5 s to cover a 4 cm distance from the needle exit
to the column entrance, and if the nebulized liquid travels at
the same speed, this is also the time available for evapora
tion. As the gas in a 4 mm i.d, liner is four times slower than
in a 2 mm i.d. liner, correspondingly more time is available
for evaporation.
2.1. Available Evaporation Time
73
Table 81
Gas velocities in 2 or 4 mm i.d. liners for given gas flow
rates. and the resulting time available for sample evapora
tion if the nebulized liquid moves at the gas velocity.
Liner i.d. [mml
Flow rate [mLJminl
Gas velocity lcrn/s]
Evap. time [sl
2mm
20 100 1 (splitless) 20 100
10 53 0.1 2.6 53
0.4 0.075 30 1.5 0.3
4mm
In splitless injection, residence times in the vaporizing cham ber are long.
2. 1.3. Deposition on Surfaces
The third scenario assumes that the sample liquid is trans ferred. to the liner wall or on to a packing material. As the liquid remains stationary, evaporation from this surface may be slow. The time available for sample evaporation is theoretically unlimited.
2.2. Amount of Heat Required
The limiting factor in rapid evaporation is the transfer of heat to the sample liquid, usually primarily consisting of solvent. Table 82 lists amounts of heat required to evapo rate 1 III of solvents and to heat it up to an injector tempera ture of 250 "C. As a simplification, calculations use heat ca pacities for the solvent vapor. Table 82 Heat [meal] required to evaporate 1 III of solvent and bring it to 250°C ([2.3]).
Solvent Hexane Toluene Diethyl ether 1-Propanol Methanol Water
2.3. Sources of Heat
Heating
Evaporation
Total
89 61 78 77 72 220
80 86 85 166 263 539
169 147 163 243 335 759
The energy required to vaporize and heat 1 III of solvent varies by a factor of almost five. It is approximately five times lower for the solvents normally used than for the most energy-consuming solvent, i.e. water. To evaporate the sample in a short time, heat must be read ily available; there is insufficient time for heat transfer over longer distances.
74
B 2. Solvent Evaporation - Heat Transfer
Cooling of the Injector
Before estimating the amount of heat available from differ
ent sources, it should be remembered that absorption of
heat will always cool the source. Sample evaporation
does not cool the whole heating block, only the parts of the
vaporizing chamber with which the sample is in contact. The
amount of heat available depends on the extent to which
cooling is acceptable - is, for instance, cooling to 230°C tol
erable if the injector temperature is set at 250 °C?
2.3. 1. Carrier Gas
The heat most readily available to the sample is that con
tained in the carrier gas. Little more than the carrier gas be
tween the needle exit and the column entrance is in contact
with the sample, whether a nebulized sample moves with
the gas or a band of liquid is shot through it.
Assuming a 2 or a 4 mm i.d. liner and a 40 mm distance
between the needle tip and the column inlet, heat can be
extracted from 130 or 500 ~L carrier gas, respectively.
Less than 1 % of the Heat Required
The heat capacity of hydrogen is 3.4 cal!g K, hence the heat
available from 130 III of hydrogen is 4 x 10⁻⁵ cal per de
gree of cooling (3 and 4 x 10⁻⁵ cal/K for helium and nitro
gen, respectively). Even if we allow the carrier gas to be
cooled from 250 to 200°C, only 2 x 10⁻³ cal become avail
able, i.e. not even 1 % of the heat required if 2 III of a tvpical :
solvent is injected. Expressed differently, injection of some
0.04 ~L of solvent is sufficient to cool the carrier gas in the vaporization zone to a temperature near ambi
ent. Mixing with Carrier Gas does not Help
As the amount of heat extractable from the carrier gas is negligible compared with that required, mixing of the sam ple with carrier gas is an inefficient means of supporting sample evaporation. We need richer sources of heat.
2.3.2. Packed Injector
A current idea is to increase the thermal capacity of the vaporizing chamber by packing it with solid material, e.g. glass wool. Transfer of heat to the sample from this packing material will again reduce the temperature, but the larger the mass of material cooled, the larger is the amount of heat available.
Liners
2 J.lL Hexane, Cooling by 20°
As an example, we assume a 2 III injection of an "easy" solvent, such as hexane, and accept cooling of the vaporiza tion zone by 20° (e.g., from 250 to 230°C). Evaporation and heating of 2 III hexane to 230 °C requires 0.322 cal. With a heat capacity of 0.2 cal!g K for glass (glass wool, silica, or column packing materials), heat must be extracted from 80 mg packing material.
Glass Wool
Even if densely packed, it is difficult to introduce 10 mg glass wool into a vaporizing chamber 4 em long and of 2 mm i.d.; approximately 30 mg of glass wool can be packed into the same length of a 4 mm i.d. liner. This is, how
2.3. Sources of Heat
75
ever, nothing like sufficient. When a 2 mm i.d. liner packed with 8 mg wool is used, the sample cools the packing to a temperature near the solvent boiling point. Even this is un realistic because the sample extracts the heat merely from the top layer of the packing. Column Packing Material
The materials used for packed columns have densities higher than that of glass wool (a rough average of, maybe, 0.5 g/mL), and thus provide a substantially larger reservoir of heat. The 2 and 4 mm l.d. liners could be packed with some 65 or 200 mg material, respectively. Theoretically this fulfills the above requirements, but if heat is extracted from the top 5 mm only, the heat capacity is still insufficient.
2 ul: of Water
The results are still worse if the above estimates are repeated for water, the solvent consuming the largest amount of heat. Evaporation and heating of 2 IJ.L water to 230°C requires ca. 1.5 cal, cooling 355 mg of silica-type material by 20°. Hence the packing material which can be brought into con tact with the sample delivers at best 1 % of the heat required.
High Injector Temperatures?
It seems plausible to solve the problem by setting a higher injector temperature. If 350°C is chosen instead of 250 °C, and 230°C is still the temperature required, cooling can ex ploit a temperature difference of 120°, which means that 6 times as much heat is available. This is, however, still far from what is needed.
2.3.3. Heat from Liner Wall
The heat consumed is ultimately provided by the heating block of the injector, but transfer from the heating cartridges to the vaporizing chamber is too slow to be relevant. Only the liner wall is important as a heat reservoir. It provides the heat not only for injections into empty chambers, but also that needed to replenish the heat consumed from the pack ing material.
Thickness of the Cooled Glass Layer
Is has been shown that evaporation and heating of 2 IJ.L hexane requires an amount of heat which can be provided by cooling 80 mg glass by 20°. Within the vaporizing zone of the 2 mm i.d.liner, 80 mg glass corresponds to a layer 0.32 mm thick (Figure 83). The analogous calculation for water results in cooling of a 1.4 mm layer. The wall thicknesses of conventional liners vary between 0.7 and 1.5 mm.
2.4. Time Required for Heat Transfer
Two steps of heat transfer must be considered, i.e. transfer within the liner to its surface and that from its surface to the sample. Rough estimation of the heat flow rates is sufficient, because we merely want to obtain an idea of what is possi ble.
2.4. 1. Transfer Within the
The temperature gradient within the liner wall has an ex ponentialprofile rather than the step profile suggested by
Liner Wall
76
B 2. Solvent Evaporation - Heat Transfer
~Sy ACti~e
'~rt"
metal surfaces
Column inlet Figure C12
Bottom section of the vaporizing injector. The column en
trance should be positioned as low as possible. but clearly
above the contaminants usually accumulated there.
Accumulation of Particles
The other concern is the septum particles and other invola tile material accumulated at the bottom of the vaporizing chamber, and the metal surfaces which degrade labile com pounds. The column entrance should be about 5 mm above this "garbage bin". In this way, material reaching the bottom of the vaporizing chamber leaves through the split outlet; adsorption by contaminants or degradation on metal surfaces have no influence.
6.3.4. Injection Point
Diffusion speeds of the vaporized sample components in the vaporizing chamber are high, resulting in rapid dilution with carrier gas. To achieve rapid transfer to the column, the sam ple must be released from the syringe needle near the col
6.3. Maximum Vapor Concentration in the Injector
183
umn entrance. For gases (headspace analysis), the injection point should be ca. 10 mm above the column entrance, taking into account some expansion of the sample cloud to wards the column. 6.3.5. Syringe Needles
Forthe most common vaporizing chambers of 80 mm length, needles of gas syringes should be 85 mm long, whereas standard 71 mm needles suit the injection of liquids. For the injector of CEInstruments/ThermoQuest with a length of 120 rnrn, it is recommended thatthe liner with the restric tion at the bottom is used. This reduces the length of the vaporizing chamber to 80 mm - excessively long needles would be needed otherwise. Standard gas syringes are equipped with 51 mm nee dies, even though this is not appropriate for any commer cial injector. Syringes with longer needles must, therefore, be specially ordered. Most autosamplers work with short needles and do not allow the use of longer ones.
Length of the Needle
Needles with Side Port Holes
When :syringes with special needles are ordered, another problem should be solved at the same time. Especially when hard (high-temperature) septa are used, standard 22-gauge needles of gas syringes frequently cut out rather large pieces, causing severe leakage after a few injections only. Softer, more elastic septa are superior in this respect (appropriate also because injector temperatures are low), but needles are all too often plugged by septum particles. This is sel dom observed when liquids are injected, not because the needle is less frequently plugged, but because violent evapo ration inside the needle removes the particle (found later at the bottom of the vaporizing chamber). Both problems are solved by use of needles with a side port hole (Section A2.3.2).
Plungers with PTFE TIp?
Plungers of standard "gas tight" syringes are equipped with PTFE tips. They are usually a tighter fit than steel plungers. At temperatures up to ca. 150°C, PTFE behaves as a solid and does not pick up solute material. Small amounts of con taminants coating the PTFE surface or entering the pores are, however, sufficient to turn it into a stationary phase absorbing sample material. Steel plungers are kept clean more easily and might therefore be preferable. For reasons of tightness, the syringe should be filled only partially and the plunger should not withdrawn beyond ca. 80 % of the graduation (e.g. the 400 III mark for a 500 III syringe). Tight ness can be tested by applying a drop of a low viscosity liq uid, such as hexane, at the point where the plunger leaves the barrel: escaping gas forms bubbles.
6.4. Column Flow Rate
As shown above, a maximum amount of sample material should enter the column within a time corresponding to the maximum tolerable initial band width. At a given (high) con centrationof the sample material, this amount is determined
~lDJ\DDEANTIOQUlA
BlBLIOTBCA CENTRAL
184
C 6. Analysis Requiring Maximum Sensitivity by the carrier gas flow rate into the column. Increasing the column flow rate proportionately increases the amount of sample material carried into the column per unit time.
Mass- or Concentration Dependent Detectors
Increasing the carrier gas flow rate increases the amount of material entering the detector in unit time, but does not in crease the concentration of the solute material in the carrier gas. Hence the response of mass-dependent detectors increases. but not that of concentration-dependent detectors. Does this affect the above statement? Flame ionization detectors (FlO, NPO or AFIO) and mass spectrometers are mass-dependent. Basically electron cap ture detectors (ECD) and flame photometric detectors (FPD) are concentration-dependent, but since the column flow rate represents only a small fraction of a more or less constant total flow of detector gases, an increase in the column flow rate also causes an increase in the sample concentration in the detector. It is, therefore, more appropriate to consider them as mass-dependent also.
6.4. 1. Low Split Ratios Resulting from High Column Flow Rates
If the column flow rate is, e.g., 10 mUmin, a split flow rate of 10 rnt/rnln means a split ratio of just 1:1 or that half the sample enters the column. As the flow rate through the injector is 20 rnt/rnin, the initial band width is ca. 2-3 s, enabling reasonable chromatography if the peaks of interest are not eluted very rapidly. In this way, the sensitivity ob tained by split injection is inferior to splitless injection by merely a factor of two.
6.4.2. Selection of the Carrier Gas
Chromatography must be optimized for high column flow rates. Hydrogen enables the use of the highest flow at a given separation efficiency. For short columns (inlet pres sures below 1 bar), helium is nearly equivalent. Nitrogen is not suitable. To obtain comparable column performance, gas flow rates must be kept ca. three times lower owing to slow diffusion in this gas.
6.4.3. Selection of the Column
At first sight it seems that wider bore columns enable the use of higher carrier gas flow rates. We are not, however, looking for the column resulting in a high gas flow rate at a low inlet pressure, but that providing maximum sensitiv ity at a high separation efficiency.
0.53 mm or 0.32 mm i.d. Columns?
At a given gas velocity, the volumetric gas flow rate through a 0.53 mm i.d. column is 2.7 times greater than that through a 0.32 mm i.d. column, which seems to favor the use of wide bore columns. Increasing the column diameter results in loss of separation efficiency, however, and optimum gas veloci ties are lower. Comparison of the separation efficiencies (in TZ) of columns of different diameter and length shows that 0.32 mm i.d, col
6.4. Column Flow Rate
185
umns are superior even at extremely high flow rates (e.g. 20 ml/min) [36). A 5 m x 0.32 mm i.d. column usually provides almost the same separation as a 10 m x 0.53 mm i.d. col umn. Columns of 0.25 mm i.d. would be yet more efficient, but these must be short owing to the high inlet pressures required (an important drawback in the practice of headspace analysis, because high retentive power is needed). For such reasons, 0.32 mm i.d. columns are the most appropriate.
6.5. Summary: Maximum Sensitivity from Split Injection
1 2 3
4 5 6 7
Do not use nitrogen as carrier gas; hydrogen is some what better than helium. Use 0.32 mm i.d. columns at high flow rates. For heads pace analysis of volatile components, high gas flow rates necessitate the use of columns with rather thick (e.g. 1 urn) films and maybe increased length (25-30 m) to obtain sufficient retention of the solutes. Use 3-4 mm i.d. liners. For gaseous samples use open tubular (empty) liners. Keep injeetortemperatures low (for gaseous samples, 80-100 °C is sufficient). Inject sample volumes as recommended in Table C4, using a syringe equipped with a long needle. Reduce the split flow rate until the first peak of inter est starts to become broad and/or no longer grows higher.
7. High Split Ratios for Reducing the Sample Size At the other extreme of applications involving split injection are those requiring high split ratios to enable injection of highly concentrated or undiluted samples. Some sam ples cannot be diluted because the solvent peak would ob scure important peaks. For others, e.g. from quality control in an industrial process, dilution is omitted for the sake of simplicity. Solvent Promoting Evapora Before beginning this topic it should be remembered that tion samples are often diluted not only to avoid the use of high split ratios, but also because of the improved precision and accuracy of results. Solvents facilitate evaporation in the injector, particularly with the hot needle technique, where they act as a propellant nebulizing the sample liquid.
186
C 7. High Split Ratios for Reducing the Sample Size
Viscous Samples
Viscous samples cannot be injected accurately without prior dilution, because they tend to be difficult to separate from the needle tip. Instead of being transferred into the vaporizing chamber, they remain hanging on the needle, are withdrawn together with the latter, and are usually wiped off on the septum.
7.1. Diluent as a Hypo thetical Sample
To render our discussion more specific, we assume that the sample consists of a diluent composed of four solvents, each representing 25 % of the total and that dilution with another solvent is impossible.
Split Ratio Required
Because the column capacity for each component might be 50 ng (intermediate film thickness), a total of 200 ng of sam ple may enter the column. If we inject 1 ul, (1 mg) into the vaporizing chamber, a split ratio of 5000:1 is required. With a 0.32 mm i.d. column and a carrier gas flow rate of 3 mLJmin, this requires a split flow rate of 15.000 mlJmin - or 900 IIh... This is obviously impossible and the question arises whether this kind of injection feasible at all. Yes it is, but only after optimization.
7.2. The Maximum Split Flow Rate
For reasons to be listed below, split flow rates of ca. 1000 mlJmin should not be exceeded. This is 15 times less than required for our hypothetical sample. Flow-regulated gas supply usually restricts the split flow rate to 500 mLJmin.
Gas Consumption
With a split flow rate of 1000 mLJmin, a large 50 L gas cyl inder is emptied in 7 days. It is unreasonable to exceed such consumption. The split flow rate can be turned down shortly after injection since the high flow rate is only needed during sample evaporation. Automated reduction ofthe split flow rate (gas saver) is available on some instruments.
Resistance in the Split Line
The most obvious problem with high split flow rates is the resistance to gas flow in the split line. Even when the split valve is fully opened (pressure regulation/flow resistance system), it may still be impossible to achieve a split flow rate of 1000 mLJmin (depending on inlet pressure). With mechanical backpressure-regulated systems, the col umn inlet pressure goes out of control. It will be too high because of the pressure drop across the filter, and the user is hardly likely to notice this. Electronic systems avoid the problem, because the pressure sensor is positioned in the gas supply line or septum purge outlet.
Pre-Heating of the Carrier Gas
The incoming carrier gas must be pre-heated before it reaches the vaporizing chamber - otherwise it acts as a coolant in exactly the zone where the sample should be evaporated. The efficiency of such pre-heating is limited. In fact, the tem perature in the upper part of a vaporizing chamber ther
7.2. The Maximum Split Flow Rate
187
mostatted at 350°C was found to drop to 320 °C when the
split flow rate was set at 100 mt/min.
Cooling as a result of high carrier gas flow rates is particu
larly critical for the rear part of the inserted syringe nee
dle, where losses of high-boiling sample material primarily
occur and sensitively react to too Iowa temperature.
Time for Sample Evaporation
The sample liquid leaving the syringe needle should be
evaporated or converted to a fine aerosol before it reaches
the column entrance (split point). For evaporation in the gas
phase after nebulization at the needle exit, the time avail
able depends on the gas velocity in the vaporizing chamber,
i.e. on the split flow rate. If the liquid is deposited on to a packing material, the flow rate is less critical, because the liquid remains there until evaporation is complete.
7.3. Small Sample Vol umes
If we assume a maximum reasonable split flow rate of 1000
mLjmin, the analysis of our undiluted hypothetical mixture
of four components requires the optimization of other vari
ables to remove the discrepancy of a factor of 15. Here we
look at the possibilities of reducing the sample volume be
low 1 ul.,
Evaporation from the Needle
With injection performed manually or by use of autosamplers
imitating manual injection, elution of the sample contained
in the syringe needle can hardly be avoided. Even if a sam
ple volume of "0 Ill" is read on the barrel ofthe syringe, the
0.5-0.7 ~L inside the needle are transferred.
It is not possible to back up a smaller amount of sample by a
plug of solvent (solvent flush injection) because the latter
would produce a solvent peak disturbing the chromatogram.
Hence 0.5-0.7 III is the smallest volume that can be intro
duced in this way.
Fast Autosamplers
Fast autosamplers are designed to avoid evaporation inside
the needle and, thus, eliminate this problem. They enable
reasonably precise and accurate injection of sample volumes
down to about 0.3-0.4 ~L. Smaller amounts are likely to be
incompletely separated from the syringe needle. This can
easily be checked by injecting 0.1, 0.2, and 0.5 III and com
paring absolute peak areas.
High-Boiling Samples
Evaporation inside the needle can be avoided for undiluted
higher-boiling samples. When using 10 III syringes, volumes
down to 0.2-0.3 ~L can be measured with reasonable accu
racy. With 5 III syringes, this lower limit is ca. 0.1-0.2 Ill, but
routine work with their thin plunger is delicate.
Separation from the Needle Tip
When small volumes are injected, the accuracy of abso
lute peak areas, i.e. of sample volumes, tends to be poor
because the liquid is not accurately separated from that re
maining inside the needle. On one occasion, additional liq
188
C 7. High Split Ratios for Reducing the Sample Size uid is pulled from the needle, easily adding 0.1-0.2 ~L to the
volume read on the barrel, whereas on the other occasion
0.1-0.2 ~L remain hanging at the needle tip, particularly if
samples are viscous or the plunger is depressed less rap
idly. Partial evaporation from liquid remaining on the needle
tip distorts the sample composition and results in poor
accuracy even when an internal standard is used.
Plunger-in-Needle (1 J.lL) Syringes
Plunger-in-needle syringes enable accurate measurement of
volumes as small as 0.05-0.1 ~L (Section A2.2). Problems arise
if samples are volatile (as is our hypothetical sample) or dis
solved in a volatile solvent (Section A9). Upon passage
through the septum the needle is rapidly heated, initiating
premature evaporation inside the needle. The first vapor
might be lost through the septum purge. Evaporation ofthe
liquid contained in the narrow space between the nee
dle and the plunger means that an additional 0.2-0.3 ~L of
sample enters the injector. Hence the smallest possible
sample size is ca. 0.3 J.l.L and can only be determined by
calibration with a larger, accurately known volume. The use
of an internal standard helps to overcome poor reproduc
ibility resulting from inaccurate sample size.
For higher-boiling samples not evaporating within the
needle, separation of small amounts of liquid from the nee"
die tip is again the problem, here accentuated by the rather
low velocity of the liquid.
Wet Needle Injection
A simple trick, the "wet needle", technique enables injection
of very small sample volumes even with standard 10 J.l.L
syringes. The syringe needle is filled with sample liquid.
Shortly before injection, the plunger is withdrawn, which pulls
the bulk ofthe liquid into the barrel ofthe syringe, but leaves
a film of sample on the inner needle wall. The needle is
now inserted into the injector and withdrawn after 2-3 s with
out depressing the plunger. This results in evaporation and
transfer of only the sample liquid coating the needle wall,
ca. 0.03-0.06 J.l.L. The amount depends on the viscosity of
the sample and the speed the plunger is withdrawn: slow
withdrawal leaves behind a thinner film.
Wet needle injection is well suited to analyze volatile sam
ples, such as the solvent mixture discussed above, but high
boiling components are likely to remain in the needle. Abso
lute peak areas tend to be poorly reproducible and quantita
tive analysis requires the use of an internal standard.
Conclusion
For volatile samples, the wet needle technique is most ap
propriate. It enables injection of our hypothetical mixture with
a split flow rate of about 500 mLJmin before other factors are
optimized.
For samples boiling above some 150 °C or those con
taining high-boiling solutes, there is no possibilty to reduce
the sample volume below 0.3-0.5 ~L.
7.4. Low Column Flow Rate
189
7.4. Low Column Flow Rate
The split flow rate of 15,000 mLJmin for our hypothetical sam ple was calculated by multiplying a column flow rate of 3 mLJmin by the split ratio of 5000:1. Reducing the column flow rate enables proportional reduction of the split flow rate. This situation is just the opposite of the applica tion requiring maximum sensitivity, where a maximum amount of solute material must be rinsed into the column in a given time.
Narrow Bore Columns
In Section C5.1, short, narrow bore columns were suggested for rapid, isothermal analysis, assuming sufficiently sharp initial bands could be produced by use of high split ratios. This is the application we are now studying from another angle. A carrier gas velocity of 25 crn/s through a 0.10 mm i.d. column produces a flow rate of around 0.15 mU min, which is at least ten times lower than for the same gas velocity through a 0.32 mm i.d. column.
Reduced Capacity of Narrow Bore Columns
The lower column capacity must be taken into account. For the same film thickness, the narrow bore column has a ca pacity maybe 5 times lower (owing to the sharper peaks, capacities decrease more rapidly than column diameters). This must be accommodated either by increasing the split ratio or by use of a thicker film of stationary phase.
Slow Carrier Gas: Nitrogen
A carrier gas velocity of 25 cm/s is within the optimum for hydrogen and, if the column is short, for helium. Helium can be used at 15-20 crn/s, but nitrogen even as low as 8-12 cm/s. If a narrow bore column is used with nitrogen, the column flow rate can be kept as low as 0.05 mUmin. By this means, the split ratio required for our hypothetical sam ple is obtained with a split flow rate of merely 250 mLJmin.
7.5. High Column Capac ity - Thick Films
Our calculation assumed a column capacity of 50 ng for each of the four compounds. Column capacity increases more than in proportion to the amount of stationary phase per unit length of the column or film thickness. In 0.25 or 0.32 mm i.d, columns, film thicknesses of methyl silicones can be in creased up to 5 11m, those of stationary phases of intermedi ate polarity up to ca. 111m. This provides a capacity approach ing or even exceeding 1 Ilg per component, i.e. the mix ture could be analyzed by using a split ratio 20 times lower than assumed.
Increased Retentive Power
A thicker film also increases retentive power, i.e. retention times and/or elution temperatures. If compounds are chrom atographed with comparable retention times in columns with a tenfold thicker film, elution temperatures are nearly 50° higher. This is an advantage for the analysis of volatile and adsorptive compounds, but a drawback for those eluted at elevated temperatures. Increased film thicknesses lead to somewhat reduced separation efficiency, partly because dif
190
C 7. High Split Ratios for Reducing the Sample Size fusion in the stationary phase becomes time-consuming. The latter requires reduced carrier gas velocities and prefer ably "slow" carrier gases, such as nitrogen [37,38]. This is, however, compatible with our interest in keeping split flow rates low.
7.6. Length of the Sy ringe Needle
long syringe needles were recommended for split injection aiming at high sensitivity, firstly to release the sample close to the column entrance and, secondly, to prevent expansion of sample vapor backwards out of the chamber. Neither ar gument remains valid if split flow rates are high.
No BackfJow at Split Flow Rates Exceeding 75 ml./min
If 1 ul, of liquid could be injected and evaporated within 0.2 s (which is considered rapid), the vapor generated (about 0.25 ml) would expand at a rate of 75 mLlmin. If the flow rate through the injector is 75 mt/min, the vapor just replaces the carrier gas and there is no risk of sample vapor flowing backwards out of the chamber.
Needle Entering Liner by 10mm
Short syringe needles release the sample far away from the column entrance, which prolongs the time available for vaporization and achieving homogeneous distribution across the liner. Further it enables heat to be absorbed from a long section of the liner. The syringe just needs to deposit the sample safely in the vaporizing chamber, i.e. enter it by ca. 1 cm. This means that syringes with needles ca. 25 mm long are best suited (depending on the design of the injec tor head).
Reduced Problems Arising from Evaporation inside the Syringe Needle
If the sample evaporates within the syringe needle, the vol ume unintentionally transferred from a 25 mm needle is re duced to about 0.25 ~L and the smallest amount which can be injected (reading 0 ul, on the barrel) becomes correspond ingly small. With short syringe needles, even manual injection can often prevent evaporation inside the needle, because the short, less pliable needle can be introduced more rapidly and merely reaches into the upper region of the injector which is, or can be chosen to be, substantially cooler than the center of the injector.
Partial Introduction of the Needle
The length of the shortest needle considered standard is 37 mm. Shorter needles can be ordered for 5 or 10 ul, syringes, but not for 1 ul, syringes since the volume inside the needle would then become too small. Instead of using special syringes, needles of standard sy ringes can be introduced only partially. For some auto samplers the depth of the injection point can be adjusted by programming the movement of the syringe. For manual injection, a spacer tube is useful so that the depth is reproducible (see Figure C13).lf used frequently, it is convenient to glue the spacer tube to the bottom of the
7.6. Length of the Syringe Needle
191
barrel of the syringe. It should have an internal diameter closely fitting the outer diameter of the needle, to hinder bending of the needle during penetration of the septum. A piece of 0.5 mm l.d, x 1/16 inch o.d. stainless steel tubing is suitable. The drawback of this makeshift is that the rear of the needle which remains outside the injector is also warmed, and there may still be evaporation if injection is not performed sufficiently rapidly.
Glue Septum
Spacer
=n n110
11=*6== Septum purge
Carrier gas
mm
II I IInjector liner FigureC13 Split injection at high split flow retes: the syringe needle should enter the liner by ca. 10 mm only. If syringe needles are longer than needed, a spacer tube can be used to repro duce positioning of the needle outlet.
7.7. SummBrizing Guide lines
2 3
4
5
Use a narrow bore capillary column (0.1-0.2 mm i.d.) at a low flow rate, possibly with nitrogen as carrier gas. Choose a column with a thick film of stationary phase for high capacity. Use a wide bore liner containing well deactivated glass or quartz wool (but an empty liner if the sample contains labile components). Inject the smallest volume of sample possible. If evaporation in the needle can be avoided, 1 or 10 ~L syringes can be used. If the sample is volatile, try the wet needle injection technique. Quantitate by use of an internal standard. Apply the smallest split flow rate not causing over loading of the column.
192
C 8. Problems Concerning the Split Ratio
8. Problems Concerning the Split Ratio 8.1. Purposeful Search for Errors
Split injection is a complex process in which many things may go wrong. Because there are no simple procedures for eliminating all problems, the analyst must regularly check the accuracy of his results. This is not always simple, be cause the common determination of reproducibility, e.g. by injecting a mixture of standards three times, does not rule out serious errors.
8. 1. 1. Systematic Errors
Before beginning a discussion ofthe mechanics of what might happen to distort the results, the perspective of the analyst should be considered. He injects and obtains peak areas anvthinq in between is a black box. It takes several experi ments to find out whether these peak areas correspond to what they should be and whether the results are sufficiently accurate. It takes several more experiments to locate the source of the problems if there are any.
Puzzling Deviations
Quantitative analysis with split injection is often demand ing, because there can be deviations which are difficult to define and of which we have nothorough grasp. Results may, for instance, be different from one day to another, or upon returning to a method after some time, even though we be lieve we have reproduced all the conditions. There is, of course, no magic behind it, but the lacking insight into the processes occurring during injection confronts the ana lyst with tough riddles.
The Fault of the Analyst or the Technique?
Literature and reports at conferences generally tend to paint a rosy picture. Even in personal contact problems are mostly played down, perhaps because people do not want to admit their trouble. All too often poor results resulting from imper fections inherent in a technique are mistaken as personal incapability. Analysts usually commit fewer "silly" mis takes than they think and they overestimate the pe.... fection of a technique. Many analysts play around until results get better. Often they go through an optimization the background of which they do not understand.
Insidious Systematic Errors
Among the deviations, those causing systematic errors are most troublesome. Systematic errors occur, for instance, if a deviation is different for the calibration mixture and the sam ples. Systematic errors are insidious, because they are diffi cult to recognize. How can systematic errors be detected?
8.1. Purposeful Search for Errors
193
8.1.2. Message from Standard Deviations
Experiments to detect errors frequently concentrate on the
determination of standard deviations, i.e. of random errors,
considering standard deviations as indicative of accuracy.
Such statistical thinking probably originates from purely
physical processes, where the results are commonly scat
tered around the correct value and deviations obey statisti
cal rules.
Standard deviations are, indeed, a measure for probable ac
curacy if systematic errors can be ruled out, for instance when
(almost) identical solutions are compared under same con
ditions and the system performance does not drift. In chro
matography this seldom occurs, however.
Maybe standard deviations are as indicative of errors as are
body temperatures for illness - high standard deviations are
an alarm signal, but low standard deviations do not rule out
a malignant illness.
Larger Differences between Laboratories
It is well known, for instance, that deviations between the
results reported by different laboratories usually far exceed
the standard deviations of the results obtained by each
participant (reproducibility and repeatability). This tells us
that systematic errors are involved, often larger than the ran
dom errors determined by the measurement of standard
deviations. Large deviations are common even if all labora
tories seem to apply the same method, showing that not all
the relevant factors are under control.
Random Deviations
Standard deviations are the result of deviations from the
correct result. When shooting at a target, deviations in all
directions might be of similar probability. The mean value
would then be close to the target (true result) and the stand
ard deviation a good measure for the precision and accu
racy of shooting. In this example, random deviation predomi
nates and the standard deviation is an appropriate measure
of the deviation.
Systematic Deviations
In GC, however, deviations tend to move in a given di
rection. The averaged results of repeated analyses can be
far away from the true value (systematic error). The stand
ard deviation is then a measure of the reproducibility of
the deviation from the correct result and might be far
smaller than the systematic error, i.e. provide a misleadingly
encouraging evaluation of the method.
The expansion of the sample (solvent) vapor upon sample
evaporation, for instance, changes the split ratio. The devia
tion always has the same direction, the extent depending on
instrument design and conditions. The standard deviation
measures the reproducibility of this deviation - but the ana
lyst wanted to know whether or not there is a devia
tion, not whether it is reproducible.
In chromatography, quality assurance by repeating analy
ses many times gives the feeling of "having done some
194
C 8. Problems Concerning the Split Ratio thing", but easily turns out to be an alibi rather than an ef fective search for problems.
Knowledge about Systematic Errors
The detection of reproducible deviations requires more pur poseful experiments. Comparison with results obtained by an independent method would, of course, be most desirable, but this is often impossible because none is available. Fur thermore, when the results obtained from two methods are different, it is usually difficult to determine which is more correct. Thus there is usually no alternative to searching for errors within the method applied. Purposeful recognition of systematic errors presupposes knowledge about them to enable the critical checks to be performed and the application of methods of quantltation which are immune to the errors.
Overemphasis of Problems
Throughout this treatise on injection techniques, but particu larly in the following sections, we concentrate on problems and stress how badly they can distort the results. We do so assuming that these chapters are consulted when problems occur. Of course, for many analyses there are no such diffi culties, and we hope that the reader is sufficiently experi enced to maintain a balanced evaluation of the tech
nique. The Three Types of Problem
The three main problems in quantitative analysis by split in jection are:
sample evaporation; the split ratio, which often deviates from that adjusted; the composition of the sample material entering the column, which can easily be different from that in the injector (non-linear splitting). The first was treated in Part B, the last two are the subjects of this and the following chapters.
8.2. "Pre-Set" versus "True" Split Ratio
An important source of error is directly or indirectly related to alteration of the split ratio by the injection. The propor
tion of the sample material entering the column does not correspond to that expected from the ratio of the gas flow rates. Deviations frequently amount to a factor of 1.5-5, but factors as high as 30 have been observed.
The "Pre-Set" Split Ratio
The "pre-set" split ratio [39] corresponds to that adjusted as described in Section 2. It is determined by the ratio of the gas flow rates directed to the split outlet and entering the column, both measured before injection. It could also be called the "adjusted" or "expected" split ratio.
The "True" Split Ratio
The "true" split can only be determined after the analysis by calculating the proportion of sample which actually entered the column. A split/ess or on-column injection is performed to assess the peak area of a solute if all material entered the column. The peak area obtained from the split
8.2. "Pre-Set" versus "True" Split Ratio
195
injection divided by that from the non-splitting method yields
the true split ratio.
Actually the true split ratio is the average effective split
ratio resulting from a ratio which changes during sample
introduction.
8.3. Mechanisms Caus ing the Split Ratio to Deviate
There are several reasons why the true split ratio deviates
from that pre-set. Their description helps to identify the
source of the problems so that appropriate action can be
taken.
8.3.1. The Pressure Wave
Rapid sample evaporation in the vaporizing chamber pro
duces a relatively large volume of vapor. In displacing a cor
responding volume of carrier gas it produces a pressure
wave. This expansion occurs within a very short time - a
process resembling an explosion. It upsets the adjusted split
ratio, often exactly at the time the sample is being split.
Volume of Vapor
The volume of vapor produced from the 1-2 III of liquid sam
ple commonly injected is easily underestimated: 2 III of liq
uid creates a vapor cloud with a volume from 0.3 to more
than 2 ml (primarily depending on the solvent). The internal
volume of a 2 mm i.d. liner is ca. 0.25 rnl., that of a 4 mm i.d,
chamber 1 mL. Hence the vapor volume is comparable with
the volume of the injector itself.
Pressure Increase
If the sample vapor has, e.g., a volume corresponding to that
of the vaporizing chamber - which is already filled with car
rier gas - the amount of gas to be housed in this chamber is
doubled, which should cause the absolute pressure to
double. If the inlet pressure is, e.g., 100 kPa (200 kPa abso
lute pressure), the pressure should increase to 300 kPa (400
kPa absolute). This does not happen because the chamber is
open, both backwards towards the carrier gas supply and
forwards to the split outlet. The expanding sample vapor dis
places carrier gas, pushing it into the tubings and cavities
accessible around the chamber. Because these volumes are
several times larger than the vaporizing chamber, pressure
increases by much less than a factor of two. If, for instance,
the volumes around the vaporizing chamber are nine times
larger, the pressure increase is calculated as 10 % (rela
tive to the absolute pressure).
Effect on the Column Flow Rate
Expanding sample vapor generates a pressure wave propa
gating from the center of evaporation. For hot needle injec
tions it is located just below the exit of the syringe needle.
The pressure wave affects all the gas flow rates includ
ing those into the column and towards the split outlet. Flow
rates change in a complex manner and the effect on the split
ratio is difficult to predict.
In Figure C14, the changes in the pressure at the column
entrance and the flow rate into the column are shown
schematically for the pressure regulator/flow resistance type
196
C 8. Problems Concerning the Split Ratio carrier gas supply system. A rapid increase in pressure in creases the flow rate into the column inlet far more than in proportion to the pressure, because it compresses the gas in the inlet rather than increasing the flow rate through the whole column (period A). As the pressure starts to decrease (period B), the flow rate into the column drops and, if the column inlet pressure exceeds the (reduced) pressure in the injector, there even might be some flow backwards out of the column.
Time
'..........I.....f - - - - - - - - · · I.....I - -
A
8
c
Figure C14 Qualitative diagram of pressure and flow changes caused by explosive sample evaporation in the injector.
Different Effects on Split Flow Rate at Different Times
The split flow is affected by a similar wave, but whereas the pressure wave is sharp and hard at the column entrance, it loses much if its thrust when entering the split outlet. As a result, the flow rates entering the column and leaving through the split outlet change by different amounts at differenttimes and the split ratio fluctuates to values above and below the pre-set value.
Splitting of the Sample
Consideration of the moment at which the sample vapor is split shows the situation to be even more complicated. When the syringe needle releases the sample near the col umn entrance, the pressure wave primarily pushes sample vapor into the column. If the sample is released further from the column entrance, the vapor cloud might reach the col umn entrance at the time when the pressure decreases and the flow rate into the column is low or even reversed. The moment at which the vapor reaches the split point also de pends on the split flow rate and the size of the vaporizing chamber.
8.3.2. Dependence of the Pressure Wave on Gas Regulation
The two carrier gas regulation systems described in Section C1.3 react to the pressure wave in different ways. The man ner and speed in which they compensate for the extra volume added by the injection influence the build up of the pressure wave and the changes of the flow rates.
8.3. Mechanisms Causing the Split Ratio to Deviate Pressure Regulator/Flow Resistance
197
The pressure regulator/flow resistance system (Figure C15) reacts to a pressure increase by stopping further gas supply to the injector. The split flow rate increases in the pro portion to the pressure increase. If, for instance, pres sure increases from 100 to 105 kPa (which is more than is normally observed), it increases by 5 %. The pressure regulator re-opens after a volume correspond ing to that of the sample vapor has been released. If, for in stance, 1 mL of vapor is created and the split flow rate is 60 ml/min, discharge of the extra volume takes 1 s. Hence this kind of system re-establishes normal conditions only after a period of time which is long compared with the splitting process.
Regulator stops gas supply Evaporating sample produces expanding vapor
~l
S lit outlet Resistance (e.g. needle valve) keeps relatively constant split flow rate
Column
Figure C15 Reaction of the pressure regulatorlflow resistance system towards expanding sample vapor during sample evaporation.
Flow/Backpressure Regula tion
The system with the flow regulator upstream of the injector introduces the carrier gas at a constant rate irrespective of pressure changes in the vaporizing chamber (Figure C16). The extra volume generated by sample evaporation is re leased by an increase in the split flow rate. Upon pressure increase, the backpressure regulator opens fully to re establish the column head pressure - it controls pressure, not really the split flow rate.
Constant carrier gas supply into injector
Evaporating
sample produces
expanding vapor
Split outlet
Column
Regulator opens until column head pressure is reduced back to normal
Figure C16
Reaction of flow!backpressure regulation to expanding sam
ple vapor.
198
C 8. Problems Concerning the Split Ratio
Changed Flow Rates
With backpressure regulation, pressure waves are weaker than with the pressure regulator/flow resistance system. An extra volume of gas corresponding to the vapor volume cre ated upon sample evaporation is released immediately. How ever, suppression of the pressure wave solves the prob lem from the wrong end: because the column flow rate remains fairly constant, the split ratio increases sharply. It is not the pressure wave which is of concern, but the change of flow rates.
Pressure regulation with flow resistance is preferable, because it keeps variations in the split flow rate small. The relatively pronounced pressure increase causes the split and column flow rates to change in the same direction, even though hardly by the same extent. 8.3.3. Recondensation in the Column Inlet
Recondensation of sample vapor in the column inlet is prob ably the mechanism with the largest potential to cause deviations between the true and the pre-set split ratio.
Contraction upon Recondensation
A~ low
oven temperatures, extensive recondensation of sam ple vapor can occur in the column inlet just below the at tachment to the hot injector (Figure C17). Recondensation results in a drastic reduction in volume (a factor of 150 1500). As incoming vapor practically disappears, the pres sure in the column inlet drops and causes additional vapor to be sucked into the column.
Injector insert
Oven roof
Partially recondensed sample Column entrance
Figure e17
Volume contraction resulting from recondensation of sam
ple vapor in the column inlet causes additional vapor to be
sucked into the column, with the effect that more material
is chromatographed than expected from the pre-set split re
tio.
Reduced Split Ratio
As a result, the flow rate into the column inlet far exceeds the column flow rate imposed. As the split flow rate remains unaffected, the split ratio is reduced and more sample material enters than is expected from the pre-set split ra tio.
8.3. Mechanisms Causing the Split Ratio to Deviate
199
Solvent or Non-Diluted Sample
To effect a noticeable change in the split ratio, a substantial proportion of the gas/vapor mixture must recondense. For dilute solutions, this presupposes recondensation of solvent vapor, i.e. a column temperature clearly below the boil ing point of the solvent. If the sample does not contain solvent, a large amount of solute material must recondense.
Experimental Data
Figure C18 shows peak areas obtained from 2 ~L split in jections of n-octadecane solutions (200 ppm) in different sol vents at different column temperatures. The injector tempera ture was 300 °C. A 2 mm l.d, liner accentuated the effect be cause it restricted dilution of vapor with carrier gas. It con tained some glass wool to ensure complete evaporation of the higher-boiling solutions also. The distance between the needle exit and the column entrance was 2 cm (71 mm nee dle). At 25 °C, the pre-set split ratio was 100:1. The split flow rate was kept constant for all injections. As the column flow rate decreases with increasing column temperature, the pre-set split ratio increased somewhat with increasing column tem perature. The peak areas to be expected from the pre-set split ratio were calculated by dividing the area obtained from a splitless injection by the pre-set split ratio (broken line). The peak areas obtained varied by a factor of nearly 10. At column temperatures above the solvent boiling point, about twice as much sample material entered the column than was expected from the pre-set split ratio. This might have been the result of the pressure wave. The deviation was, in fact, somewhat greater for the violently evaporating pen tane than for the octane solution. peak area
-~~~!!.~--!~~-------------" 20
60
100
150
column temperature
200 during injection (00
Figure C18 Dependence of peak area on the sample solvent and on the column temperature during injection. The peak area to be expected from the pre-set split ratio (Ncalculated area") is indicated by a broken line. (From ref. [40]).
200
C 8. Problems Concerning the Split Ratio
Recondensation 10-30° Below the Solvent Boiling Point
When the injection was performed at column temperatures ca. 10-30° below the solvent boiling point, the amount of sample entering the column increased rather dramatically. This agrees with the experience in splitless injection that effective solventtrapping, based on solvent recondensation, presupposes a column temperature at least 20-30° below the solvent boiling point.
Dew Point
Recondensation presupposes a column temperature below the dew point of the vapor/carrier gas mixture. For instance, 25°C below the standard boiling point, the vapor pressure is roughly 0.5 bar. At an inlet pressure of 0.5 bar ti.e. 1.5 bar absolute pressure), recondensation occurs if the vapor con centration in the gas phase entering the column exceeds 33 'Yo. Then vapor recondenses until its concentration in the carrier gas is reduced to 33 % (the partial vapor pressure corresponding to saturation). More dilute vapor recondenses only when the column temperature is lower.
8.3.4. Incomplete Evapo ration
I~ the sample liquid is "shot" towards the column entrance as a band of liquid and passes the latter before being evapo rated, the split ratio is determined by the probability of the liquid hitting the column entrance rather than by the gas flow rates. This probability is influenced by the ratio of the cross sections of the vaporizing chamber and the col umn entrance, but also by possible repulsion ofthe liquid by the hot column wall. If the sample vapor is not homogeneously distributed across the liner, similar problems are expected, although with less drastic effects.
Poor Reproducibility of Absolute Peak Areas
For incompletely vaporized samples it is typically observed that absolute peak areas are poorly reproducible - "large" chromatograms are followed, in an unpredictable manner, by others with small peaks. In most instances, variations are within 30 'Yo, but under extreme conditions, they can reach a factor of 10-20.
Sample in n-Octane
Peak areas obtained from a solution in n-octane were usu ally 2-5 times smaller than expected from the pre-set split ratio [401. indicating that most of the liquid passed by the column entrance (empty 2 mm i.d, liner). In one chro matogram out of about ten, however, peaks were eas ily ten times larger. Not knowing the background, most analysts would probably assume a misplaced sample vial or another silly error. The large peaks are, however, merely a sign of having scored a direct hit of the column entrance.
8.3.5. Cool Split Line
In many instruments the tubing of the split outlet line imme diately leaves the heated zone of the injector and passes through cool regions of the instrument towards the restrictor determining the split flow rate. If sample vapor reconden
8.3. Mechanisms Causing the Split Ratio to Deviate
201
ses within this tube, its volume is reduced and the flow rate into the split line increases, just as described above for recondensation in the column inlet. Because this increases the split flow rate, the split ratio is increased and the peaks obtained are too small. For high-boiling solvents, deviations by up to a factor of five have been observed. Cool Needle Valve
Recondensation can also occur in the flow restrictor, such as a needle valve, at the end of a warmed split outlet line. The resulting contraction in volume again causes the split ratio to increase. The condensed liquid may also block the valve for a short time, with the opposite effect. Because hot split valves are inconvenient and electric regu lators cannot be heated, there is no perfect solution to the problem; the restrictor should, however, be warmed to at least ca. 50°C to rule out the possibility of recondensation of the solvents most commonly used.
8.3.6. Charcoal Filters
Many split injectors are equipped with a charcoal filter situ ated between the vaporizing chamber and the restric tor in'the split line. Originally they served to absorb sol vent vapor and to prevent vapor with a viscosity different from that of the carrier gas changing the flow rate through the restriction (needle valve). Today, the main function ofthe charcoal filter is to prevent contamination ofthe electric valve regulating the split flow rate. If the charcoal really absorbs the solvent vapor (and this can be expected only if it is regularly replaced), it has a nega tive effect stronger than the intended positive effect. When it removes the solvent vapor, it removes part of the incoming flow and causes an increase of the split flow rate similar to that resulting from the recondensation effect (re moval might be even more complete).
8.3.7. Buffer Volumes
Buffer volumes (empty cavities) with capacities of several milliliters, inserted between the vaporizing chamber and the restrictor at the split outlet, were suggested as a means of delaying passage of the sample vapor through the split valve. The intention was similar to that of charcoal filters. Vapor with a viscosity different from that of the carrier gas should flow through the restrictor only after all the solute material has passed the split point.
Pressure Wave Increases the Split Flow Rate
Sometimes it has been claimed that a buffer volume also solves the problem of the pressure wave, because the vol ume of vapor generated would be smaller relative to the larger space available. Additional readily accessible space prevents a high pressure wave, indeed, but if the extra vol ume of vapor is dissipated in the buffer volume, the pres sure wave is flattened by increasing the split flow rate.
202
C 8. Problems Concerning the Split Ratio
8.4. Minimizing the Deviation from the Pre Set Split Ratio
8.4. 1. Wide Injector Liner
8.4.2. Long Distance between Needle Exit and Column Entrance
Experimental Results
There is no way of completely avoiding deviations from the pre-set split ratio. Here the major factors are listed to help the analyst to avoid large deviations. Methods must be made immune to deviating split ratios by other means.
A wide-bore (e.g. 4 mm l.d.) liner results in a smaller pres sure wave, because the volume of vapor generated is smaller relative to the space available. The recondensation effect is weakened by dilution of the vapor with carrier gas. Dilution has two positive effects. It reduces the dew point of the vapor/gas mixture, i.e. recondensation occurs only at a lower column temperature. Secondly, recondensation from a diluted vapor phase results in less of a pressure reduction and less additional vapor be ing sucked into the column. There are three main reasons for releasing the sample from the syringe needle a long distance from the column entrance. 1 The pressure wave pushes carrier gas rather than sample material into the column. 2 Mixing of vapor with more carrier gas reduces the effi ciency of the recondensation effect. 3 The sample is given more time for evaporation and homogenization across the liner. A long distance is achieved by using short syringe nee dles. Short needles can be used if the split flow rate is high enough (50-100 mL/min) to ensure that the vapor does not expand backwards out of the liner. It is also achieved by us ing a long vaporizing chamber - which is no longer a vari able, however, once the instrument has been bought.
Table C5 lists experimentally determined effects of sol vent recondensation on the split ratio in terms of fac tors by which the peak areas obtained with a column tem perature of 30°C were larger than those obtained at 200°C (column temperatures well below and well above the boilTable C5 Effect of solvent recondensation on the split ratio. Depend ence on the internal diameter of the vaporizing chamber and on the distance between the needle tip and the column en trance. Factors by which peak areas Obtained at an oven temperature well below the solvent boiling point exceeded those at an oven temperature well above it. (From ref. [40]).
Vaporizing chamber i.d. [mm]
Recondensation Effects Needle-column distance 24mm 58mm
3.6
14 1.5
5.5
2
2
1.1 1.5 1.3
8.4. Minimizing the Deviation from the Pre-Set Split Ratio
203
ing point ofthe solvent, n-octane, 125 DC). These results (cor rected for the lower column flow rate at high oven tempera tures) do not consider the effect of the pressure wave - the true split ratio might have deviated from that pre-set by a factor larger than listed. 1 III (plus ca. 1 III eluted from the needle) of a 200 ppm solution of n-pentadecane in n-octane was injected with a pre-set split ratio of 100:1. Syringes with needles 71 or 37 mm long were used, leaving 24 and 58 rnrn, respectively, between the needle exit and the column entrance. The injector was used with liners of 2 or 3.6 mm i.d., or without a liner (5.5 mm i.d. cavity, possible with the injector design of the Carlo Erbal Fisons GC Mod. 4160). Conclusions
2
Injections with the long syringe needle result in a clear reduction of the recondensation effect when the narrow bore liner was replaced by the 3.6 mm i.d. tube. Further enlargement to 5.5 mm i.d, had little effect. Reduction of the recondensation effect upon injection with a short needle is substantial.
8.4.3. Small Sample Volumes
Small sample volumes reduce the effects on the split ratio. They facilitate evaporation, keep the pressure wave low, and weaken recondensation by stronger dilution with carrier gas.
Dependence of the Recondensation Effect on Sample Volume
Table C61ists absolute peak areas obtained by injecting dif ferent volumes of a 200 ppm solution of n-pentadecane in n octane. At a column temperature of 30 DC, the pre-set split ratio was 100:1. Use of a 2 mm Ld.liner and a 71 mm syringe needle accentuated the recondensation effect. Table C6 Dependence of peak area [integrator area counts x 10.3] on sample volume and column temperature during injection.
Temperature [OCI
30 60 100 140 200
Sample volume
1 III
2 III
3 III
35 27 21 15 11
510 360 180 26 19
640 490 330 48 28
200°C Column Temperature
Peak areas at a column temperature of 200 DC were approxi mately proportional to the volume of sample injected. Accurate determination of the sample volume was a prob lem: the volume expelled from the needle had to be added to that read on the barrel of the syringe.
1J1L Injection
At 30 DC, injection of 1 III resulted in a peak area ca. three times larger than at 200 DC. Nearly half of this difference arises
204
C B. Problems Concerning the Split Ratio
from the reduction in the column flow rate at the higher tem perature, i.e. from the increase in the split ratio. The other part of the deviation was probably a result of recondensation.
2 ul: Injection
At 30°C, doubling the injection volume resulted in a peak area increased by a factor of almost 15. The area was about 15 times too large in comparison with that ob tained after injection of 1 III at 200°C (bearing in mind the changing split ratio). The large increase in peak area was observed when the column temperature was reduced from 140 to 100 °C (to 25° below the solvent boiling point). The recondensation effect became still stronger, however, when the temperature was reduced from 60 to 30°C, because the lower vapor pressure resulted in more complete reconden sation. The drastic recondensation effect observed with 2 III injec tions shows the importance ofthe concentration of vapor in the carrier gas: the more complete displacement of the carrier gas by the larger vapor cloud produced a gaseous phase which recondensed (disappeared) almost completely in the cool column inlet.
Larger Injection Volumes
Peak areas obtained with the column at 30°C were far from proportional to sample volume. After the dramatic increase from 1 to 2 Ill, areas increased by merely 35 % when the sample volume was doubled again to 4 ul., This is not sur prising, considering that the true split ratio obtained with the 2 I!L injection was less than 7: 1 instead of 100: 1 and the split ratio was no longer determined by the gas flow rates adjusted before injecting.
Poor Reproducibility
Absolute peak areas strongly influenced by the reconden sation effect tend to be poorly reproducible, because the dis tribution of sample in the injector, i.e. the concentration of vapor in the gas entering the column. is not under control. Small errors in reading the sample volume might also be amplified and have a disproportionately strong ef fect. If, for instance, 1.6 III is injected instead of 1.5 III (a difference of 6 %), the peak area could be more than dou bled, owing to reinforced recondensation.
8.4.4. Volatile Solvents
For analyses starting at low column temperatures, a volatile solvent should be used. Pentane is, for instance, preferable to hexane if injection is performed at a column temperature near ambient.
8.4.5. Packed Liner
If oven temperatures are sufficiently high to rule out recon densation in the column inlet, large variations in absolute peak areas are an indication of incomplete sample evapora tion. Methods for improving sample evaporation were dis cussed in Section B. Use of a deactivated glass wool packing was one of these.
II !
8.8.4. Minimizing the Deviation from the Pre-Set Split Ratio
205
Retention of Solutes until the Split Ratio is Restored?
Packings could also be useful in another respect. They might retain the solute material above the column entrance until the adjusted split ratio is restored, i.e. keep them out of the turbulent processes during solvent evaporation. Deposition on a packing presupposes release of the sample liquid from the needle as a band (no thermospray). It cools a small area of the packing to the solvent boiling point. The temperature returns to that of the injector only after sol vent evaporation is complete, which easily takes a few sec onds. High-boiling solutes will be vaporized only then. In the meantime the pressure wave has been dissipated and car rier gas free from solvent vapor enters the column and the split outlet, ruling out recondensation effects. No data are available on this approach. Success might de pend on the volatility of the sample material. Severe dis crimination could occur if the sample contains solutes which are volatile enough to follow the solvent vapor and others evaporating with significant delay. The volatile solutes will then be split by the deviating ratio whereas for the high-boil ing components the split ratio could be close to that adjusted.
8.5. Experimental Re sults
Kaufman and Polymeropoulos [41] investigated the pressure wave and its dependence on several factors. Because a Hewlett-Packard 5890 instrument with a HP 7673A fast auto sampler and flowlbackpressure regulation was used, the pressure wave was rather weak and normal pressure re-es tablished rapidly - although at the expense of an accentu ated increase in the split ratio. Pressure measurements were performed by means of a pres sure transducer with a response time of less than 1 rns, in stalled in the septum purge line 15 cm from the injection port. The adjusted split flow rate was usually 100 mLlmin.
8.5. 1. Results Concern ing Pressure Wave
Sample Volume, Injector Temperature
The plot on the left in Figure C19 shows the pressure waves measured for injections of 1-5 III hexane (injector with a
76
0.2
0.4
0.6 TillE, •
0.8
1.0
1.2
1.4 00
0.2
0.4
0.6 TIllE, •
0.8
1.0
1.2
Figure C19 Pressure waves generated by split injection in dependence of the sample volume (left) and the injector temperature (right). 3 III injections. (From Kaufman and Polymeropoulos [41]).
206
C 8. Problems Concerning the Split Ratio
4 mm i.d. liner at 200°C). Waves clearly increased with larger sample volumes. For the 1 III injection, the pressure increase was less than 2 %, for 5 III it reached ca. 10 % ofthe inlet pressure. Waves initiated by 3 III injections of hexane at injector tem peratures of 100-400 "C are shown at the right. Increasing the injector temperature caused the waves to become sharper and higher, because evaporation was faster.
Duration of Evaporation
Ifthe pressure increase can be interpreted as the consequence of expanding solvent vapor, the curves suggest that solvent evaporation took ca. 0.1 s at an injector temperature of 400°C and ca. 0.2 s at 200°C. This is short compared with the visual observations described in Section B.
Sample Solvent
Isooctane generated a weaker pressure wave than hexane, which is explained by the slower evaporation. Sol vents which evaporate with difficulty or form a vapor cloud larger than that from hexane were not tested. Methanol, which produces three times more vapor per volume of liq uid than hexane, is expected to produce a higher wave; wa ter, with six times more vapor, would be extreme.
Split Flow Rate
The plot on the left in Figure C20 shows the effect of the split flow rate on the pressure wave initiated by a 1 III injec tion of hexane (injector temperature, 200°C; 4 mm i.d. liner). As expected from the discharge of the vapor, the highest flow rate generated the sharpest wave (some 50 ms width at half height); the pressure increase persisted for ca. 200 ms when the split flow rate was only 15 mLJmin. The pressure decrease below the value regulated is probably a result of delayed closure of the regulator valve.
Injector Liner
As expected, the narrow-bore liner resulted in a stronger pres sure wave than did the wider bore inlet. Results from the
71
r - - - - - - - - - - - - - - - - - - - - , .---.,------:-..,..-------------,
.. SOOmUmin
'.
'.
:\2 mmi.d.
:" / mm i. d., Cup '. 4 mmi.d. ldw-"".J... / ".,••:::..:::::.:•....;;'
......
~
87 +-_---.-~-r~~_r_----.-~-r~-.-----l.t-~__,_-~_,_--_r_~--,--~-,-~-_,J 1.0 0.8 0.8 1.2 0.4 1.0 1.2 0.0 0.2 0.8 0.8 0.2 0.4 0.0 TIllE, • TIME••
Figure C20 Pressure waves generated by 1 III injections of hexane at an injector temperature of 200 °C. left, effect of split flow rate; right, effect of liner. (From Kaufman and Polymeropou/oB [41]).
8.5. Experimental Results
207
packed liner were not significantly different from those from the open tubular liner of the same diameter (4 mm i.d.).
8.5.2. Cou,se of the P,essu,e Wave
Kaufman and Polymeropoulos used their data to model the course of the pressure wave. The data refer to a fast auto sampler 1 III injection of a solution in hexane into a 4 mm l.d, liner at 200°C (conditions causing a relatively weak pres sure wave). The pre-set split ratio was 100:1.
Fluctuation of the Split Ratio
As shown in Figure C21, the flow rate leaving the split out let increased far more rapidly than the column flow rate, with the effect that the split ratio rose by a factor exceeding five. After 100 rns, it dropped to half the pre-set split ratio and resumed the normal level 200 ms after injection. Thus total variation exceeded a factor of ten. 600
500
0
400
i= c II:
!::
.... Q.
Split ratio set at 100: I
300.
III
200
100
V
a 0.0
0.2
0.4
0.6 TIME,s
0.8
1.0
1.2
Figure C21 Predicted split ratio after a 1 III injection of hexane using a flow/backpressure regulator system. (From Kaufman and Po'ymeropou'oB [41]).
Effect on the True Split Ratio
The authors concluded that the error in the average split ratio was merely 6 %. They assumed that the 1 ml vapor izing chamber was homogeneously filled with sample vapor and that splitting took 1 s (the time to replace the volume of the chamber twice). The data can be interpreted differently, however. 1 III hexane produces about 150 III of vapor. If this is diluted 1:1 with carrier gas, a 300 III volume is split. At a split flow rate of 150 mLJmin (split ratio of 100:1 at a column flow rate of 1.5 mLJmin), splitting takes 0.12 s, which corresponds to the period of worst deviation and is plausible because sample evaporation and discharge of the vapor is the cause of the deviation. Then the deviation exceeds a factor of two.
Delayed Splitting of Sample
The effect of the fluctuating split flow rate on quantitative analysis is influenced by the moment when the solutes are split. Passage of the solvent and the most volatile solutes by
208
C 8. Problems Concerning the Split Ratio the column entrance is delayed by the gas volume between the vapor cloud formed by sample evaporation and the column entrance. If a 51 mm syringe needle releases the sample into packing placed at the needle tip (Figure C22), this volume is about 440 III (4 mm i.d. liner). For the 1 III hexane injection, this might be just about enough to delay the arrival of the first vapor at the column entrance until the main wave has been dissipated.
Height of septum cap
Depth of the packing
Length of syringe needle
Figure C22
Position of the center of sample evaporation within the va
porizing chamber.
If 2 III of a solution in methanol are injected and the 1.5 ml of vapor are diluted to a cloud of ca. 3 rnl., this buffer volume is too small and the delay is no longer significant. As the wave of high split flow rates is then far broader, almost all vapor from the solvent and co-evaporated solutes will be split during the wave. It is another question whether the sol utes reach the split point with an additional delay.
8.5.3. Data on True Split Ratios
Bannon et al. [421 claimed that large deviations of the true split ratio from that pre-set were a result of "poorly designed injector inserts, either in the form of empty tubes or tubes packed with only a small amount of glass wool" .In fact, when fatty acid methyl esters in isooctane were injected at more or less isokinetic split flow rates (Section C9.2.1, split ratios of 180:1 to 470:1), true split ratios seldom deviated by more than 10 Ofo from the pre-set value. Experiments were performed on a Hewlett-Packard instru ment with backpressure regulation. Liners were either packed with glass wool or contained a "Jennings cup" and a pack ing both of glass wool and of Gas Chrom Q coated with 10 % SE-30. The column temperature was 160 "C, which ruled out recondensation effects.
8.6. Working Rules to Prevent Systematic Errors
209
8.6. Working Rules to Prevent Systematic Errors
The measures mentioned above help avoid drastic deviations from the true split ratio, but do not eliminate them completely. There are two ways of avoiding systematic errors: the true split ratio is frequently checked, necessitating comparison with peak areas obtained by a non-splitting method, or the quantitation procedure is selected such that it is im mune to deviations in the split ratio. Because the latter is the more convenient approach, it is usually the way to proceed.
8.6.1. No Quantitation on the Basis of the Pre Set Split Ratio
The first rule: do not calculate amounts or concentrations on the basis of the (pre-set) split ratio; assume that we cannot tell how much solute material enters the column. If we need to know the absolute amount, and this happens rarely, a non-splitting method must be applied, preferably on-column injection.
Hypothetical Story
This rule is illustrated by a story, which has certainly never happened. It is common practice to demonstrate the sensi tivity ,of a GC-MS system by split injection of a solution of methyl stearate. The salesman may propose the following procedure: to introduce 1 ng of the compound, 1 III of a 50 ng/ III solution is injected at a (pre-set) split ratio of 50:1. In this way, 1 ng of methyl stearate should reach the ion source. If he injects this sample as a solution in octane (justifying the solvent in terms of its preventing evaporation from the vial) and uses a low column temperature during injection, the true split ratio might well be 5:1. Thus 10 ng methyl stearate en ter the system, and the resulting impressive peak should ef ficiently promote the sale. Apart from the problem concerning the split ratio, how was the 1 III volume determined? Did it include the sample ma terial inside the syringe needle completely, partly, or not at all? This error cannot, however, greatly exceed a factor of two.
8.6.2. Use of the Intemal Standard Method
The internal standard method is independent of the split ratio, because the deviation from the true split ratio is equal for the internal standard and for the solutes of inter est. Nor is reproducibility of absolute peak areas important. A known amount of a compound not present in significant quantity in the sample is added as an internal standard. The concentrations or amounts of the components of interest are calculated from the ratio of the peak areas, possibly taking into account response/correction factors.
Method of Standard Addition
Analysis by the method of standard addition also becomes independent of the split ratio when another peak in the chromatogram is used as a reference (as a kind of inter nal standard). In the first run, the area ratio of the compo nent of interest and the reference compound is determined. A known quantity of the component of interest is then added
210
C 8. Problems Concerning the Split Ratio to the sample and the analysis is repeated. The change in the area ratio corresponds to the known amount added, whence the amount present in the original sample can be calculated. This method does not require knowledge of the identity of the reference component, nor its concentration in the sample.
8.6.3. Apply the Extemal Standard Method with Caution
The external standard method involves comparison of abso lute peak areas from a calibration run and the analysis. A solution containing known amounts or concentrations ofthe compounds of interest is analyzed to calibrate absolute peak areas. Then the sample is analyzed and the resulting peak areas are compared.
Avoid Whenever Possible
The external standard method is widely applied for quanti tation with packed column GC or LC. In capillary GC, how ever, it tends to be avoided, particularly if split injection is involved, because it can easily lead to large systematic errors.
Selective Detectors
The external standard method is difficult to circumvent if a highly selective detector is used since the choice of com pounds available as internal standards is limited. In other cases, there is simply no empty space in the chroma" togram, into which an internal standard peak would fit.
Constant Deviation of the True Split Ratio
The external standard method does not require that the true split ratio be equal to that pre-set, but the true split ratio obtained on injecting the sample must be equal to that obtained for the calibration mixture; if a series of samples is analyzed, the true split ratio must be equal for them all. In other words, the deviation of the split ratio must be constant. This implies that all factors affecting the split ratio must be reproduced.
Sample Volume
The sample volume must be kept constant because it influences the pressure wave, the completeness of sample evaporation, and (via the concentration in the carrier gas) the recondensation effect in the column inlet. Incomplete elution of sample material from the syringe needle usually, however, renders accurate increase of the sample volume impossible anyway. If, for instance, a sample is so dilute that a well integratable peak cannot be obtained, the problem must not be solved by increasing the injection volume of the sample alone. The amount of material entering the column often increases out of proportion. Calibration must also be repeated.
Split Ratio
The column and the split flow rate must remain constant, because they influence sample evaporation, the pressure wave, and the recondensation effect in many ways. The ef fects of the pressure wave and of recondensation are usu ally stronger at lower split flow rates.
8.6. Working Rules to Prevent Systematic Errors Sample Matrix
211
The most common systematic error arises from dif ferences between the matrices of the calibration mix ture and the sample. By sample matrix we understand those parts of the sample which influence the evaporation characteristics (including the amount of evaporation and the pressure wave), the recondensation effect, and possibly other mechanisms affecting the split ratio. For dilute samples, this is primarily the solvent; for others, the split ratio is influ enced by elevated concentrations of sample impurities. For undiluted samples, the characteristics of the whole sample are important.
Examples
2
3
Contaminants, e.g. tetrachloroethylene, in drinking water can be analyzed as extracts in pentane. Suit able initial column temperatures vary between 25 and 45°C. With the intention of avoiding rapid evaporation of the solvent, the external standard mixture might be prepared in hexane or even heptane. Because such an external standard mixture is likely to recondense whereas the water extract does not, the concentrations determined will be excessively low. For the determination of benzene in gasoline, gaso line is often injected at a high split ratio to avoid the need for dilution. Because it is difficult to find an inter nal standard fitting into such a complex mixture, the analyst might prefer the external standard method. To facilitate the separation of benzene from the solvent peak, he might prepare the solution in pentane. This will lead to excessively high benzene concentrations, be cause gasoline is likely to recondense, whereas pentane does not. No solvent imitates gasoline except gasoline itself and, hence, there is no reliable way of quantitation by this approach. The analysis could be performed by stand ard addition. If the benzene concentration is expected to be around 5 %, 10 % benzene is added and the sam ple is re-analyzed, possibly by use of a reference peak as described for the internal standard method. "rhioglycollic acid was to be determined in a hair perm preparation. Direct injection with glass wool in the liner produced a reasonable peak. To circumvent the determination of a response factor, the external stand ard method was chosen. The composition of the sam ple matrix was unknown. Water as solvent for the exter nal standard resulted in a thioglycollic acid concentra tion of 12 %; when a solution in ethanol was used, the peak of the external standard was larger and only 7 % was calculated. Which result is correct? The problem was solved by diluting the sample 1:10 with ethanol, such that the sample matrix was domi nated by a known solvent. Now the concentration meas ured Was near 5 %, which happened to be close to the correct result.
212
C 8. Problems Concerning the Split Ratio
A Case History: Tetrachlo roethylene in Waste Water
Tetrachloroethylene was to be determined in a waste water from a textile printers. From the strong smell, the tetrachlo roethylene concentration was estimated to be ca. 100 mg/l, which can easily be analyzed by split injection of the aque ous sample and use of FID. The injector temperature was 270°C; a 3.6 mm i.d. liner and a 71 mm syringe needle were used. The pre-set split ratio was 50:1. Because no water-soluble internal standard could be found on the shelf, it was decided to apply the external standard method. It turned out to be impossible, however, to prepare tetrachloroethylene solutions in pure water at concentrations in excess of ca. 20 mg/l (addition of some detergent would have solved this problem), and so the external standard solution was prepared in hexane. The following results were obtained (integrator area counts): Waste water External standard (100 mg/l in hexane)
12,300 7,700
Concentration in waste water
160 mg/l
How accurate was this result? Special care was required, be cause it was likely that the results would be used in a court of law. Normal procedure: determination of relative stand ard deviations. Waste water, RSD Standard solution, RSD
8%
4%
From this it was concluded that the results should be accu
rate to within some 10 %. Are standard deviations really suit
able for assessing accuracy? Certainly not!
To confirm the above results, 50 ml waste water was ex
tracted with 50 ml hexane, resulting in a virtually equal con
centration in the extract as originally in the sample. This ex
tract was injected under the same conditions.
Hexane extract area counts
2,600
Concentration in waste water
34 mg/l
As this result was way beyond the range of the standard deviation, a third experiment was performed to determine which of the two results was correct. 0.5 III of a 3 mg/l solu tion of tetrachloroethylene in water was injected on-column (on to a column coated with Emulphor, a polyglycol type sta tionary phase), then the same volume of the 1:10 diluted sam ple. The resulting concentration was 37 mg/l, confirming that the result was ca. 35 mg/l, not 160 ± 16 mg/L. The above error was primarily a result of extensive recon densation in the column inlet. As the column temperature was ambient, both water and hexane recondensed, with the
8.6. Working Rules to Prevent Systematic Errors
213
benefit that large peaks were observed because the true split ratio was well below 50:1. Because recondensation of water was much greater than that of hexane (different sizes of vapor clouds), the split ratio was ca. five times smaller. Maybe the true split ratio for the standard solution in hexane was 15:1, whereas that for the sample was near 3:1, i.e. a third of the sample entered the column despite the fairly high pre-set split ratio.
9. Problems Concerning Linearity of Splitting 9.1. "Linear" Splitting
"Linear" splitting, a term introduced by Ettre and Averill [7) in 1961, implies that all sample components are split by the same ratio. This also means that the small portion of material entering the column has the same composition as the sample in the injector. Linearity of splitting does not presuppose that the true split ratio is equal to the pre-set split ratio - such deviations are hardly ever noticed anyway.
Discrimination
The other important expression frequently used in this con text is "discrimination". When related to sample splitting, "discriminative" is synonymous with "non-linear". "Discriminative" is, however, more broadly used: several other mechanisms are discriminative, e.g. evaporation in the syringe needle, adsorption in the injector or the column, and unstable detector sensitivity [43). The part of the sample "discriminated" against produces peaks which are too small compared with the part of the sample represented by the larger peaks (understood, of course, as peak areas relative to the amounts present in the sample). If discrimination arises as a result of non-linear splitting, the part of the sample discriminated against is split by a higher ratio than is the rest of the sample. This leaves open whether the small peaks result from losses (i.e. whether they are really too small) or whether too much of the other sample material entered the column.
Discrimination Caused by Evaporation in the Syringe Needle
Non-linearity of splitting has been discussed since the early sixties. Until ca. 1980, the importance of discrimination caused by selective losses in the syringe needle had not been recognized; losses of high-boiling material in the nee dle were wrongly attributed to an increased split ra tio for these components. The commonly observed reduction in peak sizes towards el evated elution temperatures, considered to be the major prob lem arising from non-linear splitting, is mostly a result of the correspondinq material not even having entered the injec
214
C 9. Problems Concerning Linearity of Splitting tor. To find out whether or not non-linear splitting contrib utes to such discrimination the material left in the syringe needle must be re-injected ("needle rinse injection", Section A5.2).
Non-Linearity: An Unre solved Problem
The problem of non-linear splitting is complex. There is no generally linear splitting injector, nor are there gener ally applicable concepts or working rules describing how to ensure linear splitting. Below we describe the causes of non linearity, but it must be left to the analyst to find the most appropriate solution to his problem, maybe on the basis of the strategies discussed in SeetionC10.
9.2. First Cause of Non Linear Splitting: Diffusion Speeds
The mechanisms of three causes of non-linear splitting will be described below. All were conceived in the minds of ana lysts trying to explain puzzling results. The experimental support is usually weak because of interferences from other deviations and limited opportunities for direct obser vation. In 1967, Bruderreck et al. [81 studied the influence ofthe dif ferent rates of diffusion of the sample components on the linearity of splitting. Atthe column entrance, vapor is forced to change direction, because the linear velocity of the car rier gas entering the column usually differs from that pass ing it by (Figure C23).
% Deviating vapor
lUll L
Disturbed Flow by column end face
Split flow )
Capillary column Column Flow
Figure C23
At the column entrance. sample vapor is diverted: molecules
of different sizes differ in mobility and will deviate by differ
ent amounts.
Traffic Jam
The situation at the column entrance can be compared with a traffic jam. If the velocity of the gas phase entering the column is smaller than that passing it by, the column acts as a hindrance and solute molecules must change direction. Small molecules, with a higher speed of diffusion, are more easily diverted than heavy molecules, or (to stay with the picture of the traffic jam) the large molecules make their way
9.2. First Cause of Non-Linear Splitting: Diffusion Speeds
215
into the column pushing the small ones aside, as do trucks in a stream of cars and bicycles. The system resembles the jet separator of a GC-MS interface for packed column GC. Hence, if the column acts as a hindrance, the high molecular-weight solutes are enriched in the material analyzed and the volatiles are discriminated against. Bruderreck et al. [81 proposed a splitting system which would compensate for at least some of the differences in diffusion speed. Although excellent data were reported, the system never became popular, and this aspect of discrimination seems to have been forgotten. 9.2.1. Isokinetic Splitting
In 1982, Purcell [321 listed (among other prerequisites for lin ear splitting) the "isokinetic behavior" ofthe gas/vapor mix ture at the column entrance. Isokinetic splitting means that the linear velocities of the gas and vapor enter ing the column and passing it by are equal. No further explanation was given, and this was probably derived from the work cited above (although it was not cited).
Sacrifice of Flexibility
Isokinetic splitting requires sacrifice of an important advan tage of split injection: the flexibility of adjusting the split ra tio to the concentration of the components in the sample. The split flow rate is now determined by the gas velocity into the column. Table C7 lists the split flow rates providing isokinetic split ting at different column flow rates. They depend on the col umn and liner diameters. An equation for calculating the split flow rate from the dead time of the column and the column inlet pressure was given by Bannon et al. [441. Results show that the split flow rates required are rather high. Table C7 Isoklnetic split flow rates for different column diameters, column flow rates, and liner diameters.
Liner diameter
lrnrnl
Column flow rate lrnt/rninl
[rnm]
Isokinetic split flow rate Imt/rninl
0.20
1
0.32
2
2 4 2 4 2 4
100 400 77 310 193 770
Column diameter
5
Liners Adjusted to the Split Ratio
Isokinetic splitting at low split ratios presupposes narrow bore liners. This contradicts another requirement: for low split ratios, a large liner volume is needed in order to retain the sample vapor in the vaporizing chamber and to keep devia tions of the split ratio as low as possible.
216
C 9. Problems Concerning Linearity of Splitting This dilemma could be avoided by the use of liners with constrictions in the split area (Figure C24), enabling in stallation of the column entrance at the position where the ratio ofthe cross sections ofthe liner and column correspond to the split ratio required.
-
Room to store vapor
Isokinetic splitting with column entrance at suitable height
Column
Split outlet
Figure C24 Liner enabling isokinetic splitting to be achieved at low split flow rates.
9.2.2. Insufficient Experi mental Evidence
If taken seriously, isokinetic splitting would have far reach ing consequences on split injection. Experimental evi dence supporting the need for it is, however, not convincing. Purcell did not publish experimental results. Bannon et al. found results to be optimum when the split flow rate "was at or not too far away" from that appropriate for isokinetic sam pling (deviations by a factor of less than two). They did not, however, stress it as an important point, nor is their evidence overwhelming. Marshall and Crowe (66) obtained linear split ting at a split flow rate half that required by isokinetic split ting, but severe discrimination was not demonstrated when deviations were larger.
End Face of the Column
If the disturbance of the flow at the column entrance were of such importance, the effect of the column end face would have to be considered. Seen in the direction of the gas flow, the face of a fused silica capillary column end consists of a ring with a surface area slightly exceeding that ofthe bore of the capillary. When glass capillaries were used (and most of the tests on split injection were performed with glass capil laries), the area of the face of the column end was more than 6 times larger than the cross-sectional area of the column bore. At the face of the column end, the gas velocity is zero and deviation ofthe vapor is complete. Because the column face is circular, the deviations of vapor inwards into the column bore and outwards towards the split outlet are different, which should greatly disturb the linearity of the splitting proc ess.
9.2. First Cause of Non-Linear Splitting: Diffusion Speeds
217
9.2.3. Conclusion
From the experience that linear splitting is possible when the gas velocities into and by the column entrance differ by a factor of 10, at least, it seems that the different diffusion speeds of the sample components are not an important source of non-linear splitting; this is particularly so in comparison with the two other mechanisms to be described below. Unless there is convincing evidence ofthe need for isokinetic splitting, the ease of use and flexibility of adjusting the split ratio should not be sacrificed.
9.3. Second Cause: Incomplete Sample Evaporation
Sample evaporation in empty liners or in liners containing obstacles (baffles, "inverted cup", or cup liner) is often in complete, particularly if a fast autosampler is used or the sample is in a high-boiling matrix.
9.3. 1. Vapors and Drop lets Split at Different Ratios 2 3
A jet of liquid or relatively large droplets is "shot" to wards the column and split at a ratio more or less deter mined by whether or not it hits the column en trance, not by the adjusted gas flow rates (Figure C25). Vapor and small droplets are transported by the carrier gas and split by the ratio of the gas flow rates. When droplets and vapor are split at different ratios, components primarily located in the droplets will be split by a ratio different from that for the gas phase. Syringe needle
:":. r; '
Sample vapor trans
ported by carrier gas,
split by the ratio of gas flow rates
liquid sample "shot" towards the column, split at a ratio determined by whether or not it hits the column entrance
..-;.•. ..:,~~
t:l~,"m" entrance
Figure C25
Splitting of incompletely evaporated sample.
9.3.2. Neat Samples
The problem of non-linear splitting is particularly severe
for undiluted samples containing components with a wide
range of boiling points, such as mineral oil fractions, typi
cally ranging from C4 to C40 alkanes.
Immediately after leaving the syringe needle, the most vola
tile components start evaporating whereas the higher
boiling components remain in the non-evaporated liquid. The
218
C 9. Problems Concerning Linearity of Splitting
temperature of the liquid (its boiling point) rises and further solute material evaporates, shifting the limit between the vaporized components and those still left in the liquid phase towards higher-boiling points. When such partially evapo rated sample material reaches the column entrance, the volatiles in the gas phase are likely to be split by a ratio dif ferent from that experienced by the high-boilers in the liq uid. Chaotic Discrimination Pattern
At first sight, results from such mixtures often seem to be chaotic. A range of components is partly lost (discrimina tion), but neither the range of the components discriminated against nor the extent of the discrimination is reproducible. With a second effort, it can at least be explained why results turn out like this.
Discrimination against Volatiles or High Boilers?
Incomplete sample evaporation may cause discrimination against either the high-boiling or volatile components. If the liquid is split at a higher ratio than the vapor, the high boilers are discriminated against compared with the volatiles. The reverse situation is possible, but more sel dom observed. If the split ratio determined by the gas flow rates is low (a large proportion of the vapor enters the column), the prob ability of non-evaporated material "falling" into the column is generally lower, i.e. the solutes in the liquid phase are split by a higher ratio and will be discriminated against. If, on the other hand, the gas phase is split at a high ratio or a large proportion of the liquid happens to reach the column, this is likely to discriminate against the volatile components. At the intermediate split ratios most commonly used, it seems that discrimination against the high-boiling compo nents is more frequent. The probability of the liquid hit ting the column is small, as is confirmed by the finding that the true split ratio for incompletely evaporated samples is usually higher than the pre-set split ratio (see Section C8.3.4).
Discrepancy between Split Ratios
The resulting discrimination depends on the split ratios for the vapor and the liquid. The first is fairly reproducible whereas the second is usually not. The discrepancy between the two split ratios determines the extent of the discrimination. The reproducibility of splitting the liquid phase deter mines the reproducibility of the deviation.
Extent of Sample Evapora tion
Discrimination affects solutes up to or beyond a certain limit. Assuming that the liquid is split at a higher ratio than the vapor, the higher-boiling compounds are discriminated against, i.e. the chromatogram shows that for the compo nents eluted above a given elution temperature the peaks are too small. This limit (elution temperature) is a function of the extent of solute evaporation when the sample reaches
9.3. Second Cause: Incomplete Sample Evaporation
219
the split point. When evaporation is more advanced. higher-boiling components are vaporized and split by the ratio of the gas flow rates. Poor Reproducibility
When sample evaporation is incomplete, the reproducibility of absolute and relative peak areas is usually poor. This is obvious when the described mechanisms are considered. The split ratio for the liquid is poorly reproduc ible, because the liquid is unevenly distributed across the liner, whereas the split ratio for the vapor is fairly constant. This accords with the common experience that chromatograms furnish fairly constant peak areas for the volatile compounds, but more widely varying areas for the high boilers (although there are also other rea sons for this). The proportion of the sample which vaporizes is not reproducible. With a "shot" straight down the liner, a smaller amount of sample material evaporates than if at least part of the sample is nebulized. Hence the limit beyond which the sample is primarily split in the liquid phase is not reproducible.
9.3.3. Dilute Solutions in Solvents
Incomplete evaporation is, however, not a required condi tion for non-linear splitting. It causes non-linearity only if the components of interest are distributed differently in the vapor and droplet phases. In particular, splitting remains linear if the sample material is completely retained by the droplets - and this is a situation frequently encountered for samples diluted in solvent.
Negligible Solute Evapora tion during Solvent Evapora tion
The samples most frequently analyzed are strongly diluted with a dominating solvent. The temperature of the droplets or jet of liquid is, hence, near the solvent boiling point. Such cool liquid retains all the higher-boiling components, i.e. those eluted after the solvent peak, the solvent acting like a gas chromatographic stationary phase (even though it moves). Thus the components of interest are likely to be lo cated in the liquid phase and are split linearly - although often at a poorly reproducible split ratio and possibly far from that pre-set.
Complete Evaporation of Parts
Partial evaporation of the sample components can resulot from 1 a substantial vapor pressure over the unevaporated sam ple liquid, i.e. partitioning between the droplet and the gas phase, or 2 complete evaporation of part of the liquid. For in stance, small droplets split away from the main jet of liquid and are likely to be fully evaporated earlier than the rest of the liquid. Whereas the first scenario inevitably results in different amounts of the solute material in the gas and droplet phases, the effects of the second scenario are less obvious.
220
C 9. Problems Concerning Linearity of Splitting Complete evaporation of some droplets releases the volatile
and high-boiling components into the gas phase, with the
effect that the composition of the solute material in the gas
and in the remaining liquid is the same; splitting should still
be linear. The released solute material, or maybe only the
high-boiling components, might, however, be picked up again
by the remaining droplets.
9.3.4. Conclusion
The effects of incomplete sample evaporation on quantita
tive results are complex. The reasons for this were outlined
above. There is no need for a more detailed description, be
cause it is preferable to cure diseases than to concentrate on
their diagnosis.
Improvement of sample evaporation was a subject of
Part B. Here it should be remembered that the injector tem
perature is not the main factor influencing sample evapora
tion. What is more important is whether the sample is dis
solved in solvent, how it is injected (fast autosampler?), and
how much is injected (cooling effect).
9.4. Third Cause: Fluctu ating Split Ratio
Splitting also becomes non-linear if the following two situa
tions occur in combination [451:
1 the split ratio changes (fluctuates) during splitting of
the sample; and 2 the sample is pre-separated before reaching the split point, causing different parts of the sample to reach the split point at different times and, hence, at different split ratios.
9.4.1. Variation of the Split Ratio
In the preceding section, the true split ratio was frequently found to deviate from that pre-set by factors up to ten. True split ratios considered there represented average effective split ratios, including, e.g., a small deviation at the begin ning of the splitting process, a large deviation in the middle, and again a small one at the end. The deviation of the true split ratio from that pre-set is not constant during the split ting process, and the maximum deviation from the pre set ratio is likely to substantially exceed that from the average effective split ratio. Figure C21 showed the calculated course of the split ratio during an injection initiat ing a weak wave. Nevertheless, the split ratio increased five fold.
A Hypothetical Course of Events
Figure C26 shows the possible course of changes in the split ratio during an injection, assuming a gas supply sys tem of the pressure regulator/flow resistance type, and that the pressure wave overlaps with recondensation in the column inlet. The pressure wave initiated by injection in creases the flow rate into the column. As the first vapor recondenses in the column inlet, further vapor is sucked into the column, farther reducing the split ratio. Dilution of the remaining vapor in the injector soon weakens the recon
9.4. Third Cause: Fluctuating Split Ratio
221
densation effect and, finally, the decrease in the pressure in the injector reduces the flow rate into the column even be low normal.
-A
Injection
1
Pressure wave ~
/
/
Recondensation Average true
- - - 1 , - - - - - - - - - 1 - - - - - split ratio
Split ratio
I
I 8,m", eo'ering column
~.Time
Figure C26 Changes in the split ratio during injection. assuming that first the pressure wave and then recondensation reduce the split ratio. The true split ratio. as manifested by the size of the peaks. corresponds to the effective average split ratio over the splitting period - and might well be different for different solutes. because a high-boiling component tends to be vaporized later or split over a longer period. 9.4.2. Pre-Separation of the Sample in the Injector
When all sample components are split at the same moment
(reach the column entrance simultaneously), a varying split
ratio causes all the peaks to be too large or too small, but the
sample composition (relative peak areas) is correct and split
ting is linear.
A fluctuating split ratio affects the linearity of splitting only if
the sample is pre-separated before reaching the column en
trance. For instance, one component is mainly split at a mo
ment of high split ratio, whereas most of another is split when
the split ratio is low. Several processes result in fractiona
tion of the sample inside the injector.
Transfer from the Syringe Needle
When sample material evaporates from the syringe needle,
transfer occurs in order of increasing boiling point. High
boiling solutes may leave the needle when most of the
sample has left and its internal surface is warmed up again,
provided there is still solvent evaporating at the rearto carry
it out of the needle.
If commonly used volatile solvents are used, this delay can
not be more than a few hundred milliseconds, because
rapid withdrawal of the syringe needle does not increase
losses of high-boiling compounds.
222
C 9. Problems Concerning Linearity of Splitting
Faster Droplets
Droplets containing the high-boiling sample material move faster than the vapor comprising the volatiles (50-200 km/h compared with 300 rn/h at a split flow rate of 60 mt/rnln). This enriches the high-boiling compounds at the front of the vapor cloud.
Fractionating Evaporation
The most important fractionation occurs during sample evaporation from surfaces, such as packing materials. The site is first cooled to the solvent boiling point and cooling continues until solvent evaporation is complete, ab sorbing heat from a larger region. Then temperature in creases again, releasing higher-boiling solutes in order of increasing boiling point. Solvent evaporation from a glass wool packing easily takes several seconds and it probably takes another few seconds to bring temperature back to that thermostatted.
Adsorption and Retention on Contaminants
Adsorption on active surfaces in the injector delays split ting of some ofthe solute material easily by several seconds or even a few minutes. Retention in a layer of non-evapo rated material deposited during previous injections might have the same effect.
Deviation from Linearity
The extent of distortion of the composition of the sam ple entering the column (the deviation from linearity) is de termined by the amplitude of the fluctuation of the split ratio during splitting and the extent to which the sample is frac tionated in the injector.
Risk Factors
It is difficult to define when to expect severe non-linearity of splitting from fluctuating split ratios. Maybe listing some fac tors contributing to strong deviation of the split ratio and fractionation of the sample is useful. Strong pressure wave: large sample volume; solvent producing large vapor cloud; narrow liner. Recondensation of the solvent (column at least 20° be low solvent boiling point) or of a non-diluted sample. Packed liners. Fast autosamplers. Adsorptive and high-boiling sample components. Samples ranging from components co-evaporating with the solvent to high boilers.
9.4.3. Cognac as an Example
Vanillin and syringealdehyde had to be measured in a Cognac to determine whether its yellowish color was really derived from storage in an oak barrel or from addition of caramel and flavor. Oak releases vanillin, but vanillin must be added when the color is derived from caramel. Syringeal de hyde has no influence on the flavor and originates from oak. Its concentration should reach a certain level and be similar to that of vanillin.
9.4. Third Cause: Fluctuating Split Ratio
223
Recondensation to Increase Sensitivity
Concentrations should be just below 1 mg/L. An attempt was made to analyze them by split injection of the sample itself. Because sensitivity was critical (FlO), the recondensation effect was exploited by use of a long syringe needle, a nar row liner, and a column temperature during injection of 50°C. The split flow rate was 30 mLJmin, providing a pre-set split ratio of ca. 12:1. Two reasonable peaks were, indeed, ob served, confirming that the proportion of the material enter ing the column far exceeded that to be expected from the pre-set split ratio.
Replacement of Liner Caused Peaks to Disappear
Reproducibility of relative and absolute peak areas was, however, unsatisfactory. Because adsorption was expected to occur in the liner, a new liner was installed. Now vanillin and syringealdehyde disappeared completely from the chromatogram, whereas most ofthe other peaks were unaf fected.
Adsorption on the Liner Delayed Splitting
Did the two compounds of interest remain in the injector and accumulate there? Of course not! Theyalso passed the split point, but with some delay. Adsorption on the liner surface
retained them during the period when recondensation was causing the large flow into the column. When the two components of interest were released, seconds later, the split ratio had returned to the much higher pre-set level. At this increased split ratio, peaks became undetectable in the rather complex mixture. Deactivation of the Liner
The problem was solved rather crudely: red wine was in jected four times at intervals of 2 min, keeping the split valve permanently closed (splitless injection), the septum purge widely open, and the column flow rate low (in order to in crease the residence time of the wine in the injector). This treatment deactivated the liner and brought the two peaks back.
Reduced Split Flow Rate
To obtain better reproducibility, the split flow rate was reduced to 5 mLJmin. This, however, resulted in a strongly tailing, broad "solvent" peak and a high, disturbed baseline, the latter mainly as a result of degradation of other material in the injector. It could be avoided by increasing the split flow rate to 50 mLJmin 30 s after injection, because the deg radation products generated later then entered the column only at a high split ratio.
9.5. Danger of System atic Errors
If discrimination is poorly reproducible, the results are im precise. This is a nuisance, but at least the problem is easily recognized. More dangerous are systematic errors, as they are difficult to detect. Of course, this warning once more relates to more "difficult" samples, but how does the ana lyst recognize "difficult" samples?
UNlVERSlPAD DE ANTIOQUlA
SlDUOTBCA CENTRAL
224
C 9. Problems Concerning Linearity of Splitting
The Problem of Calibration
Effects of discrimination are commonly compensated for by use of correction factors (often erroneously called "re sponse factors"). A mixture of the components of interest in pure solvent is injected and the correction factors thus de termined are applied to the sample. It is assumed that the correction required for the sample is the same as for the cali bration, i.e. that the mixture of standards imitates the devia tions affecting the analysis of the sample. But how should we reproduce mechanisms causing discrimination if we do not know them? All too easily the processes are differ ent and the correction factors turn out wrong.
Example
Evaporation of a clean mixture of standards is easier than that of a sample containing high-boiling or involatile material. These sample by-products inevitably form drop lets which retain sample components. Evaporation of the calibration mixture and the sample is, therefore, different. Hence discrimination is likely to be different and the correc tion factors do not really correct the deviation.
Sample Matrix more Impor tant than Solutes
During method development one usually concentrates on the solutes of interest; the solution of standards is prepared in a solvent selected rather carelessly. The process of split ting depends, however, at least as much on the solvent and the sample by-products as on the solutes.
Misleading Tests with Simple Standard Mixtures
The literature is full of papers on the feasibility of certain analyses and the accuracy obtained. Unfortunately all too often the test exclusively involves solutions of standards in solvent, although the real problems are generated by the by products. The low standard deviations determined can be misleading. Many authors seem to have found fewer prob lems than were reported by others, wrote a paper on this, and only after despatching the paper looked at real samples. Then the follow-up paper on the application of the method to samples, promised in the conclusion, usually never ap pears!
Tests by Standard Addition
Calibration and optimization of conditions, such as in jector temperature or packing of the injector, should be per formed with samples to which standards have been added. Requirements resemble those discussed for the calibration of absolute peaks areas by the external standard method (Section C8.6.3). Reproduction of discrimination phenomena tends to be even more difficult than that of split ratios, al though the errors hardly reach a factor of five.
10.1. Systematic Search for the Best Conditions
225
10. Techniques for Improving Quantitative Analysis Previous sections have discussed the basic conditions for quantitative analysis by split injection and the problems which can arise. They have demonstrated that there are no simple recipes ensuring precise and accurate results. This section summarizes the subject from the point of view of coherent strategies. Only liquid samples are considered, be cause it is the vaporization step which causes most of the problems. Pragmatic Approach
In practice, the experimental results are relevant, and ifthey are satisfactory, nobody would spend much effort in finding out why. Concepts become import8!nt only if results do not meet the needs or expectations. They help find ing the origin of the problem, and which of the many factors involved needs improvement.
10.1. Systematic Search for the Best Conditions
If results are unsatisfactory, there is hardly an alternative to the trial and error approach, varying conditions to see whether or not results improve. This, however, easily ends up as lengthy groping around in the dark. The search must be purposeful.
10.1.1. Strategy: Mini mized Deviation
Chromatographers tend to trust in an almost unlimited ef fectiveness of correction factors, believing that all the problems possibly occurring, such as non-linear splitting, loss inside the needle, adsorption on surfaces, or varying split ratios, can be offset by correction factors. This is not true. The deviations are often poorly reproduc ible and easily introduce systematic errors if they depend on factors which vary from one sample to another or from the calibration to the sample. If a result deviates from what it should be by, e.g., a factor of ten, even a modest variation of this deviation strongly affects precision.
The Three Steps
A more systematic approach involves the following three steps. 1 The "correct" result (peak area or area ratio) is esti mated to determine the extent of the deviation currently obtained. 2 Conditions are optimized in the direction which mini mizes the deviation. 3 Only the minimized deviation is corrected by cali brated factors.
226
C 70. Techniques for Improving Quantitative Analysis Reproducibility usually improves automatically when the dif ference between the actual and the correct result diminishes, and the danger of systematic errors is reduced.
10.1.2. Determination of the Correct Result Estimated Peak Area
Sometimes the correct result can be estimated from the peak area to be expected in comparison with another, more easily chromatographed component, such as a hydrocarbon of in termediate molecular weight. This presupposes that the de tector response is known or can be estimated. An estimate of the response is often possible for the flame ionization detector (FlO), because the response of the hy drocarbon part of the molecule tends to be constant. The proportion of heteroatoms and highly oxidized carbon in the molecular weight is estimated and considered as not con tributing to the FID response.
On-Column Injection
A test by on-column injection is often most indicative. The sample is diluted by a factor corresponding to the split ratio to furnish data on absolute peak areas (checking the split ratio) and on relative areas (linearity of splitting, discrimina tive losses in the needle, or adsorption). To obtain directly comparable peak areas, on-column injec tion must be performed on the same instrument (detector) as used for the analysis. Ideally, the instrument is equipped with an on-column injector, enabling a simple change from one injector to the other. Otherwise on-column injection must be performed without such an injector, i.e. directly into the column inlet dismounted from the split in jector for the duration of the injection. Such a procedure is described in Section D5.6.2.
Degraded Components, Artifacts
Analysis by on-column injection also enables discovery of components missing from the chromatogram, because of degradation in the injector, or of artifact peaks formed by degradation of other sample material. For instance, high concentrations of furfurol were found in a brandy. This was interpreted as a sign of excessively high temperatures during distillation ofthe beverage and the prod uct was rejected. It turned out, however, that most of this furfurol was not present in the sample, but was "synthesized" in the injector!
10.2. Flash Evaporation
The strategies presented below should assist the optimiza tion process. After a short description of the concept, the critical parameters are discussed, with the intention of sug gesting directions in which to experiment.
10.2.1. Concept
The classical means of obtaining linear splitting involves rapid ("flash") sample vaporization and mixing with car rier gas before the sample material reaches the split point. Fast evaporation and rapid passage through the injector are prerequisites for obtaining sharp initial 'bands.
10.2. Flash Evaporation
227
Thermospray
The observations made with the perylene experiment indi
cate that flash evaporation presupposes nebulization of the
sample liquid at the needle exit.
It is impossible to achieve flash evaporation after injection
with band formation, e.g. by using a fast autosampler. Af
ter deposition on to a packing or trapping between obsta
cles, evaporation of the solvent alone easily takes several
seconds and leaves behind a cool zone which must return to
the injector temperature before the high-boiling solutes can
be vaporized. This does not correspond to flash evaporation.
Hot Needle Injection
Efficient and reliable nebulization at the needle exit requires
partial solvent evaporation inside the syringe needle. Opti
mization ofthe syringe handling technique leaves little room
for variation. The best thermospray and the least discrimi
nation as a result of losses inside the needle are obtained by
hot needle injection.
Several modern autosamplers are capable of withdrawing
the sample liquid from the needle and injecting after an ad
justable needle preheating time, i.e. of performing hot nee
dle injection.
10.2.2. Selection of Conditions
Some of the variables discussed below can be optimized from
basic considerations. Others need testing and experimental
adjustment for the particular application.
Empty liner
Flash evaporation occurs in the gas phase of the empty space
in the vaporizing chamber. Hence an empty liner serves the
purpose. This minimizes contacts with active surfaces and
prevents fractionation of solutes according to volatility, which
has been described above as a source of non-linear split
ting.
Mixing Devices
It has been claimed that obstacles improving the homoge
neous distribution of the vapor across the vaporizing cham
ber prevent that a stream of concentrated vapor hits the col
umn entrance during one injection whereas during the next
it largely bypasses it. They should improve the reproducibil
ity of absolute and relative peak areas. Mixing could be es
pecially important when wide bore liners are used. The cup
and laminar liners are the most promising (see Section C10.5).
Reported positive experience with mixing devices contrasts
with findings that there is no significant improvement. In fact,
violent nebulization and expansion of the vapor might well
form a plug filling the cross section of the liner and thus en
suring homogeneous distribution without special effort.
Visual observation suggests this.
Injection of Diluted Samples
Nebulization presupposes a volatile sample matrix that
serves as a propellant for the thermospray. This agrees well
with the experience that dilute solutions tend to provide bet
ter results. Dilution also ensures that the droplets remaining
228
C 10. Techniques for Improving Quantitative Analysis after vaporization of the volatiles are smaller and more uni
formly dispersed in the gas phase.
This means that samples should be diluted as much as pos
sible. To achieve the required sensitivity, injection of more
dilute solutions means that the split ratios must be re
duced. Indeed, experience seems to confirm that it is pref
erable to inject, e.g., a 10 times more dilute sample at a 10
times lower split ratio.
Readily Evaporating Solvent
In general, the solvent has a greater influence on the
evaporation process than the components to be ana
lyzed. Solvents should not be selected merely on the basis
of solubility. It is often advantageous to dilute a sample dis
solved in a poorly evaporating solvent by a better solvent.
Solvents of low surface tension spray the sample into fine droplets from which the solutes evaporate relatively easily. They include the alkanes (maybe with the ex ception of cyclohexane) and ether. Solvents consuming a large amount of heat on evapo ration (e.g. alcohols) are more difficult to spray. The boiling point of the solvent should be at least 1000 below the injector temperature.
High Injector Temperature
The operating condition probably first thought of in the con text of flash evaporation is the injector temperature: the higher this temperature, the faster the sample evaporates and the finer is the spray. Visual experiments confirm this, but the importance should not be overemphasized. The length of the heated needle and the injection volume have a greater effect than the injector temperature. A high injector temperature also improves the elution of the high-boiling solutes from the syringe needle. The upper limit of the injector temperature is determined by degradation of the components of interest or the formation of "ghost" peaks by degradation of sample by-products. In general, compounds subjected to flash evaporation usually tolerate surprisingly high temperatures, prob ably because the sample does not actually reach this tem perature and there is hardly any contact with surfaces.
Small Sample Volumes
The smaller the volume of sample injected, the less heat is consumed and the less the temperature of the needle wall and the vaporizing chamber drops. A 2 III volume injected at 300 DC might, for instance, result in evaporation at a lower temperature than a 1 III injection at 250 DC.
Length of Syringe Needle
It seems plausible that release of the sample a long distance from the column entrance, i.e. the use of short syringe nee dles, would be preferable for split injection. The longer dis tance provides more time for evaporation and spreading across the liner. Interestingly, (hot needle) injection with long (71 mm) needles often provides better results than that with 51 mm needles. This might be because of bet
10.2. Flash Evaporation
229
ter nebulization: a long needle reaches into a hotter zone, and the higher resistance against ejection from a longer nee dle builds up higher pressure, more strongly overheating the liquid.
10.2.3. Problems Arising from Aerosol Formation
Flash evaporation has numerous outstanding features, but there are also two problems which can be severe when sam ples contain high loads of non-evaporating material.
Contamination of the Col umn Inlet?
Nebulization tends to form aerosols. The droplets leaving the syringe needle are reduced in size by evaporation oftheir volatile constituents, such as the solvent, until the high-boil ing and involatile material remains, in the form of small par ticles. These particles move with the carrier gas and are split more or less like the vapor. When they are swept into the column, the advantage is that difficult sample components are safely carried along, but there is also the drawback that non-evaporating material contaminate the column inlet.
Particles Attracted to the Liner Wall
The behavior of particles is not sufficiently well understood. Visual experiments have shown that some particles form a stable fog and move with the gas (e.g. perylene from con centrated solutions) whereas others (e.g. those from 1-5 % edible oil in a solution) were rapidly and quite quantitatively attracted to the liner wall and deposited there. As discussed in Section B4, column contamination is less severe than might be expected, which suggests that larger particles are transferred to the liner wall rather efficiently.
Matrix Effects
Attraction to the liner wall severely affects the fate of the higher-boiling solutes. Because the particles carry them along and "glue" them to the liner wall (or surfaces of packings or obstacles), they can no longer enter the column as an aerosol. Now they must evaporate from a layer of con taminants. If this occurs with some delay, they are split later and maybe at another ratio. If evaporation is severely de layed, they can even be lost almost completely. This leads to non-linear splitting, discrimination phenomena, an'd usually poor reproducibility.
Danger of Systematic Errors
Ifthe solutes behave differently when injected as a clean cali bration mixture rather than as a sample loaded with non evaporating by-products, the analysis suffers from matrix effects, i.e. for a given composition, absolute and relative peak areas for the calibration mixture and the samples are different. Hence, the response factors determined by calibration are no longer applicable to the samples. Results will thus be systematically wrong. These effects are discussed in more detail for splitless injection in Section D6.3.
Conclusions
The most obvious solution to these matrix problems is sup pression of aerosol formation by sample evaporation from surfaces. This entails the use of fast autosampler injec
230
C 10. Techniques for Improving Quantitative Analysis tion into a packed liner or manual injection directly into a dense plug of glass wool. No involatile material will then reach the column; the process will be the same for calibra tion and analysis of the samples. The advantages of gentle evaporation in the gas phase will, however, be lost. Experimental results only partly confirm these expectations. In particular, matrix effects are seldom eliminated (see Section C10.3.7). They tend to change from reducing to en hancing effects (Section 06.2 and 06.3).
10.2.4 Stop Flow Split Injection
At this point, some work merits brief mention, even though it has not been followed up. Bayer and Liu [46] came to the conclusion that incomplete sample evaporation was prima rily a consequence of insufficient residence time in the injector and demonstrated reduced discrimination upon reduction of the flow rate through the injector. To distinguish whether the flow rate must be low in the evapo ration zone or at the split point, they kept that at the evapo ration site low while the split flow rate remained high, by introducing most of the gas through a hole in the liner wall below the evaporation zone. Because results improved, they concluded that the flow rate in the vaporizing zone should be low. This led to the idea of stopping the flow through the injector at the moment of sample evaporation.
Procedure
The method does not require modification ofthe instrument. The liner contained a glass bead in its upper half (Section B3.5.4). Some 10 s before injection, the split valve was closed to reduce the flow rate through the injector to the column flow rate. The sample was then introduced and the valve opened again 1-2 s later. This procedure resembles splitless injection, but no sample material enters the column during this short splitless period because the vapor does not reach the column entrance before the split valve is re-opened.
FurtherOpumuauon
In a later paper, Liu and Xin [47] studied the influence of vapor viscosity on discrimination. Using a system with a needle valve in the split outlet they reasoned that passage of the vapor/gas mixture through this restriction changes the flow rate, i.e. the split ratio. Arrival of the vapor of different components at the split point at different moments causes non-linear splitting. Hydrogen is preferable to helium as car rier gas because its viscosity is nearer to that of the solvent vapor. High injector temperatures are recommended if sub stantial pre-separation is to be avoided. A further paper dealt with the delayed release of high-boiling components, and the discrimination against the later-eluted components which results [48].
10.2.5. An Experimental Result: Determination of Sucrose
In 1979, Nurok and Reardon [49] optimized the split injection of trimethylsilyl sucrose for the analysis of sugar cane-juice and sugar-factory products. Using an empty liner they ob
10.2. Flash Evaporation
231
tained a threefold (I) increase in the sucrose peak area when
the injector temperature was increased from 220 to 390°C.
This suggests that an injector temperature as high as 390 °C
was needed to achieve nebulization ofthe high-boiling sam
ple matrix (silylation reagent).
390°C is above the decomposition temperature oftrimethyl
silyl derivatives, but the sample might never have really
reached this temperature and the residence time in this hot
environment was extremely short.
Priming of the Injector
The authors reported results with standard deviations be
tween 0.02 and 0.10 % after first priming the injector. A sam
ple was injected a few times in rapid succession before com
mencing a series of analyses.
Hot Needle Injection
The syringe handling technique was optimized. Injections
were performed manually and it was concluded that "the
times for inserting the needle into the septum, leaving it fully
inserted, and withdrawing it from the septum are approxi
mately equal. The plunger should be rapidly depressed with
a momentary delay before and after. The total process takes
about 6 s".
As the needle temperature is the relevant factor determining
whether nebulization is achieved, heating of the needle to
the injector temperature is essential. There is no need to heat
the injector to 390°C if rapid injection brings the needle tem
perature to, e.q., 250°C only.
10.2.6. Evaluation of Flash Evaporation
The important characteristics of flash evaporation can be
summarized as follows:
1 Samples must be diluted in volatile solvents.
2 Because the sample makes hardly any contact with
injector surfaces, deactivation and cleanliness of the surfaces are rather uncritical. This renders flash evapo ration suitable for the analysis of labile and high-boil ing components. 3 Flash evaporation produces sharper initial bands than other evaporation techniques. 4 Nebulization produces aerosols which can carry substan tial amounts of involatile material into the column inlet. 5 Matrix effects may be encountered for samples con taining elevated concentrations of non-evaporating ma terial and bring about the danger of systematic errors.
10.3. Evaporation in Packed Liners
A fundamentally different concept involves deposition of the sample liquid on to a packing material (such as deactivated glass or fused silica wool) which is locally cooled to the sol vent boiling point. Sample evaporation proceeds from the surface of this packing material.
Characteristics
Evaporation from packing material has the following char acteristics.
232
C 10. Techniques for Improving Quantitative Analysis
1 2
3 4
5
6
It releases clean vapor, practically eliminating the for mation of droplets and aerosol particles. Non-evaporating materials are retained on the pack ing material and contaminate neither the column inlet nor the split outlet. There is ample time for transfer of heat to the evaporat ing liquid. The vapor of high-boiling components are diluted by a large volume of carrier gas. This facilitates the com plete evaporation of high-boiling components, but also results in broad initial bands. Solute evaporation from surfaces must overcome inter actions with the surface and is particularly difficult for high-boiling compounds. It suffers from adsorption or degradation on active sites and retention in layers of contaminants. Samples are fractionated: volatile compounds evapo rate together with or just after the solvent, whereas evaporation of high-boiling material often occurs many seconds later. This can have negative effects on the lin earity of splitting.
Packed Column GC
There is general agreement that packed column GC tends to provide more reproducible results than capillary GC, especially if the latter involves conventional vaporizing in jection. As the problem is largely related to injection, this experience may be used as an argument in favor of convert ing the vaporizing injector into a small packed GC (pre-lcol umn.
10.3.1. Deposition of the Sample
The sample liquid is deposited on to a hot packing material. This presupposes cooling of the packing to the sample (solvent) boiling point, because the vapor would otherwise prevent contact (Leidenfrost phenomenon). Nebulization at the needle exit renders such transfer quite impossible.
Fast Autosampler
The fast autosampler is an excellent tool for the purpose. A band of liquid is shot to the packing, cools the fibers it hits, and is sucked into the space between them. If necessary, the band of liquid travels over long distances through a hot en vironment without touching the liner wall. Hence it repro ducibly transfers the sample material to the packing. The packing can be placed anywhere between the needle exit and the column entrance. In the interest of homogene ous spreading of the vapor across the liner, a position far from the column entrance, i.e. near the needle exit is, how ever, advantageous.
Manual Injection, Conven tional Autosampler
If the sample is dissolved in one ofthe volatile solvents com monly used, manual injection with standard syringes can not be performed at a speed preventing evaporation inside the needle. The same applies to conventional (non-fast)
10.3. Evaporation in Packed Liners
233
autosamplers. A band of liquid can, however, be achieved
for most solvents when the needle is inserted merely ca.
15 mm and the injector head is at a temperature below ca.
170°C (measure the septum temperature by means of a ther
mocouple).
When evaporation inside the needle cannot be avoided, the
best transfer to surfaces is achieved when the needle tip
enters a dense plug of packing, such that the droplets hit
the surfaces while still concentrated and efficiently cool that
region. For optimum placement of the packing, the posi
tion of the needle tip in the liner must be determined. The
distance from the top ofthe liner is equal to the length ofthe
syringe needle minus the height of the septum cap and
septum purge area (Figure C22). The packing is then situ
ated from a few millimeters above this point to ca. 5 mm
below it.
10.3.2. Injector Packing.
The use of column-packing material in liners was proposed
for split injection of, e.g., steroids in biological samples by
German and Horning in 1973 [50]. A 14 cm x 3.4 mm Ld.liner
was packed with a plug of 10 % SE-30 (a dimethylpoly
siloxane) on Gas Chrom P (100-120 mesh) followed by a
longer plug of the same support coated with 1 % SE-30. The
whole packing might have been 8 em long.
Hartigan and Ettre (51] supported the use of such systems,
but neither group provided evidence that such massive pack
ing of the injector is of advantage.
Low Thermal Mass
A packing material of low thermal mass is required to en
sure that the sample liquid is able to cool and wet it. Deacti
vated glass, quartz, or fused silica wool is suitable, as
are column packing materials, possibly coated with sta
tionary phase. The thermal mass of frits is too high (Section
83.5.10).
Amount of Packing Material
The amount of, e.g., glass or quartz wool required is small.
The wool must form a network sufficiently dense to pre vent droplets being shot through it without touching the fibers. Visual experiments indicated that even rather loose packing fulfills this requirement, but there must be no major gap. The liquid does not penetrate the packing material by more than 5 mm. Any additional material (longer plug of packing) just adds to the risk of adsorption or degra dation.
Special Gas-Regulation System?
Long and densely packed beds, as originally proposed, can create a significant pressure drop, particularly at high split flow rates. This prompted German and Horning to modify the carrier gas regulation system. Their concept was later applied in the flowlbackpressure regulation system of Hewlett-Packard. When, however, the packed bed is reduced
234
C 10. Techniques for Improving Quantitative Analysis
to the length really necessary, no significant pressure drop occurs and this aspect no longer determines the design of the gas regulation system. Critical Inertness of the Packing
The inertness of the packing is the major weak point of the concept. As discussed in Section 87, no packing material of really satisfactory inertness is available. The most convenient packing, glass or fused silica wool, is not as inert as it basically could be, e.g. compared with the surface of a deactivated uncoated precolumn. At least part of the reason is that the procedures developed for deactivating glass or fused silica columns cannot be applied to wool. Column pack ing materials are superior in this respect, but they must be kept in place (at least supported at the bottom) by wool. Carbofrit (Restek) is an alternative that does not necessi tate the use of wool. It is a fine network of a glassy carbon type material in the shape of a plug which keeps itself in position.
10.3.3. Optimization of Conditions
The injector temperature is primarily determined by the needs of solute evaporation from the surfaces. It should be somewhat above the column temperature during elution of the last component of interest, to overcome the retentive power and adsorptivity of the packing and possibly of involatile sample material deposited at the same site by pre vious injections. Transfer on to a surface is favored by a low injector tempera ture, but the thermal mass of the packing and the manner of depositing the liquid are more importantfactors. With manual injection or autosamplers injecting at a similar speed, trans fer from the syringe needle is also promoted by a high injec tor temperature.
Injector Temperature
Short Syringe Needle
There is no need for long syringe needles, because a band of liquid covers the distance to the packing also when it is long. Short needles help avoid solvent evaporation in side the needle. Among the needles of standard size, those of 1.5 inch (37 mm) are best suited.
Hot Needle Injection
If solvent vaporization inside the needle cannot be sup pressed, injection should be performed by the hot needle technique to minimize losses of high boilers. The result ing intense nebulization must be accepted as an unwanted side effect.
Poorly Nebulized Liquids
Most conditions should be optimized in the direction oppo site to that discussed for flash evaporation. This means that more concentrated samples in solvents which are less effec tively nebulized (high-boiling point, large evaporation energy) are preferable.
10.3.4. Elution from the Packed Bed
Retention on surfaces delays the release of higher-boiling or adsorbed solute material and the initial bands are broader
10.3. Evaporation in Packed Liners
235
than estimated from the size of the vapor cloud formed upon rapid evaporation in the gas phase. Short Packed Column
Packed liners behave like short packed columns. Higher boil ing solutes are eluted with characteristic retention and (im agining there were a detector at the end of the packing) with a particular peak width. The volume ofthe peak eluted from the packed bed divided by the split ratio yields the volume of the initial bands in the inlet of the capillary column. A vola tile component leaves the packing with the band width of an unretained peak. Problems can arise for the noticeably re tained components.
Cut-Off for High-Boiling Compounds
Because the separation efficiency of packings is poor and the injector is an isothermal system, transition from sharp, negligibly retained to strongly retained, broad bands is rapid. Accordingly, the typical symptom to be expected is rapidly increasing peak broadening beyond a certain elution tem perature, followed by a baseline with perhaps some shallow waves or no peaks at all. High-boiling components are es sentially removed from the analysis.
Importance of Cold Trapping
Peak broadening as a result of slow release from the packed liner is most drastic in isothermal GC runs and for rap idly eluted peaks. Isothermal GC, in fact, enables rapid de tection of retention and band broadening in the injector. Tem perature programming of the capillary column reconcentrates broadened initial bands by the cold trapping effect, i.e. tran sition from sharp to broadened peaks occurs at elution tem peratures a few tens of degrees higher.
Retentive Power of Packing Materials
The retentive power of silanized glass wool is low, but that of column packing materials must not be underestimated. Even deactivated packing material free from stationary phase has a retentive power similar to that of a capillary column. Because optimum and stable deactivation presupposes coat ing with stationary phase, the retentive power usually substantially exceeds that of the capillary column. It must be overcome by use of a temperature exceeding the maximum oven temperature by several tens of degrees. Some attention must be paid to the real temperature of the packing in the liner. Most injectors are accurately thermostat ted somewhere in the center or lower half. The top and the bottom of the injector are often far cooler.
10.3.5. PAHs as an Example
Munari and Trestianu [52] described results obtained for poly cyclic aromatic hydrocarbons (PAH) with and without silan ized glass wool in the liner. They demonstrated the range of components for which the glass wool packing was of advantage and when it became a drawback. The results might be rather optimistic, as the experiments were per formed with standards in hexane. PAHs in' environmental extracts usually suffer more strongly from discrimination
236
C 10. Techniques for Improving Quantitative Analysis against high-boiling compounds, owing to the presence of matrix material which retains the components of interest.
Incomplete Evaporation
As shown in Figure C27, the mixture with equal concentra tions of PAHs produced peaks of constant area when injected on-column. Although the injector was at 360°C, split injec tion with an empty liner (5 cm needle, 4 mm i.d. glass liner, "2 ~L" sample volume) resulted in significant discrimination even for a component such as benzo[b]fluorene, commonly eluted at ca. 210°C. With glass wool, this compound was no longer noticeably discriminated against, which suggests that the loss in the empty liner was a result of incomplete evaporation and a smaller proportion of aerosol particles entering the column than would have been expected from the split ratio set. DISCRIMINAnON FACTOR
"
.• SPLITTING INj. (1:100) . . . \~ glass wool
'"... 0.9
'\
'.
".'..\. ,
SPLITIING INJ. (1:100)
~ '-':\
/
no glass wool
"\ 0.1
\~,.
.,~
0.7
~
-,
'.~
"'.,., SPLITLESS INJ.
u 110 200 220 240 2&0 280 300 MOLECULAR WEIGHT (u.am.)
Figure C27
Discrimination against PAHs resulting from the use of dif
ferent liners. Group 1: phenanthrene, anthracene; group 2:
pyrene, benzo[b]fluorene, benzo[a]anthracene, chrysene;
group 3: 3-methylcholanthrene, dibenzo[a,i]acridine,
benzo[g,h,ilperylene, dibenzo[a,h]anthracene; group 4:
coronene, dibenzo[a,ilpyrene. (From Munari and Trestianu
[77]).
Adsorption on Glass Wool
The five-ring PAHs, including the benzopyrenes, were affected similarly with or without glass wool in the liner. For the larger molecules, the results were the opposite of those reported above: the discrimination observed with glass wool exceeded that without. Evaporation from the glass wool surface was, apparently, exceedingly slow for these compo nents. In terms of retentive power, wool at 360 °C should have readily released a compound such as benzopyrene. Thus the ob served losses must have resulted from adsorption.
10.3. Evaporation in Packed Liners
237
Discrimination arising from losses of high-boiling mate rial inside the syringe needle was not specified, but was, of course, constant throughout the experiment. 10.3.6. "Ghost" Peaks as
a Result of Packing Bleed
Only with Temperature Programs
Degradation of stationary phaBe. silylation material. or high-boiling sample by-products in the injector can pro duce volatile compounds at a more or less constant rate. Such bleed from the liner often introduces "ghost" peaks into the chromatogram. "Ghost" peaks of degraded sample by-prod ucts can also be observed after flash evaporation in empty liners, but they are usually much smaller.
When the capillary column is cooled. degradation prod ucts are accumulated at the column entrance and form sharp peaks during subsequent temperature-programmed chromatography. "Ghost" peaks often tail somewhat, ow ing to material introduced into the column after temperature programming has started. The size of the "ghost" peaks resulting from material con tinuously released from the vaporizing chamber depends on the duration of oven cooling. This provides us with an easy test of their origin - if they are from the injector, varying the cooling period must strongly influence their size.
No such "ghost" peaks are expected in isothermal GC, because the constant stream of bleed into the column merely raises the baseline slightly and permanently. This provides us with another test for the origin of the "ghost" peaks. "Ghost" Peaks Arising from Aggressive Sample By Products
Some samples cause "ghost" peaks even in isothermal runs. Aggressive sample by-products accelerate degrada tion in the injector and produce artifacts primarily during the evaporation process. If there is no obvious peak broaden ing, it is more difficult to distinguish between peaks of real sample components and such "ghost" peaks. In jection of pure solvent or of a mixture of standards may pro duce no such Hghost" peaks. Such "blanks" easily mislead, because the "ghost" peaks are then mistaken for real sam ple components. An on-column injection immediately pro vides the correct picture.
10.3.7. Matrix Effects
Packed liners are of particular interest for accurate analysis of samples in difficult matrices; otherwise flash evapo ration is preferable. This raises the question of whether ma trix effects are really absent. Rather little has been published on this subject, and work presented by Ferreira et et. [53], summarized here, does not confirm expectations.
Experimental Conditions
The experiments were performed with flavor components injected as standards in pure solvent !dichloromethane or pentane) or in solvent artificially contaminated with an extract from red wine. A Hewlett-Packard 5890 instrument with an HP 7673 fast autosempler was used and a 1 III
238
C 10. Techniques for Improving Quantitative Analysis volume was introduced into an injector at 250°C with a liner either empty or containing a Jennings cup and Chromosorb. The pre-set split ratio was 40:1. Areas corresponding to the pre-set split ratio were determined by on-column injec tion of a 40-fold diluted solution.
Clean Mixture
Table C8 shows results, calculated in terms of true split ra tios, for the mixture in dichloromethane injected into empty and packed liners. Split ratios were ca. 25 % lower than those adjusted, and varied between 29 and 36 for the empty liner and between 28 and 32 for the packed liner. In the chromatograms the components split at a higher ratio are regarded discriminated against. Discrimination reached 24 and 14 % for the empty and the packed liners, respec tively. With the empty liner, 1-hexanol and ethyllaurate were most strongly discriminated against, whereas these same components gave large peaks when the packed liner was used.
Contaminated Mixture
With the contaminated mixture and .an empty liner, true split ratios were between 27 and 30 and, as shown at the right in the table, 5 to 21 % lower than for the clean mix ture. Hence more solute material entered the column, corre sponding to an enhancing matrix effect. The narrower range of true split ratios indicates weaker discrimination. With the packed liner, the split ratios ranged between 27 and 40, in general being closer to the pre-set value than with the clean mixture. Up to 40 % less material entered the col umn; phenylethyl acetate was an exception: 15 % more ma terial was analyzed. Thus there was a rather strong reduc ing matrix effect. Discriminative effects were correspond ingly strong. Relative standard deviations (n=5) were between 1 and 3 %. Results with pentane as solvent were similar.
Table C8 True split ratios for flavor components injected into empty and packed liners (left). Pre-set split ratio, 40: 1. The increase or decrease of the true split ratio for the contaminated solution is given as percentage (matrix effect; columns at the right). (From Ferre;ra et al. [53]).
Liner 1-Propanol Ethyl butyrate 1-Pentanol 1-Hexanol Ethyl oetanoate Phenyl ethyl acetate Ethyl laurate 2-Phenylethanol
True split ratio Clean sample Empty Packed 30 29 32 36 34 34 36 34
28 28 30 29 28 32 29 29
Changes [%) for contaminated sample Empty Packed -6 -5 -16 -21 -17 -16 -18 -12
+39 +37 +25 +32 +25 -15 +9 +5
10.3. Evaporation in Packed Liners
239
Conclusion?
The results provide a disturbing picture. Up to 40 % ma trix effect for rather easy, volatile components is not what might be expected from the process involved. In terms of matrix effects, the results from the empty liner were supe rior, despite the use of a fast autosampler.
10.4. High-Boiling Sam ples
The third approach to improving results from split injection applies to high-boiling samples. The high-boiling point re fers to the sample matrix: a high-boiling solvent or an un diluted mixture of high-boiling materials. "High-boiling" means a boiling point not far below the injector tem perature or higher.
Smooth Evaporation
Samples with high-boiling matrices can be deposited on surfaces in the injector from where they evaporate rela tively slowly (scenario 3 in Section 83.3.3). If the boiling point of the sample exceeds the injector temperature, evapo ration is slow because the vapor must be diluted with carrier gas. The latter is saturated, and maybe a large volume must flow past the site of evaporation to transport the sample vapor. Only evaporation from a surface provides the conditions required: relatively long evaporation time and passage of a large volume of carrier gas.
Advantages
Smooth and possibly slow evaporation from surfaces avoids the drawbacks of rapid evaporation. No pressure wave, because (at least in pressure-con trolled systems) the sample vapor replaces carrier gas rather than expanding as a result of its own vapor pres sure. No large volumes of vapor are formed in such short times that they require intermediate storage. No formation of aerosols. No evaporation inside the needle.
10.4. I. Optimization of Conditions
In contrast with the samples discussed above, high-boiling samples do not rely on cooling of the surface before they can be deposited on to them. They can be placed on to surfaces with a large thermal mass behind, such as the wall of the liner. So far, no packing is needed in the liner.
Packing ls Unnecessary
Deactivated Liners
The advantage of using no packing material is in the inert ness of the system. Even non-deactivated liners seem to be less adsorptive or catalytically active than" deactivated" wool. Liners can, furthermore, be deactivated by the same efficient procedures as are used for capillary columns.
Narrow-Bore Liners
Slowly evaporating samples produce vapor at a rate posing no problem regarding their discharge. Furthermore, high boiling samples are usually highly concentrated and, there fore, injected at high split flow rates. Hence the volume of
240
C 10. Techniques for Improving Quantitative Analysis the vaporizing chamber does not need to be large enough for intermediate storage of vapor. Liners of 1-2 mm i.d. can be used, which helps to ensure complete transfer of the liquid on to their wall.
Short Needles
Short syringe needles (37 mm) should be used in order to leave a long distance between the needle exit and the col umn entrance. If this distance is 4-6 ern, a straight "shot" of the liquid through the liner is highly improbable (as can easily be tested with a normal syringe and a short glass tube). Maybe electric charges help to pull the liquid to the liner wall. A long distance (and a narrow bore) also aid ho mogenization of the distribution of vapor across the liner.
Sideport Hole?
Needles with a sideport hole seem ideally suited to reliable transfer the liquid to the liner wall. There is no experimental experience contradicting this - but standard needles appear to be equally suitable.
Fast Injection
The plunger ofthe syringe must be depressed at high speed to separate the liquid from the needle tip. High-boiling liquids tend to be rather viscous and to remain hanging on the needle tip. When the needle is withdrawn, they are wiped off on to the septum, sometimes accompanied by the release of something looking like smoke. If fast depression of the plunger is not sufficient, a packing is needed into which the needle enters, such that the liquid is wiped off on this mate rial.
Wettability of the Liner Surface
Deposition of sample liquid on the liner wall and evapora tion from a film of liquid resembles on-column injection, in which the liquid is deposited in the column inlet or an uncoated pre-column. It spreads out until a mechanically more or less stable film, 10-30 urn thick, has been produced. A problem well known in on-column injection could also be relevant for a liner. If the sample liquid does not wet the surface, it cannot form a film, but merely a few droplets here and there, like water on a window pane. Such droplets do not adhere to the surface and are likely to be driven to the bottom of the liner by a fast gas flow. The situation in the liner is better than in on-column injection because higher temperatures reduce surface tension and, hence, facilitate wetting. As known from on-column injection, trimethylsilylated sur faces have low critical surface energy and are wetted by a minority of the solvents only. Phenyldimethyl silylation is far better in this respect and should probably also be used for liners.
Small Sample Volumes
The capacity of the liner wall to retain liquid is limited. If ex cessive amounts are injected, the liquid flows down the liner wall as a tear and when it has passed the column entrance it
10.4. High-Boiling Samples
241
is lost for the analysis. Even in 1 mm l.d. liners the liquid
does not form a plug filling the liner bore and, hence, does
not make use of all the surface available. It spreads as a band
maybe 2 mm wide.
Visual experiments indicated that 2 III of liquid were reli
ably retained, whereas 5lJ.L mostly flowed more than 4 cm
down the liner wall and, thus, passed the position of the col
umn entrance.
Difference between Injector Temperature and Solvent Boiling Point
The maximum injector temperature is determined by three
factors.
The needle temperature must remain low enough to rule out sample evaporation inside the needle. It not only depends on the regulated injector temperature, but also on the injection speed and the septum tempera ture (a cool injector head is preferable). The use of a fast autosampler totally eliminates this problem. Transfer of the sample to the liner wall without repul sion by vapor. This seems possible for surfaces which are up to 50° above the boiling point of the sample. The solute material must be evaporated. These requirements can create a dilemma: although the in jector temperature should not far exceed the solvent boiling point, even high-boiling and adsorptive components must be evaporated and transferred to the column. Be cause evaporation occurs from a surface, the temperatures required tend to be rather high. If the injector temperature must be increased, however, this also means using a higher boiling solvent. Hence the method is restricted to compo nents with a rather narrow volatility range.
Problems with Solvent Purity
Despite the convincing concept and encouraging results, in
jection in high-boiling solvents has not been widely adopted.
This is probably because of practical problems. Many high
boiling solvents are not available in sufficient purity, and
redistillation is difficult. High-boiling solvents are, further
more, expensive.
Problems with impurities can often be overcome by prepar
ing highly concentrated samples which are then split at
high ratios and injected in small volumes (as the needle con
tent is not transferred, it is possible to inject, e.g., 0.5 lJ.L).
No Sample Reconcentration
A further problem is encountered during sample prepara
tion. Because high-boiling solvents evaporate only with dif
ficulty, solutions cannot be reconcentrated. Often it is prefer
able to work up a sample with volatile solvents and exchange
them for a high-boiling solvent at the end of the sample
preparation procedure.
Broad Initial Bands
High-boiling liquids evaporate slowly, because the heat re
quired for evaporation must be transferred in the absence of
a large temperature gradient and the vapor' strongly diluted
242
C 10. Techniques for Improving Quantitative Analysis by the carrier gas. Deposition on the liner wall, on the other hand, brings the sample into direct contact with the main source of heat. Broad initial bands are most likely to become visible in the chromatogram when components are eluted isothermally at the injection temperature, particularly when retention times are short. Temperature programming starting 30-50° below the elution temperature solves this problem (cold trapping).
Broadened Peaks Eluted Before the Solvent
The analysis of volatile components eluted before the sol vent peak is usually difficult, because peaks are often broad ened or even fused to the solvent peak, particularly when the split ratio is modest or low. The worst broadening is ob served for peaks eluted shortly before the solvent. Broadening is primarily caused by phase soaking, a solvent effect involving co-chromatography of the solute with the overloading solvent band in the coated column [55,561. The only efficient way of reducing such peak broadening is to reduce the amount of sample entering the column, i.e. to reduce the volume injected and/or increase the split ratio.
Recondensation Effects
Vapor of high-boiling samples has a strong tendency to recondense in parts which are substantially cooler than the injector, i.e. the column inlet and the split outlet. Recon densation can affect the split ratio, but also plug the split outlet line after a long series of analyses.
10.4.2. Experiments by Schomburg
In 1977 Schomburg et al. showed that the use of high-boil ing solvents substantially reduced, or even eliminated, dis crimination in split injection [101. Further examples were given later [57-591. Typical solvents investigated were Ce-C'2 n-alkanes and C6-C'2 fatty acid methyl esters.
Low Injector Temperatures
Linked with the use of high-boiling solvents, they recom mended the use of injectortemperatures not too far above the solvent boiling point and showed that a mixture con taining n-alkanes up to C40 could be analyzed by conventional split injection without discrimination (Figure C28). The sol vent was dodecane (b.p, 216°C); injector temperatures were 210 or 310 DC. It is, in fact, remarkable that a perfect peak could be obtained from a component such as C40 (b.p, 540 DC) with the injector at only 210°C. It was certainly important that the test sample was free from involatile material. The samples were injected manually by a rapid cool needle tech nique to help avoid sample evaporation in the needle.
10.4.3. Application to Herbicide Analysis
Li showed the advantages of high-boiling solvents for split injection of herbicides [60J. With dichloromethane as solvent, relative standard deviations were clearly higher than those obtained in packed column GC (ca. 2 % compared with 0.3 %); with butyl acetate (b.p, 127°C), however, they were
10.4. High-Boiling Samples
243
I
I, ~
I
I I I I
A
I II
B
Figure C28
Split injection (50:1) of a broad mixture of alkanes (C,o-C 40,
as indicated in chromatogram C), using high-boiling solvents.
(From Schomburg et ",. [57]).
Solvent A B C D
n-Octane n-Dodecane
Injector temp.
Area C,JC 40
310°C 210°C 310°C 210°C
0.13 0.43 1.02 1.02
lower. The injector temperature was 220 DC; injection was performed with a Hewlett-Packard 7671 A autosampler.
10.5. Homogenization of Vapor Across the Liner
Correct splitting presupposes homogeneous distribution of the vapor across the liner. A reproducible split ratio (re producible absolute peak areas) cannot be expected if the main stream of vapor hits the column inlet during one injec tion, but passes it by on another. This seems obvious, but there are few data enabling one to conclude whether or not this is a significant problem in practice. The videos suggested that homogenization of a fog across the liner is rapid (1-2 frames, i.e. 40-80 rns), particularly if the
244
C 10. Techniques for Improving Quantitative Analysis diameter is small. The splitting process takes some ten times longer. Narrow bore (e.g. 2 mm i.d.) liners promote, on the other hand, a strong pressure wave and recondensation in the column inlet if oven temperatures are low. Both contrib ute to increased standard deviations, maybe offsetting the advantage of homogenization.
10.5.1. Obstacles Pro moting Homogeneous Distribution
When mixing is aimed primarily at homogenizing the vapor/ gas mixture across the liner, the cup liner is promising, be cause it forces the gas phase through a narrow passage and then spreads it equally along the liner wall (Figure C29). The obstacle must be well above the column entrance be cause there is a dead space just below the cup. The laminar liner (Section B3.5.6) might perform even bet ter because the column is situated in the narrow bore center tube, where little mixing is enough to achieve homogeneity.
~,
-_.""'~- .;:~~ "!'o. ",.,
-j.:f!
;-
Mixing in the narrow funnel Spreading along the liner wall
Dead space
Figure C29
Homogenization of vapor and carrier gas across the vaporiz
ing chamber by use of the cup liner.
10.5.2. Chromatographic Experiment with Two Columns
Bowermaster [611 described a simple experiment for check ing the homogeneity of the concentration of vapor across the liner. Two columns were placed side by side at the same height in the injector. If the concentration of vapor over the short distance between the two column entrances (0.20 mm) is constant, peak areas in a constant ratio are obtained from the two columns over several runs. The ratio is that of the flow rates into the two columns.
Densely Packed Straight Liner
The results reproduced in Figure C30 are surprising. For a straight 4 mm l.d, liner at 250°C, tightly packed with a 1 cm plug of glass wool (22 mg), the area ratios for a mixture of C10-C30 alkanes were stable within ca. 1 %. A 1 ul, volume of a hexane solution was injected by means of the HP-7673A fast autosampler.
10.5. Homogenization of Vapor Across the Liner 1.35
245
r----------
1.3
Inverted Cup Liner. 250 0 !
!
,
!
,
,
15
20
25
15
20
25
Alkane Carbon Number
Alkane Carbon Number
Figure C30
Area ratios for n-alkanes eluted from two columns installed side by side in a split injector.
Straight liner with a tight plug of glass wool, and a liner with a cup below some loose glass
wool. (From Bowermaster[61]).
Cup Liner
With a cup liner loosely packed with 9 mg glass wool above the cup, variation of the area ratios was increased by a factor of at least ten. Area ratios varied from run to run, i.e. vapor of different concentration reached the columns (horizontal lines). Often the area ratios also varied from com ponent to component (slanted lines), indicative of material of different composition entering the two columns. As gas phase equilibration over such short distances is rapid, Bowermasterassumed unequal aerosol distribution was the source of the problem.
Decane as Solvent
With the same liner, but decane as solvent, the area ratios were almost as stable as with the straight, densely packed liner (not shown). Bowermaster explained this as elimina tion of aerosol formation. Boiling at 150 °C, the solution evaporated more slowly and more smoothly.
10.5.3. Fatty Acid Methyl Esters
Bannon et al. [42] searched for the liner providing the best results for split injection of fatty acid methyl esters dissolved in hexane, i.e. for a rather "easy" sample, but one calling for high accuracy. Injections were performed with the fast Hewlett-Packard autosampler. Three liners were compared: a packed with glass wool; b packed with 10 % SE-30 on Gas Chrom Q and glass wool above an "inverted cup"; c glass wool above two cups (double obstacle). In general, the results obtained were good, and, therefore, differences were rather small.
Importance of the "Inverted Cup"
Compared with liner a, use of liner b also generated highly accurate results under conditions further from the optimum (e.g. larger sample volume). It is, however, difficult to con clude whether this improvement was the result of the cup or the packing material. Liner c, i.e. that containing two cups and no packing material, provided still better results, sug gesting that the cup was the decisive part.
246
C 10. Techniques for Improving Quantitative Analysis
10.6. Two Case Studies
Two analyses studied in some detail are summarized below in order to illustrate how difficult it can be to draw simple conclusions.
10.6.1. About a Dispute: the Methanol/2-Ethyl-1 Hexanol Mixture
In 1977, Schomburg et al. [101 published a figure (Figure C31), which many took as a generally valid evaluation of liners. The liners were tested by injection of a solvent-free 1:1 mixture of methanol and 2-ethyl-1-hexanol. Only relative standard deviations of the area ratios were given. With an empty glass tube, the relative standard deviation was extremely high - 34 'Yo. A small amount of glass wool in the liner slightly improved it to 25 'Yo. With an liner contain ing baffles, a cup liner, or a packing of chromatographic sup port material, relative standard deviations dropped to 2-3 'Yo. Finally, a long, tight packing of glass wool resulted in repro ducibilitv within less than 1 %.
5
a
c b d e 9 25 -.:.::",:;
::e 01 vaporizing chamber
~:'.J::':' ~'.: ';"~":J.~':: '.
':" ':;:';.~ ::~~~~" '.:'.:.:
Sample vapor entering column
~~. ~njeClor temperature '
.•.. :
:i
GC oven
Retained solute material
:.
~
Temperalure gradienl Cool column attachmentscrew Steep temperature drop
Column
Recondensed solvent spreading into column
Figure D52
The section of the column inlet located in the region of the
column attachment is at an intermediate temperature. It re
tains some of the solute material, i.e. prevents it from reach
ing the flooded zone. but no solvent recondenses there.
The column entrance is positioned in the truly thermostat ted part of the injector. The inlet then passes through a tem perature gradient, from the less intensely heated bottom part of the injector to the column attachment with the fitting and the screw protruding into the oven. Near the bottom end of the column attachment the temperature drops, in a steep profile, to that of the oven. Retention of Solute Material
The solute material is pre-separated in this gradient. As the injector temperature usually exceeds the maximum oven temperature during the analysis, all the solute material of interest rapidly passes through the first part of the column neck. The high-boiling material should then be retained in the somewhat cooler region 1-2 cm below the column en trance. That of intermediate volatility should pass slightly further to find a point near the column attachment which halts its progress. Only the solvent and the volatile solutes should advance into the oven-thermostatted column.
7.5. Band Broadening in Space Visual Observation
359
Experiments only partly confirm these expectations. In a glass capillary column, the initial band of the moderately high boiling perylene can be observed visually owing to its strong fluorescence. 2 III of a solution in dichloromethane were in jected splitless at an injector temperature of 270°C. The GC oven door was open to promote solvent recondensation, but also to mark the front end of the flooded zone. At the end of solvent evaporation (about 2 min after injection), the column was dismantled and the distribution ofthe perylene observed in a dark room under UV light (366 nm). Most of the fluorescence was observed ca. 1.5 cm below the column entrance (Figure D5~, the column inlet in the injector being some 45 mm long). Its intensity decreased to wards the point where the column left the attachment, but ca. 10 % of the injected perylene had entered the oven-ther mostatted column. There, it was redissolved by the recon densed solvent and spread throughout a flooded zone ca. 40 cm in length. From the low volatility of perylene it should have been expected that all of this material would remain in the column neck. :! :
splitless injection syringe
hot injector
warm
lone cold
oven
Figure D53 Visually determined distribution of perylene in the column inlet after splitless injection with an open oven door. (From [64].)
Incomplete Retention in the Column Neck
Chromatographic experiments confirmed that part of the solute material always enters the flooded zone, although the proportion decreases as the volatility of the solute decreases; it corresponded to ca. 50 % for n-decane and decreased to 15 % for n-e30 (Figure D54). Obviously the column inlet inside the injector was too short for complete partitioning. 1.5 III of an acetone solution of C'O-C36 n-alkanes was in jected at ambient column temperature and eluted from a 5 m x 0.30 rnm i.d. glass capillary column coated with OV-1
360
D 7. Reconcentration of Initial Bands
10
cold on-column
12
18 24
22
16
\4
20
splitless
I 3OO'C
Figure D54 In on-column injection, peak deformation due to band broadening in space is determined by the distribution of the sample material in the flooded zone. In splitless injection under condi tions causing solvent recondensation it is further complicated, because during the flooding process part of the solute material remains in the column neck inside the heated injector. (From ref. [63].) (100 % methylpolysiloxane). The shortness of the column and the restricted wettability of QV-1 by acetone accentu ated peak distortion.
Shape of Initial Band
In Figure D55, the shape of the initial band is shown in the form of a chromatogram as it would be recorded by a detec tor positioned right after the flooded zone. The material brought to the front of the flooded zone is eluted first. As the flooded zone is maybe 20-35 cm long and the band retained at the bottom of the injector only 5-10 rnrn, the peak eluted last is extremely sharp compared with the rest. In reality, the initial band shape loses much of its clarity during the chro matographic process. It is clearly visible only if the col umn is short or the sample solvent does not wet the sta tionary phase surface and the flooded zone is correspond ingly long.
Defocusing Effect of the Cool Injector Base
It should be added here that similar peak distortion can re sult from a cool column neck inside the injector. The tem perature of the base of the injector tends to go up and down with that of the oven, usually clearly exceeding the latter. It can, however, be a cold spot if a rapid temperature pro gram is applied. Initial bands of higher-boiling solutes are enlarged owing to slow release from thlssite of high reten tive power. The effect is accentuated if the corresponding
7.5. Band Broadening in Space
Chart
361
• Retained in bottom part of injector
Spread in flooded inlet inside the oven
Figure D55 Peak (initial band) after splitless injection with solvent recondensation before chromatographic diffusion processes "washed away" its initial clarity; solute eluted at least 50° above the column temperature during injection (no recon centration by solvent trapping). The distribution of solute material within the flooded zone, i.e. the shape of the broad part of the peak. is poorly reproducible.
capillary section is contaminated and thus has higher gas
chromatographic retentive power. Many types of sample by
product tend, in fact, to accumulate there.
The resulting effects vary between tailing peaks, distorted
peaks, and peaks of insufficient area, the latter being the
most insidious effect as quantitative results can turn out in
correct without any visible warning from the chromatogram.
7.5.2. Extent of Peak Distortion
Lengths of flooded zones per volume of liquid were deter
mined by visual experiments, primarily by use of on-column
injection [65,661. The results can be summarized by the fol
lowing rules.
Length of Flooded Zone
In a 0.32 mm i.d, coated column inlet, the sample liquid
flows 15-25 cm per microliter. If only part of the sol
vent is recondensed, the flooded zone is correspond
ingly shorter. Hence, 2 ~L of sample (including the nee
dle volume) creates a flooded zone up to some 40 cm
long.
The length of the flooded zone is inversely propor
tional to the column diameter, because a wider bore
capillary has a larger surface to form a sample film. In
0.53 mm l.d. inlets, the flooded zones are typically 10-15 crn/ul, of recondensed solvent, whereas they reach 50 80 crn/ul, in 0.1 mm i.d, columns. If the surface of the column inlet (the stationary phase or deactivated uncoated precolumn) is not wetted, the sample is unable to form a film. It leaves some droplets here and there and moves up to several meters per microliter. In extreme situations, some sample liquid can flow directly into the detector.
362
D 7. Reconcentration of Initial Bands
The maximum tolerable length of the flooded zone is deter mined by the length of the solute bands resulting from the chromatographic process. It should not contribute noticeably to the terminal band length, the length of the band when leaving the column. Terminal Band Length
As deduced by Saxton [67]. the terminal band length is iden tical for all components running through a column under the same conditions; peak widths do not, in fact, vary because terminal band lengths vary, but because these bands leave the column at different speeds. If chromatography is assumed to provide an efficiency cor responding to a height equivalent to a theoretical plate (HETP) equal to 1.5 times the column diameter (a column used not far from its optimum), the terminal band lengths are as given in Table DB. Table D8 Terminal band lengths [cm] calculated for different column lengths and internal diameters under the assumption that the efficiency in terms of HETP corresponds to 1.5 times the column diameter.
Column Terminal band legth [cm] Length 0.10 mm 0.25 mm 0.32 mm 0.53 mm 7m
15 m 25 m 50 m Broadening Effect
13 19 24 35
20 30 39 55
23 34 44 62
30 44
56
80
The calculation of peak broadening from the size of the ini tial band is complicated by the non-Gaussian shape of the band (see below), but a rough comparison of the initial and the terminal band lengths is sufficient to reveal that band broadening in space in splitless injection with solvent recondensation is by no means negligible. For practical work, initial band lengths (flooded zones) cor responding to a quarter of the terminal band lengths produce negligible peak broadening, whereas those cor responding to half of it cause measurable, but not immedi ately obvious broadening. This means that with a 15 m x 0.32 mm i.d. column, producing terminal bands ca. 35 cm long, initial bands ca. 15 cm long can be tolerated without substantial loss of column performance. These 15 cm corre spond to the flooded zone generated by ca. 1 ilL of recon densed liquid.
Sample Wetting the Station Figure D56 shows chromatograms obtained from fatty acid ary Phase Surface methyl esters in hexane, analyzed on a 12 m x 0.31 mm i.d. glass capillary column coated with a polydimethylsiloxane. Chromatogram C was obtained by split injection and serves
7.5. Band Broadening in Space
A)
SPLITLESS WITHOUT SOLVENT
RECONPENSATION
363
n I' ,
!lO~~=====~~~~=========:;:.~~:o.J ~
210°C E3)
C)
7°/min
SPLITLESS WITH SOLVENT RECONDENSATION
SPLIT
16 15
14
12
10
18
8
6
----''---~~~--L--__A___--------~
~ 1------- ---------1 7°/min
210·C
25°C 40°C
Figure D56 Band broadening in space in splitle.. injection with a sample solvent wetting the stationary phase surface: Ce-C,s fatty acid methyl esters in hexane. C, 1.5 III split injection (30:1); no broadening by initial bands. B, 2 III splitless injection; column temperature during sample transfer, 25°C, t.e. with strong solvent recondensation. Peaks are broadened by 25 to 35 %. A, as B, but sample transfer at 60°C, Le, without recondensation. Attenuation is twice that used for B. (From ref. [64].)
for comparison. Chromatograms B and A were obtained from splitless injections (2IlLI under conditions either resulting in solvent recondensation (column temperature during injec tion, 25 °CI or excluding the latter (column temperature, 60°CI.
Without solvent recondensation (chromatogram AI, the first peaks were broadened in time. There was no recon centration by solvent effects and cold trapping was still weak. The broadening effect was modest, because of the relatively high carrier gas flow rate (5 rnt/rnln, hvdroqenl. Peaks from ester C10onwards, reconcentrated by cold trapping, had the
364
D 7. Reconcentration of Initial Bands same widths at half height as those in chromatogram C. In fact, there was no flow of recondensed sample and, thus, no band broadening in space. Peak broadening in chromatogram B is not obvious, but compared to chromatograms A or C it amounts to 25-35 %. It is more apparent from the peak heights: the same amounts were injected as in A, but attenuation was halved. Broaden ing reduced the separation efficiency, in terms of separation number tTZ), by 25-35 % and in numbers of theoretical plates by a factor of nearly two, i.e. to an efficiency expected from a column half as long. . Effects of band broadening in space are weaker when longer separation columns are used, because the initial band con tributes less to a longer terminal band. If a 25 m capillary column had been used the peak broadening would have been hardly significant (although still measurable).
Non-Wetting Samples
The chromatograms in Figure 057 were obtained with the above column and the conditions of chromatogram B, but using acetone and methanol instead of hexane. A)
ACETONE
6 IB
16
15
14
12 10
7'/min
B
--------1
25'C
40'C
Figure D57
Peak distortion arising from band broadening in space. Ac
etone wets polydimethylsiloxane stationary phases poorly.
methanol not at all. Sample. column, and conditions as in
Figure D56B. (From ref. [64].)
Polydimethylsiloxane stationary phases are only partially wetted by acetone, which results in a flooded zone about twice as long and correspondingly more severe peak distor tion. The distortion pattern shown in Figure 048 is now ap parent as pre-peaks or shoulders in the up-slope (except for the C6 ester). The upper halves of the peaks are as sharp as
7.6. Uncoated Precolumns - Retention Gap Techniques
365
those obtained by split injection since they represent the narrow part of the initial band. Polysiloxanes containing at least 5 % phenyl are wetted by acetone. Methanol does not wet apolar stationary phases; 1 ~L flows several meters into the column and peak distortion is correspondingly severe. The height of the bands eluted be fore the sharp signals indicate that the amount of solute material deposited in the flooded zone decreased towards the front of the flooded zone. This is probably because of extraction of the esters from the flooding methanol into the stationary phase; the extraction seems to be more rapid for the higher molecular weight esters. Methanol wets polysi loxanes with at least 50 % phenyl substitution and Carbowax type phases.
7.5.3. Avoidance of Peak Distortion
When a wetting solvent recondenses in the column inlet (sol vent effects or side effect of cooling during cold trapping), peak broadening tends to be considerable if the column is short and of narrow bore, but can be neglected if the column is at least some 30 m long. Measures must always be taken when the sample does not wet the column inlet.
Cold Trapping without Solvent Recondensation
Band broadening in space is avoided when solute reconcen tration can be achieved by cold trapping with a column tem perature sufficiently high to prevent solvent recondensation. This precludes analysis at low temperatures. If, for instance, a sample is dissolved in hexane, injection must be performed at a column temperature of at least 50°C. Since satisfactory reconcentration by cold trapping requires a temperature in crease of 60-80°, the first perfectly shaped peaks are obtained at ca. 120°C.
Non-Wetting Solutions
Injection of aqueous samples creates several problems in capillary GC. Those relevant to initial bands are: no stationary phase is wetted by recondensed wa ter; condensed water attacks siloxanes, rendering the col umn adsorptive and chemically active; no precolumns wetted by water [68,691 and resisting chemical attack by water are available [70,711. Hence solvent effects are not applicable. Samples in non wetting solvents, such as water, can be analyzed by splitless injection only when cold trapping without solvent recon densation is applied. Water vapor does not attack column surfaces. As the column temperature during injection must be approx. 90°C at least, the minimum elution tempera ture generating sharp peaks is ca. 160 °e. Thick film columns or columns coated with polar stationary phases can be used to increase elution temperatures.
7.6. Uncoated Precol umns - Retention Gap Techniques
Instead of avoiding the flooding process, bands broadened in spaeecan be reconcentrated by the retention gap tech nique. In on-column injection, this enables the introduction
366
0 7. Reconcentration of Initial Bands of up to many hundreds of microliters. It presupposes un
coated precolumns which, in these extreme cases, are usu
ally 10 m long.
Uncoated precolumns are also used for a completely differ
ent reason, namely the reduction of the effects of non-evapo
rating sample by-products in the column inlet.
7.6.1. Reconcentration of Bands Broadened in Space
If the flowing sample liquid spreads the solute material in an
uncoated precolumn, the solute bands are reconcentrated
at the beginning of the coated column. Migration of
solute material through an inlet of low retentive power (re
tention gap) occurs more rapidly and at a temperature well
below that of elution (see Figure D58). Initial bands are com
pressed on encountering the region of high retentive power
in the coated column. The mechanism of reconcentration are
discussed in depth under "Retention Gap Techniques" in the
context of on-column injection in ref. [731.
'c:"
iii
Fast migration
al "0 o o
u::
A
B
... Slow migration
I I
c
o
Sharp solute band
Figure D58 Flooding sample liquid and reconcentration of the solute bands by the retention gap technique in a temperature-pro grammed run. A The sample liquid flows into the column. a The solvent evaporates. At this temperature, higher boiling components remain spread throughout the flooded zone. C The temperature has been increased. The low retention power enables the solute material to migrate through the uncoated inlet. It is stopped at the entrance of the separation column. D Solutes wait there until the temperature is further in creased to enable chromatography through the separa tion column. (Adapted from ref. [74].)
7.6. Uncoated Precolumns - Retention Gap Techniques
367
High Efficiency
Reconcentration of solute bands by the retention gap tech nique easily exceeds e fector of 100 [751; hence an initial band of, e.g., 1 m (rather long for splitless injection) is short ened to a residual initial band in the separation column of negligible 1 cm. The technique is, therefore, far more effec tive than is needed for splitless injection.
Required Length of Precol umn
The uncoated precolumn must be et leest es long es the flooded zone, but may be longer without disturbing chro matography (except adsorptivity is a problem). 1 ~L of wetting liquid floods 20-30 cm of an 0.32 mm i.d. uncoated precolumn or 25-40 cm of a 0.25 mm i.d, precol umn (65). which is slightly more than for a coated column. Considering that not all of the injected solvent recondenses, uncoated precolumns of 50 cm x 0.32 mm i.d. or 60 cm x 0.25 mm i.d. should serve the purpose (injection volume, 2-2.5 ~L).
Deactivation of Uncoated Precolumns
For compounds of low adsorptivity, rew fused silice is suit able, but mostly deactivated precolumns are preferred. De activation is usually achieved by silylation. For reasons of wettebility, the reagent must introduce phenyldimethylsilyl groups ("phesil" surface) [651. Trimethylsilylated precolumns are not wetted by solvents of high surface tension, such as benzene, toluene, dichloromethane, ethyl acetate, or acetone. If the precolumn is not wetted, the recondensing sample liq uid is not retained and floods into the separation column almost as if there were no uncoated precolumn. "Phesil" precolumns are reasonably well wetted even by methanol.
Chemical Stability of the Deactivation
A problem of silylated precolumns is their instebility to werds eggressive semple meteriel, such as condensed water (humid extracts, e.g. in ethyl acetate). The deactiva tion is hydrolyzed and the silyl group possibly lost with the attacking molecule (water vapor seems to be harmless). Sta bility can be improved by use of polymeric silylation rea gents, bonding the reagent several times and, hence, pre venting its loss upon breakage of a bond (which might be re formed at higher temperatures). Precolumns deactivated with a very thin layer (0.5-1 nm) of OV-1701 were a step in this direction [76,771. Deactivation procedures with hydrosil oxanes seem to be of similar efficiency [78,791. Numerous kinds of deactivated precolumn are available com mercially, usually with little information on the type of pro cedure applied. There are also "polar" and "apolar" precol umns. Their distinction is important when long uncoated precolumns are used, but not for those of up to 2 m com monly used in splitless injection. Because the characteristics of these precolumns cannot be reduced to a scale between "good" and "poor", it might be useful to compare various products for a specific problem.
368
0 7. Reconcentration of Initial Bands
7.6.2. Uncoated Precol umn as Waste Bin
Uncoated precolumns are also used as disposable inlets re taining non-volatile sample by-products. When "dirty" sam ples are analyzed, the column inlet often becomes contami nated. Most of the involatile material reaches the column as an aerosol. i.e. as small particles suspended in the gas phase (like smoke). Other, scarcely volatile compounds, e.g. fat or waxes, enter the column as vapor, but do not get beyond the inlet owing to insufficient volatility.
Effects of Contaminants
The effects of involatile matrix materials contaminating the column inlet were discussed in detail in ref. [801. 1 The most frequently observed effect is peak broaden ing and tailing because the contaminants exert reten tive power, releasing the solutes slowly and after a de lay. A 20 cm column inlet contains roughly 10 ~g sta tionary phase. When non-evaporating material corre sponding to a fraction of this amount is deposited there it modifies the chromatographic properties. It usually accumulates to a kind of droplet and locally builds up high retentive power. 2 Other material primarily increases adsorptivity. Hy droxides, as a drastic example, perhaps co-extracted from basic solutions, obviously adsorb acidic sample components. Polar material tends to have adsorptive properties. 3 Some contaminants support the degradation of sam ple components. For instance, basic material saponi fies esters. Degradation is particularly severe for com ponents chromatographed at high temperatures. 4 Contaminants can degrade the stationary phase in the column inlet. As degradation and elution of the poly mer fragments is accelerated by increasing the column temperature, this causes a drifting baseline which is easily misinterpreted as general column bleed.
Example
Figure D59 shows test chromatograms from a column de graded by ten splitless injections of a crude hexane extract of lemon peel. Chromatogram B shows general peak broad ening (reduction of separation efficiency from TZ 32 to 18). Many analysts are used to curing deteriorated columns by "conditioning", which simply means strong (brutal) heat ing. For capillary columns this often has a clearly negative effect - in our case it seems to have killed the patient (C). Removal of the contaminated inlet completely restored the quality (D). Peak broadening in chromatogram B resulted from accumulated contaminants. "Conditioning" probably ruptured the stationary phase to form droplets. In glass cap illary columns, such droplets were usually visible by eye.
Reduced Effect of Contami nants
Uncoated precolumns reduce several of the problems aris ing from contaminated column inlets [821.
7.6. Uncoated Precolumns - Retention Gap Techniques
369
A larger amount of retaining sample material can
2
be deposited in the column inlet because the "retention gap" can be filled before the retentive power reaches that of the coated column. Degradation of labile solutes is reduced because solutes leave the contaminated column inlet at a far lower temperature.
A 121=29.8 E12
Ill' aI
•
10
122=33.4 Ell
D
EIO A
P
j
j
...
Sr
.1'1
.w
'--J
I
120°
40°
122= 19.4
TZ 1=17.5
po'
B aI
A I
~
~l..JV
J,./~ ~
~
c
121° aI
D 122=29.4
I I
120.5°
I
12,=32.1
t.-.
t\
~
l
1
Figure D59
Standardized column test (temperature program 40 to 120 OCt from a 15 m x 0.30 mm i.d.
glass capillary column coated with non-immobilized SE-52.
A, Almost new column. B, After 10 splitless injections of a crude extract of lemon. C, After
"conditioning" 15 h at 250 °c. D, After removal of 1.2 m column inlet.
Components: D, 2,3-butanediol; 01, 1-octanol; ai, n-nonanal; P, 2,8-dimethylphenol; A, 2,6
dimethylaniline; S, 2-ethylhexanoic acid; E,•.".", methyl esters; am, dicyclohexylamine; 10,
11, n-alkanes. (From ref. [81].)
370
D 7. Reconcentration of Initial Bands Decomposition of the stationary phase by aggres sive material is ruled out because there is none. Hence drifting baselines can no longer be caused by degraded stationary phase from the inlet (but may still result from degraded sample by-products). On the other hand. adsorptivity caused by matrix material is not reduced by an uncoated precolumn. 3
Disposable Column Inlet
The use of uncoated precolumns is convenient when a con taminated inlet must be removed frequently. Because of lac quering. contaminants can seldom be rinsed out with solvent, compelling the removal of the contaminated piece. Precolumns can be replaced. leaving the column untouched. If a chromatogram shows signs of inlet contamination, re moval of a 5 cm section positioned inside the injector is often sufficient. If this does not help, it must be assumed that the contaminants have penetrated the oven-thermostat ted column. where their fate depends on the conditions ap plied.
Length of the Contaminated Zone
If no solvent recondensed. the involatile material remained at the spot where the aerosol droplets were deposited. i.e. within a section less than 10 cm long. If solvent recondensed. contaminants were transported further into the column (Figure 060). Recondensed solvent dissolves the material from the column wall and carries it deeper into the column. spreading it throughout the flooded zone. After the first injection. the material is likely to be more or less evenly distributed. During the subsequent injection it is redissolved and carried forward. After many injections the contaminants end up being accumulated at the front end of the flooded zone. possibly within a section hardly 1 cm long.
Contaminants in the column neck
Flooded zone coated with contaminants
Material flushed forwards with every flooding process
Figure D60
Deposition of conteminants in the column inlet if the sol
vent recondenses.
7.6. Uncoated Precolumns - Retention Gap Techniques
371
Removal of Front of Flooded Zone
If the solvent recondensed during at least some of the injec
tions, the removed inlet section must long enough to include
the main deposit at the front end of the flooded lone. As up
to, e.g., 35 cm of an uncoated 0.32 mm i.d. capillary are
flooded per microliter of liquid, 30-60 cm ofthe precolumn
must be cut away to restore performance safely.
Longer Precolumns
In extreme circumstances, a contaminated column inlet must
be replaced daily (which still takes far less effort than further
clean-up of all the samples). Use of precolumns ca. 1.5-3
m long is recommended, because this enables removal of
several pieces until a new connection to the separation col
umn must be installed. Since the precolumn contributes neg
ligibly to the retention power of the system, its length has
little influence on retention times and shortening has virtu
ally no effect.
Particles Driven Far into the Column
Sometimes particles are driven far beyond the flooded lone.
Occasionally they probably pass through the entire column.
They appear to move like dust. Small sodium sulfate crys
tals, suspended after drying of a sample solution, have been
observed up to 15 m from the entrance of a transparent glass
capillary. At several sites they formed whitish deposits with
a sharp cut-off at the front, as if they were piled up against
an obstruction. The stationary phase is, apparently, not al
ways sufficiently sticky to retain particles. After the first are
halted, however, others remain attached to them. In an ex
treme case (50 ul, on-column injections), a column was al
most blocked after some 100 injections. Sodium sulfate could
be rinsed from the column with water.
The use of an uncoated precolumn does not help this
problem, because the wall is not sticky.
Sodium sulfate particles have sorprisingly little effect on col
umn performance; silica gel tends to be more adsorptive.
Presumably the surfaces of the particles are readily deacti
vated, e.g. by fragments of stationary phase (column bleed).
Triglycerides Passing through the Precolumn
Another unresolved problem concerns materials with criti
cal intermediate volatility, such as fat or wax esters (from
plant extracts): they can pass through the uncoated pre
column, but not through the separation column.
As a rule of thumb, components pass through an uncoated
precolumn at a temperature 100-140° lower than through a
standard separation column. This means that, e.g., triglycer
ides and waxes move slowly through the uncoated pre
column at temperatures of 200-220 °e. They are stopped
at the beginning of the coated column and accumulate there
unless baked out at high temperature. Solute peaks will start
to tail and become broad. The analyst removes pieces ofthe
uncoated precolumn, but is disappointed, because this does
not eliminate the disturbing material: the first 20-40 cm of
the separation column must be cut off.
372
D 7. Reconcentration of Initial Bands To solve this problem, either oven temperatures are kept below ca. 180°C to keep the triglycerides inside the pre column, or increased to ca. 350°C to discharge the trig Iycerides through the separation column. Since triglycerides polymerize rather rapidly, they must be removed after every few runs. This presupposes, of course, a column of low re tention power and sufficient thermostability.
Precolumn with Thin Film of Stationary Phase
For the analysis of pesticides in edible oil by injector-in ternal headspace analysis (Section D8.3), precolumns coated with a thin film of stationary phase were used to retain the triglycerides up to the upper end ofthe temperature program (250 DC), but rapidly release them at ca. 320 DC through a purge exit positioned between the precolumn and the sepa ration column.
An Example
An application involving such problems, the analysis of "GX 071" in animal feed, was described by Arrendale et al. [831. Quantitation based on an internal standard resulted in a rela tive standard deviation of 0.8 % when using on-column in jection and of 2.8 % with splitless injection. A large amount of later eluted by-products (presumably fat or wax esters) created problems unless the column was heated to 320°C for at least 30 min after each run. Peaks became broadened and were split, without significant difference whether injection occurred splitless or on-column. Obviously even in splitless injection nearly all ofthe high-boiling mate rial was transferred into the column.
7.6.3. Press-Fit Connec tions
Various methods of coupling the precolumn to the separa tion column have been discussed [841. The press-fit connec tions introduced in 1986 by Rohwer et al. [851 have almost completely replaced alternatives such as butt connectors. They are practically free from dead volume and highly in ert (at least after brief conditioning).
Polyimide Seal
Press-fit connections are sealed by contact with the narrow ring of the polyimide coating on the tip of the capillaries to be joined (Figure 061). In fact, the coating consists of a material similar to Vespel, which is widely used for manu facturing thermostable ferrules. The fused silica must be bro ken squarely by means of a single, clean score (using, e.g., a Seal between the poly imide coating and the connector Fused silica \
Polyimide
/ ~----+------J
Tip of fused silica capillary
Press-fit connector
Figure D61 Fused silica capillaries are tightened against the press-fit connector by their own polyimide coating.
-7.6. Uncoated Precolumns - Retention Gap Techniques
373
piece of a silicon wafer or broken quartz), avoiding dam age of the polyimide. Breakage of Fused Silica
Cutting/breaking of fused silica (and glass) capillaries was studied by Roeraade [86). He found it difficult to obtain con sistent results. Fast cooling of the fused silica during manu facture results in high compressive stress, which is released upon breakage of the tubing and often results in cracks and jagged surfaces. Cracks can tear apart the polyimide and thus affect the seal. The best results were obtained by scoring the tube with a silicon wafer fragment and subsequent pulling with slight bending.
Forming the Seal
The fused silica butt should be wetted with a small amount of liquid (saliva being among the most successful) and gen tly pushed into the conical seat of the connector. High pres sure can result in excessive lateral force and cracks in the fused silica, resulting in small leaks. Much depends on the polyimide coating on the fused silica. Some high temperature fused silica tubing did not sit firmly in the connector, nor tighten or adhere to the connec tor after heating. This polyimide was, apparently, excessively hard and had no residual chemical reactivity to enable bond ing to the connector [87). It seems that the polyimide has since been improved.
Test for Tightness
Press-fit connections must be tested for tightness. After installation, the carrier gas inlet pressure is increased to a high level and the connection tested for leakage by means of a droplet of soap solution or a leak detector. In the event of a leak, stronger pressing rarely helps. The connection must be dismantled and the butt newly cut. Occasionally the conical seat in the connector is not concentric, necessitating replace ment of the connector. It is advisable to check tightness again after several heating cycles. If connections then prove to be still tight, they usually stay so for a long time.
Re-Using Connectors
Once press-fit connections have been heated above ca. 200°C, the polyimide sticks firmly to the connector. When an attempt is made to dismantle the connection, the capil lary usually breaks, rather than becoming detached. Connec tors with a piece of fused silica in the conical seat can be re used after heating to 500-550 °c for a few hours. This degrades the polyimide and the pieces of fused silica be come loose (88). The same can be achieved in a yellow flame, but the connector is easily overheated (deformed).
Thermostebilitv
Press-fit connections are thermostable up to ca. 350 °C; at 360°C, occasional leakage has been observed, but mostly disappeared again by itself. A plausible assumption is that leakage occurs as a result of degradation of the polyimide, but press-fit connections with aluminum-coated fused silica were not significantly more thermostable.
374
D 7. Reconcentration of Initial Bands
Additional Tightening
Press-fit connections are sufficiently tight for most applica tions, but when used with a mass spectrometer, additional air is often observed. Such leaks are too small to be discov ered by use of leak detectors or soap solutions and it is an open question whether they are relevant. Vecchi and Walther [89] proposed improving the tightness of press-fit connections with glue. The idea is convincing, but our experiments were rather disappointing. lightening of assembled connections by addition of a drop of polyimide resin (Figure D62) was temporarily successful, but after some heating, the connections usually started leaking [87]. Different thermal expansion of fused silica and glass might have pulled the capillary out of the press-fit seat. Experiments in which the resin (1:20 dilution in pyridine or methylpyrro Iidone) was applied to the region of the press-fit seat also failed. Drop of glue applied onto assembled connection
Glue applied before breaking capillary
Connector Press-fit seat
Figure D62 Improving the tightness of press-fit connections by use of glue? Drops of glue at the entrance of the connector seldom resulted in lasting tightness. Application of epoxy glue at the seat of the press-fit seal providad hardly better rasults.
The best results were obtained by using the two-component epoxy glue Epo-Tek H77-S, as proposed by Bemgard and Ostman [90]; a similar glue (Epo-Tek 353ND) was used by Clark and Jones [91]. It was applied as a thin layer after the fused silica had been scored, but before it was broken. Ex cess glue was removed with tissue. After installation, the columns were heated to 150°C for 15 min (with flow of car rier gas) to harden the glue. These seals were tight for an extended period of time, but the upper temperature limit was below 300°C. Several suppliers have introduced press-fit connectors with ferrules for additional tightening (e.g. VU unions from Restek). They are hybrids between butt connectors and press fits and, compared with butt connectors, have the advan tage of avoiding dead volume and contact with polymers in the region of the capillary tips.
7.7. Examples of the Use of Reconcentration Effects
Some practical aspects of the techniques used for reconcen trating initial bands are more easily discussed by use of real istic examples. It is unlikely that the reader will actually have to analyze the samples discussed, but the principles should be transferable.
7.7. Examples of the Use of Reconcentration Effects
375
7.7.1. Dioctyl Phthalate
Dioctyl phthalate is one of the most important plasticizers in polymers. It is eluted from standard apolar columns at ca. 220°C and is, therefore, a typical candidate for the use of cold trapping: cooling by at least 80° during splitless trans fer is no problem.
Manual Injection
If the sample is injected manually, the column is cooled in seconds by opening the oven door. The door is left open during the splitless transfer period provided band broad ening in space does not cause relevant peak broadening (the liquid wets the column inlet and the column is rather long), if the sample solvent does not recondense (volatile solvent), or if an uncoated inlet is used. Otherwise the oven should be closed before injection and thermostatted at, e.g., ca. 140°C (less than 20° below the solvent boiling point). After transfer is complete, the oven can be heated ballistically to the elution temperature.
Autosampler
If injection is performed by means of an autosampler or re tention times must be highly reproducible, the instrument is therrnostatted at 140°C and the temperature increased by means of a rapid program.
7.7.2. Traces of Tetra
Tetrachloroethylene, primarily used for cleaning, is analyzed in waste water. The detection limit required is 100 ppb, which is easily achieved, even with FID, by reconcentrating extrac tion and splitless injection.
chloroethylene
Volatility of Extraction Solvent
The extraction solvent must be selected not only on the ba sis of extraction efficiency, but also the requirements of split less injection. With an apolar column of standard film thick ness, the elution temperature is ca. 35-40 °C, which tells the analyst that application of cold trapping is impossible and solvent effects are needed. Pentane (b.p, 36°C) does not recondense, neither at this temperature nor after cooling the column to ambient temperature. Hexane (b.p, 68 DC) is pref erable, as it boils about 30° above the analysis temperature and solvent effects provide reconcentration even in fully iso thermal analysis. Band broadening in space is no problem because hexane wets all stationary phases and peak broad ening would occur only at temperatures more than ca. 50° above that used for injection. If the column is longer or has a somewhat thicker film, the analysis temperature might be ca. 60°C. If the chromatogra pher still uses hexane as extracting solvent, he must cool the oven to a temperature below 45°C for the sample trans fer period to achieve solvent recondensation. He probably prefers a higher-boiling solvent to enable injection at the elu tion temperature. Cyclohexane (b.p. 80°C) is critical, but isooctane or n-heptane (b.p. 100°C) are well suited.
7.7.3. Extraction of Water with Pentane
"Micro-pentane extraction" [921. using 0.6 to 0.8 mL pen tane to extract 1 I water, is rapid and sensitive for the analy
376
D 7. Reconcentration of Initial Bands
sis of a broad spectrum of organic compounds in surface or drinking waters. Pentane is chosen as solvent because it is readily available in high purity and avoids a broad solvent peak obscuring important gasoline components. It does not, however, recondense at ambient temperature. To achieve sol vent effects, the column temperature must be reduced below ca. 15 °e. The column can be cooled by means of a subambient ther mocontrol system. For manual injection it is quicker and cheaper to immerse the column into a bath of cool water which is stored in a refrigerator between the analyses. On-Column Injection
Whenever solvents are highly volatile, on-column injection is more convenient, because the maximum column tempera ture corresponds to the boiling point of the solvent at the inlet pressure (as a rule of thumb, standard boiling point + 1°/10 kPa inlet pressure) and solvent trapping is always in volved. This was actually the solution: on-column injection enabled injection at a column temperature of 35-40 °C. Fur thermore volumes up to 250 III are introduced, which greatly increases sensitivity and simplifies the analysis.
7.7.4. Semivolafiles in Cigarette Smoke
The semivolatile components of cigarette smoke (part of the tar) can be recovered from the glass fiber filters of smoking machines by extraction with diethyl ether. Ether (b.p. 36°C) does not, however, recondense in a column inlet kept at ambient temperature (open door). From this point of view diisopropyl ether (b,p, 56°C) or methyl tert-butyl ether (MTBE, b.p. 46°C) are preferable.
On-column injection is not advisable because the high load
of non-evaporating by-products would rapidly contaminate
the column inlet.
Co-Solvent
If the choice remains with diethyl ether, a higher-boiling co solvent, which recondenses at ambient temperature, can be added. Hexane seems ideal as far as its volatility and early elution from columns of intermediate to high polarity are concerned, but it solvates poorly and only weakly retains the more polar of the volatile constituents to be analyzed. Such solutes are partially solvent trapped and eluted as distorted peaks ("chair" or "stool" shapes). Dichloromethane, added 1:1 to the sample in ether, solved this problem (primarily by exploitation of phase soaking). It was either added to the vial or drawn into the syringe needle before the sample (per formed like a solvent flush injection). A higher-boiling co solvent is needed when autosampler injection requires a higher oven temperature (closed door).
Methanol as Extraction Solvent
Instead of diethyl ether, methanol is often used to extract the smoke components. Boiling at 65°C, methanol easily re condenses at column temperatures up to about 45 °C. There are, however, two problems to be considered. If the column is coated with a stationary phase of low polarity (less than
7.7. Examples of the Use of Reconcentration Effects
377
50 % phenyl in the siloxanel, recondensed methanol floods far into the column owing to poor wetting. This causes se vere band broadening in space, hence distortion of peaks eluted considerably above the temperature of injection. The problem can be solved either by using a wettable uncoated precolumn (e.g. "phesil" surface) or a column coated with a more polar stationary phase. The other problem concerns partial solvent trapping, i.e. insufficient retentive power of the polar methanol for vola tile solutes of low polarity. With polar columns of the Car bowax type, peak distortion is reduced owing to partial recon centration by phase soaking.
7.7.5. Solvent Residues in Pharmaceutical Prepa rations
Pharmaceutical tablets are analyzed for traces of solvents. It is most convenient to dissolve them in a late eluted solvent which does not interfere with the solvents to be analyzed (e.g. dimethyl sulfoxide, dimethylformamide, or ethylene glycol monoethyl ether). In capillary GC, solutes eluted before the solvent tend to be incompletely solvent trapped. They are too volatile to be retained by the solvent layer and tend to be eluted as se verely deformed peaks. There is no generally applicable means of avoiding this problem, although long columns with very thick (e.g. 5 urn) films of stationary phase reduce the peak distortion [93,94). Split injection is usually used to re duce the amount of solvent entering and recondensing in the column; this is, of course, paid for by reduced sensitivity.
7.7.6. Headspace Analy sis
Headspace analysis commonly involves split injection, so that acceptably narrow initial bands are obtained. Sensitiv ity is, however, often lacking, and the analyst looks for ways of introducing the sample in splitless mode. There are in deed some possibilities of reconcentrating initial bands, pro vided there are no extremely volatile components to be analyzed.
Cold Trapping
Reconcentration by cold trapping depends on the possibility of increasing the column temperature between injection and elution. For headspace analysis, these possibilities are usu ally limited, but they might be sufficient, especially if some peak broadening can be tolerated. Columns should have maximum retentive power, i.e. should be long, coated with a stationary phase similar in polarity to the solutes, and with the thickest film available. The oven temperature during in jection should be as low as possible. With manual injection, the oven door can be opened, which reduces the tempera ture by as much as 10°C below those achievable by auto mated operation with a closed door. Reconcentration is improved by cooling the column (or a part of it) below ambient temperature. Cooling increases the retentive power down to the temperature at which the sta tionary phase solidifies (at still lower temperatures the re tentive power first drops drastically before increasing again).
378
0 7. Reconcentration of Initial Bands
Many immobilized stationary phases of low polarity retain their liquid properties down to -20 °C (or even lower, if only short-term cooling is applied). Solvent Effects
Kurt Grob [95J showed that solvent effects can be used to reconcentrate broad initial bands in headspace analysis, pro vided the solvent peak does not obscure important solute peaks. Injection is performed in two steps using two syringes. First, pure solvent (e.g. dichloromethane) is injected. When the bulk of the solvent has entered the column, form ing the desired layer of liquid, the headspace sample is in jected. liming is important: if the headspace sample is in jected too soon it displaces the solvent vapor from the col umn entrance and prevents a sufficient amount of solvent from reaching the column before the sample itself enters; if it is injected too late the solvent evaporates before transfer of the headspace sample is complete.
7.7.7. Solvent Effect. at Elevated Column Tem peratures
For analyses performed at elevated temperature, cooling of the column during the splitless period can be avoided if the sample is injected with a solvent boiling ca. 30-40 °C above the analysis temperature, i.e. by using high-boiling solvents which recondense and create solvent effects. It is, for instance, possible to perform isothermal splitless analyses at 200 °C by using a solvent boiling at ca. 230-240 °C (e.g. n-tridecane).
Advantages
The use of high-boiling solvents has some important advan tages. It saves time, because the column temperature can be kept constantly high. 2 Solvent recondensation accelerates transfer of the sample from the injector into the column. 3 High-boiling solvents prevent evaporation of the sample inside the syringe needle and related prob lems. 4 In the vaporizing chamber, solutions must be depos ited on to surfaces (band formation). Evaporation is slow and smooth, which renders processes in the injec tor more reproducible. 5 High-boiling solvents produce small volumes of vapor, i.e. more can be injected and transfer into the column is faster.
Sample Preparation: Solvent Exchange
A major practical limitation ofthis technique is the purity of
high-boiling solvents.
Sample preparation with high-boiling solvents is difficult,
because, e.g., reconcentration by evaporation is impossible.
The sample must be worked up with a volatile solvent.
Then the solvent is exchanged by addition of the high-boil
ing solvent and evaporation of the solvent used for sample
preparation. If the high-boiling solvent is admixed as a co
solvent without removal of the volatile solvent, some of the
above advantages are lost.
7.7. Examples of the Use of Reconcentration Effects Experimental Result
379
BrOtell et al. [961 experimented with double injections, in jecting hexane solutions after introducing a high-boiling co solvent, such as pentadecane (b.p., 271°C), and determined the conditions providing optimum column efficiency for DDD and DDT ti.e. minimum band broadening arising from injec tion). 5 ul, of co-solvent were rapidly injected together with 5 ul, (!) of sample (introduced in 3-4 s). Fully isothermal runs were performed at 210°C.
8. Related Injection Methods 8.1. Direct Injection
Direct injection is distinguished from splitless injection by
the use of an injector with no split outlet, allowing neither
split injection nor rinsing of the vaporizing chamber after
splitless sample transfer. The connection from the vaporiz
ing chamber to the column is "direct".
Direct injection is a vaporizing technique, i.e. the sample is
introduced into a hot chamber and transferred to the col
umn as a vapor. Injection directly into the column is not called
"direct", but "on-column".
Complete Sample Transfer
The main advantage is that the permanent and exclusive
discharge from the liner into the column ensures complete
transfer of vaporized solute material into the column. loss
as a result of premature purging of the injector is ruled out.
If the solvent peak has a reasonable shape, not only the sol
vent, but also the vaporized solutes are well transferred. In a
temperature-programmed run, adsorbed or retained mate
rial can reach the column only after several minutes, yet still
be eluted with the bulk as a peak. This does not, of course,
rule out that more strongly adsorbed or retained materials
remain in the injector.
Use for GC with 0.53 mm i.d. Columns
Direct injection became popular with the 0.53 mm i.d, col
umns, particularly in North America. There were several rea
sons for this.
1 Sample splitting is less important because "megabore"
columns are usually also "megafilm" columns with a capacity approaching 1 Jlg. 2 0.53 mm i.d. columns are used at high flow rates, which helps overcome the major problem of the technique. 3 Direct injection is often applied with instrumentation designed for packed column GC, because packed col umn injectors can easily be adapted to capillary columns as long as no split outlet must be installed.
B. 1. 1. Injector Design
Direct injection must obey the basic rules of splitless in jection and the injector must fulfil the corresponding re
380
D 8. Related Injection Methods quirements. The internal volume of the vaporizing chamber must be sufficiently large to accommodate the cloud of di luted sample vapor. A thorough treatise on this subject was published by Silvis [971.Even with column flow rates of, e.g., 10 mLJmin, sample evaporation produces vapor at a far higher rate than can be discharged into the column: if 2 ul, of sample evaporate in 0.5 s, vapor is generated at 60-120 niLJ min.
High Flow Rate during Transfer
Because the injector is not rinsed at the end of the sample transfer, narrow solvent peaks can be obtained only when transfer of the sample vapor is efficient, i.e. if there is little mixing with carrier gas in the vaporizing chamber (high gas velocity). This calls for high column flow rates or a tem porary increase of the flow rate during transfer. The solvent peak becomes acceptable at carrier gas flow rates of ca. 10 mLJmin, in a 4 mm i.d. vaporizing chamber producing a gas velocity of 13 mrn/s.
Column Connections
The bottom end of the vaporizing chamber and the connec tion with the column must be designed such that there is no dead volume below the column entrance from which vapor might enter the column during extended periods of time (causing broadening and tailing of, primarily, the solvent peak). This rules out arrangements like that of the conven tional split/splitless injector (shown as A in Figure D63).
'0El'
_ _'Elc'septum _ _ Carrier
purge
gas
Press-fit seal Split
Q~outlet
Splitlsss injector
Glass liner with seal 10 column
Melal liner directly coupled to column
Vaporizer with on-column injection
A
B
C
o
Figure D63 Injector designs in relation to direct injection.
Butt Connection
The capillary column can be butt-connected to the bottom of the liner. If a packed column injector is used, this is, in fact, an inexpensive means of adapting it for use with capil lary columns: a glass tube with the outer diameter of a packed column is fitted into the injector by means of the normal fit ting. The base of the glass tube is drawn to a narrow bore to enable connection with the column. The connection is, how ever, fragile - tightening requires well controlled manipula tion.
8.1. Direct Injection
381
Restek introduced the deactivation of metal parts by the "Silcosteel" procedure. This enables the construction of steel liners as shown in C of Figure D63. The column is connected to the liner by means of a ferrule and screw fitting to a threaded liner. This could replace fragile glass liners. Shrinkable PTFE TUbing
In the early days of capillary GC, the connection between the liner and the column was often prepared with shrinkable PTFE tubing, which is used for the insulation of electric wires and can be obtained from corresponding sources. Thermosta bility is, however, poor: above 180°C, PTFE absorbs solute material and above 230°C its mechanical stability becomes critical.
Press-Fit Connections
Fused silica columns are most frequently connected to the liner by means of a press-fit seal (8 in Figure D63). Demands on tightness are not high since the seal against ambient pres sure is made by the ferrule of the column attachment. The press-fit seal should, nevertheless, be checked by setting pressure on the carrier gas supply and loosening the col umn attachment. A strong leak causes solvent to pass the connection point and return slowly, deforming the solvent peak, as shown by Mehran (98]. After heating above 200°C, the polyimide of the fused silica tends to stick to the seat of the connection so firmly that it breaks if attempts are made to remove it. This means that the liner must be replaced whenever the column is replaced. The capillary butt remaining in the seat can be removed af ter heating the liner to 500°C (decomposition of the polyim ide).
B.1.2. On-Column Injec tion?
In 1979, Kern and Brander (99] described a direct injector with an 0.8 mm i.d. liner directly connected to the column, being a kind of on-column injector with a heated tube elon gating the column inlet. Later, kits to convert packed column injectors into capillary column direct injectors were advertized to enable on-column injection. The 0.53 mm i.d, column or a precolumn of the same bore is positioned nearthe top of the injector (D in Figure D63). The constriction in the liner forms the conical seat for the press-fit connection and serves to guide standard 265 gauge syringe needles into the col umn (Jennings and Mehran (100], Hinshaw (101l). Depend ing on the length of the syringe needle, the point of injection is somewhere in the center of the injector.
Excessively High Tempera ture
Such techniques do not fulfil the two most basic requirements of on-column injection. Although the heater of the injector can be switched off, the injector temperature is usually far above the boiling point of the sample solvent (the injector is heated from the oven and from the heating block of the de tector; its insulation prevents dissipation of heat). The high temperatures have two consequences.
382
D 8. Related Injection Methods
2
They are likely to cause sample evaporation inside the syringe needle, with the consequences of selec tive losses of high-boiling material and uncontrolled in jection volumes. If the point of injection is inside the injector, part of the sample liquid flows into the oven-thermostatted column, but some of it remains on the capillary wall inside the injector. Vaporization of high-boiling solutes requires an injector temperature not far below the maximum used for analysis (or a PTV injector to increase the tempera ture after the injection); this brings us back to "hot on column" injection.
Low Oven Temperature During Injection
Owing to the lack of room in the column inlet for the vapor
generated by fast sample evaporation, conventional on-col
umn injection requires that the oven temperature during in
jection be below the solvent boiling point. This limits the
amount of vapor formed to that which can be discharged by
the carrier gas. With hot on-column injection, the large vol
ume of vapor generated inside the injector expands by over
pressure. Only recondensation into a cool oven-thermostat
ted column inlet might pull it onwards at a rate sufficient to
prevent backflow out of the column entrance. Hence oven
temperatures during injection must be clearly below the sol
vent boiling point.
Conclusions
In capillary GC, on-column injection provides the most accu
rate results and avoids loss of solute material by degrada
tion. These advantages are lost in "warm" or "hot"
on-column injection.
The technique might produce better results for adsorptive
components because the column inlet is usually more in
ert than the liner.
Involatile sample by-products are a problem as in on
column injection, since they are partly carried into the oven
thermostatted column.
8. f .3. Injection of Large Volumes
In 1990, Watanabe and Hashimoto (1021 reported injection
of up to 100 III of liquid samples by a combination of di
rect injection and retention gap technique. The sample
was introduced slowly (ca. 5 IlLJS) into an injector at 250
300 cC. The vapor was discharged concurrently by means of
a high carrier gas flow rate and solvent recondensation in
the column inlet.
Injector
A Hewlett-Packard 5890 instrument was used with a packed
column injector containing a 2 mm i.d. liner. The tempera
ture profile of the injector had to be improved to elimi
nate tailing peaks for the solvent and the high-boiling sol
utes. Insulation of the injector head was improved and an
additional heater added to the column attachment zone.
8.1. Direct Injection
383
Carrier Gas Supply
The carrier gas supply was modified to enable an increase of the column flow rate during solvent evaporation. The gas supply line was split and a pressure regulator mounted parallel to the mass flow regulator. The flow regu lator delivered the high gas flow rate (10-20 mLJmin) for the solvent evaporation period. After completion of the injection process, this supply line was shut and the pressure regula tor delivered the column flow for analysis. The separation efficiency of the system was reduced by ca. 10 %, possibly because of the large precolumn.
Uncoated Precolumn
An uncoated precolumn of 17-20 m x 0.3 mm i.d. was used. It had the capacity to retain 100-120 ul, liquid [1031. The hexane solution introduced at 5 JlLJs produced vapor at a rate of almost 1 mLJs. At a carrier gas flow rate of 10 mLJmin (0.167 rnt/s), ca. 15 % ofthe solvent was discharged through the column concurrently with the introduction, while 85 % spread as a racondensed liquid in the uncoated precol umn.
Comment
The technique described by Watanabe and Hashimoto is a precursor of large volume splitless injection with a solvent vapor exit as described in 1994 by Suzuki et al. (Section D4.2) and of the vaporizer/precolumn solvent splitting system de scribed in 1996 [291, where a hot vaporizing chamber was added to an on-column system.
Valve against Backflow
Section D3.3.8 summarized the proposal of Kaufmann in which a valve (e.g. a Jade airlock) was introduced above the liner to close the vaporizing chamber during the period when solvent evaporation causes overpressure. In another paper [104). Kaufmann proposed the use ofthis valve for large vol ume injection. His system brought together elements from Watanabe and Hashimoto (see above) as well as from Suzuki. He used a 4 mm i.d. direct liner (Uniliner, Restek) with the Jade valve above it. The liner was packed with fused silica wool to slow down evaporation (7). The sample was transferred to a 15 m x 0.53 mm i.d. uncoated precolumn leading to an early vapor exit and the separation column. 50 III of a solution in ac etone was injected at 50°C oven temperature, hence recon densing part of the solvent.
B. 1.4. Evaluation of Direct Injection
For general evaluation, direct injection must be compared with splitless injaction, because it is a non-splitting method suitable for the analysis of dilute samples, including samples loaded with involatile by-products.
Shape of the Solvent Peak
In direct injection, the shape of the solvent peak is often a problem when the detector is sensitive to the solvent. Two solutions are viable: the use of high carrier gas flow rates (at least 10 mt/min) or of an increased gas flow rate during trans fer (implying flow or pressure programming).
384
0 8. Related Injection Methods
In splitless injection, a perfect solvent peak can be achieved even under conditions of poor sample transfer. While this is certainly of advantage to the visual appearance of the chro matogram, it hides imperfections affecting quantitative analy sis. Quantitative Analysis
Shagena and Hinshaw [1051 found an improvement in both detectability and reproducibility of results when comparing wide-bore columns and direct injection with packed column GC. Mallet and Mallet [1061 performed a similar comparison for the analysis of organophosphorus pesticides and con cluded that although the separation efficiency improved, the reproducibility of the results deteriorated somewhat.
Comparison with Splitless Injection
No experimental data comparing direct and splitless injec
tion are available, apparently because ofthe widespread (but
unjustified) belief that the application of direct injection is
restricted to 0.53 mm i.d columns and that of splitless injec
tion to those of narrower bore.
1 Quantitation by direct injection is expected to be more
reliable because it rules out losses from premature purging of the injector (see above). 2 Direct injection is simpler because there is one fewer variable to select, i.e. the duration of the splitless pe riod. 3 Owing to the direct connection of the vaporizing cham ber to the column, there is no possibility of shooting the sample past the column entrance or of vapor being driven into the split outlet by the pressure wave during evaporation. This also means, however, that the sample must pass through possible deposits of septum particles and other dust located above the column en trance (the same as in splitless injection when wool is placed above the column or the column entrance is po sitioned below the orifice of a "goose neck" liner).
"Ghost" Peaks
The permanent and complete transfer of material from the injector into the column can also be a drawback: involatile sample by-products on the liner wall often slowly de grade to more volatile products and with direct injec tion, all this material is transferred into the column. In iso thermal chromatography it merely elevates and disturbs the baseline, but in temperature-programmed runs it leads to the formation of" ghost" peaks (after reconcentration by cold trapping). In splitless injection, these materials are split (ex cept during the splitless period); if necessary, the split flow rate can even be increased to remove more of the degrada tion products.
Column Attachment
Particularly after the introduction of programmable carrier gas supply (high flow rate for transfer), direct injection seems highly competitive with splitless inj~ction. It is, never
-8.1. Direct Injection
385
theless, rather seldom used. This certainly has to do with the conservative attitude of analysts in routine laboratories, but also with the difficulty of mounting the column. None of the systems marketed so far can compete with the simplicity of column installation into a classical splitless injector.
8.2. Solid Injection
"Solid injection" means introduction of a sample free from solvent. The term is also used when the solvent-free resi due of a sample is actually a liquid. Numerous solid injection techniques have been conceived, but most have disappeared again. In the early nineteen sev enties, sample extracts were loaded into glass capillary tubes 2 cm long. Some 30 could be placed in a manifold (Carlo Erba, Milan) in which the solvent was evaporated un der vacuum. The capillaries were then loaded into a revolv ing device which dropped them into a heated liner. After a number of analyses the accumulated tubes had to be re moved from the liner. Another system involved metallic cap sules which were filled with sample and closed. In the injec tor, they were opened pierced by a thorn.
Damage by Solvent?
At that time, there was a widespread belief that the solvent should be removed from the sample before injection. The main reason was the fear that the solvent could damage the column. Today we know that this is not true (for the most commonly used solvents at least), not even for large volume injection. Detectors, also, are not affected by the amounts of solvent introduced in splitless injection. On the other hand, problems related to large volumes of vapor (required size of the vaporizing chamber, slow discharge through the col umn) do, indeed, arise as a result of the solvent, but this has not been used as an argument for solid injection.
8.2.1. Moving Needle Injection
In the early days of capillary GC, the strongest competitor with splitless injection was the moving needle injection in troduced by van der Berg and Cox in 1972 [1071. It found particularly wide application in France. The semple was deposited on to the tip of a glass nee dle at ambient temperature, held vertically in a tube mounted above the heated injector chamber (Figure D64). The sol vent was evaporated in a stream of carrier gas leaving the tube through the top. The needle was then lowered into the vaporizing chamber (by means of a magnet), where the sam ple components were vaporized and transferred into the col umn under splitless conditions.
Evaluation
Deposition of the sample liquid on to the cool needle rules out problems related to evaporation inside the syringe nee dle. Volatile solute material is lost by co-evaporation with the solvent, restricting the application to components of in termediate to high-boiling point (starting, for instance, with methyl palmitate). The vaporizing chamber can be small, enabling efficient transfer into the column.
386
D 8. Related Injection Methods Resistance for controlled release of gas and solvent vapors Magnet to move the needle; up position for loading
Syringe depositing extract onto the needle tip
Gas supply Vaporizing chamber Heating block
Column
Figure D64
Moving n_dle injector.
Albaiges et al. [1081 compared splitless and moving needle injection for a test mixture comprising the C16-C36 n-alkanes. Splitless injection provided better results in terms of discrimi nation, but the reproducibility for the higher alkanes was slightly better for the moving needle technique. Automation
Automation of moving needle injection is difficult. This might be one of the reasons why the technique has largely disap peared. Analytical Services (Poitiers, France) introduced a system called "Injecteur Automatic en Phase Solide" (APS) which automates a moving needle injection of different de sign. The sample is applied to a cool needle from which the solvent is evaporated. This needle is introduced into a nar row vaporizer for thermal desorption. After withdrawal, the needle is heated to pyrolyze and remove the remaining involatile material. Heating of the needle can also be used for pyrolysis analysis.
8.2.2. Direct Sample
More recently, solid injection was revived for the direct in troduction of a piece of sample for thermal desorption of the components of interest. Instead of the needle the APS sys tem mentioned above can be equipped with a tool designed to hold fibers, such as hair (e.g. for drug analysis), plant or polymer fibers, or wire. A third tool is a vial for powders or small objects (e.g. a piece of cork to check for off-flavor).
Introduction
8.2. Solid Injection
387
Advantages
The following advantages were listed: reduced sample manipulation, avoidance of solvents, higher concentration (no dilution during an extraction), retention of involatile material in the sampling system, better transfer into the column (small vaporizing cham ber). The main drawbacks are probably related to the difficulty of thermal desorption from a complex matrix and the small size of the sample being representative of highly homoge neous samples only.
Pesticide Analysis
Jingand Amirav[109] described a device marketed by Varian as the "ChromatoProbe", which fits the Varian 1078 or SPI injectors. They used 1.6 mm o.d.{1.2 mm i.d. sample vials 10-15 mm long in a vial holder system replacing the septum cap of the injector. Sampling involved the following steps: 1 1-5 ul, of sample extract or homogenate in solvent were transferred to the vial and the vial was introduced into the holder. 2 The vial was transferred into the injector at 80-90 °C for solvent evaporation, with the column at 70°C for cold trapping of the solutes. At a split flow rate of 50 mLJ min, solvent evaporation lasted 1 min. 3 The injector was heated at 300 a/min to 250°C and held there for 30 s, the split outlet being closed. During this splitless period, the components of interest (pesticides) were "thermally extracted" while the matrix material remained in the vial. 4 The vial was removed from the injector and disposed of. While the injector was open, a protective carrier gas flow prevented air entering. As an example, 150 g tomatoes were blended with 300 ml acetone, of which 1.6 III was placed in the sample vial. Diazinon, parathion, methyl parathion, methyl trithion, and ethion were analyzed with the pulsed flame photometric detector (PFPD), with a detection limit of a few ppb. A carrier gas flow rate of about 5 rnt/rnln was required, because re covery of the high-boiling components was low at 1 mLJmin.
Drug Analysis
For the analysis of drugs in hair, a single 1 cm piece of hair was placed in the vial with 10 III methanol [110]. The vial was introduced into the injector at 120°C, then heated to 250 °C. This enabled the detection of cocaine and 6-mono acetyl morphine. Other analyses included drugs in urine (the urine sample was placed directly in the vial),
Thermal Desorption
Quantitative thermal desorption is a major problem in direct sample introduction. 1 The sample cannot be heated to high temperatures be cause thermal degradation of the matrix produces "forests of peaks" in the chromatogram.
388
0 8. Related Injection Methods
2
The solute material may be enclosed in solids, particu larly after drying at high temperatures. 3 Deep and narrow bore sample vials do not enable effi cient extraction of solute vapor, because there is no gas flow sweeping the sample out; solutes must leave the vial largely by diffusion. If the analysis must merely determine the presence of a given component, and this is often the only requirement, incom plete thermal desorption is, of course, of secondary concern.
8.3. Injector-Internal Headspace Analysis
The method to be described here could also be termed "di rect sample introduction with thermal desorption". The origi nator, Morchio [111), did not give it a name. We prefer "In jector-Internal Headspace Analysis" since this was, at least initially, the main field of application. It differs from the above technique by restricting the sample matrix to a high-boil ing liquid, the most important being edible oil or fat. Seen from this angle it could also be termed "thin film desorption". The technique was first described in 1982, but remained an Italian secret because most ofthe workwas published in the Italian language.
Steps of the Process
2
3 4
The sample is injected by syringe and transferred to the liner wall (Figure D65). It forms a film from which the volatile components evaporate and are transferred into the column (in split or splitless mode). Most of the non-evaporating material (oil) slowly flows along the wall to the bottom of the liner. The oil accumulates in a bag. Syringe Septum
Needle with side port hoi
1 Oil transferred to liner wall 2 Volatiles evaporate
3 Oil flows to bottom
4 Oil accumulated from previous injections
Figure D65 Liner for injector-internal headspace analysis and the four steps of sampling involved. (From ref. [112].)
8.3. Injector-Internal Headspace Analysis
389
High Temperature
Injector-internal heads pace analysis occurs at a higher tem
perature than is usual for headspace analysis. The injector
temperature is primarily limited by the volatility of the ma
trix, because the matrix should not evaporate and enter the
column. For edible oils and fats, the maximum is ca. 200
220°C.
Supported by intense stripping of the solutes from the thin
film, evaporation is complete for solutes of up to rather high
boiling points, such as pesticides. This greatly extends the
range of application and simplifies quantitation, because
evaporation and transfer are mostly complete, rather
than in equilibrium with the matrix.
Liner with Bag
Injector liners with the specially designed bottom are avail
able for ThermoQuest instruments.
Packing of a standard straight liner with wool also stopped
the oil above the column entrance and was simpler to use,
but after a few injections, peaks of pesticides were broad
ened and reduced in area. The oil accumulated and built up
increasing retentive power. With the open tubular liner, most
of the 'oil slowly flows to the bottom, making way for the
next sample.
Column Entrance
The column entrance should be positioned above the ori
fice of the indentation (Figure D65) such that vapor or deg
radation products from the oil diffusing out of the bag are
carried away into the split outlet and cannot reach the col
umn.
Injection
1-3 u], of oil or fat, undiluted or mixed 1:1 with acetone, were
injected by use of a syringe with a side port hole needle.
The needle was inserted 4 em, depositing the sample in the
upper part of the chamber. A splitless period prolonged to 4
min improved the results, because it enabled complete trans
fer also for components which were somewhat retained by
the oil.
Dilution with solvent helps withdrawal of viscous or solid
samples into the syringe. Visual experiments showed, how
ever, that the volatile solvent can hinder transfer to the
liner wall. For this reason samples should not be diluted by
more than a factor of about four.
Cleaning of the Liner
Cleaning of the liner with dichloromethane is simple as long
as the oil is not polymerized and should, therefore, be per
formed at the end of every day.
Oil polymerizes in the presence of air, for instance when the
carrier gas is switched off overnight. The resulting yellow or
brownish polymer is best transesterified in warm methoxidel
methanol solution, as this is less aggressive than aqueous
alkali and leaves behind surfaces which are less adsorptive.
The liner should then be rinsed with 1-5 % hydrochloric acid
(to remove highly adsorptive vicinal silanols) and dried in
the hot injector with the septum cap removed (1-3 min).
r !
390
0 8. Related Injection Methods
Contamination of the Column
After some 20 injections, peaks usually started to become broad as a result of high-boiling material accumulating in the column. The disturbing material probably consists of trig Iycerides and minor components, e.g. mono- and diglycer ides, free sterols, and squalene.
Uncoated Precolumns?
Uncoated precolumns do not help when oven temperatures exceed about 200°C. Because of their low retentive power, even triglycerides slowly move through them and ac cumulate in the inlet of the separation column; replacement of the precolumn is no longer effective. The problem can be solved by heating to 350°C, discharging the material through the whole column. Such cleaning must occur before the un saturated compounds polymerize.
Cleaning through Purge Exit
Because the removal of high-boiling material must occur rather frequently and the separation column is often not suit able for baking out triglycerides, the disturbing material was discharged through a purge outlet (Figure D66) consisting of an 0.32 mm i.d. fused silica capillary placed behind a 2 m x 0.25 mm i.d, precolumn coated with an 0.08 11m film of a methylsilicone. On the one hand, this thin film enabled discharge of the triglycerides at a modest temperature. On the other, retentive power was sufficiently high to prevent high-boiling material from reaching the separation column up to oven temperatures of ca. 250°C. Every evening, the purge exit was opened and the oven tem perature increased to 330 °C for 5-10 min. The high gas flow rate through the short precolumn results in rapid discharge. The exit was closed either by means of a press-fit cap, pre pared from a press-fit connector divided into two and flame sealed in the center, or a soft septum.
Injector I
Purgeexit with press-fitcap
Detector
¥
v\
Thin film Separation column
precolumn
Figure D66 Precolumn and purge outlet for the discharge of matrix material of intermediate volatility, such as edible oil. (From ref. [112].) .
-8.3. Injector-Internal Headspace Analysis Applications
397
The method was first used for the determination of solvent residues (hexane) in edible oils. Mariani and Fedelithen ap plied it for the analysis of antioxidants, such as BHA, BHT. and Jonox 100, in edible oil [1131. later for chlorinated sol vents [114]. Morchio, de Andreis, and Verga [115] described the determination of organophosphorus pesticides in edible oils (or fats) by injection of the oil. Using flame photo metric detection (FPD),the detection limit was ca. 1 ppb. Droz [116] applied the technique to the analysis of chlorinated pesticides in edible oils and fatty foods (such as extracts from fish), as well as for detection of fqod irradiation by analysis of the olefins cleaved from triglycerides. We have used it for the analysis of flavor components in extracts from fatty foods, in particular for the gamma- and delta-deca and dodecalactones.
9. General Evaluation of Splitless Injection It is difficult to answer a question as general as "how accu rate are results obtained by splitless injection" or rather "how accurate can they be under thoroughly optimized conditions". Many papers, primarily from the nineteen eighties, deal with this question, but they actually report data on precision (re producibility) rather than accuracy. More data are avail able from method validation, but now splitless injection is merely a contributor to a more complex system of uncer tainty. 9.1. Data on Precision from the Literature n-Alkanes
Generally Valid Conclusions?
In 1982, Watanabe et al. [117] found coefficients of variation for split/ess injection on to capillary columns to be far higher than for packed column GC. For the area ratio of the C12 and C28 n-alkanes in hexane and an injector temperature of 250°C it was nearly 40 %. When the injector temperature was in creased to 350°C, it decreased to 2 % and even for the n-C12/ C44 area ratio it was only 6 %. Such high coefficients of variation at 250°C injector tem perature should be understood as a sign that something went fundamentally wrong. Discrimination against high-boiling compounds was, in fact, extremely high: when the injector temperature was 250 °C. 80 % of the ,..C28 was lost; at 350°C, however, only 20 % of the n-C28 and less than 40 % of the n-C44 were missing. Some results are summarized in Figure 067. The question arises as to the extent to which such results can be used as a basis of generalized statements. According to our experience, they are poor for clean test samples.
392
0 9. General Evaluation of Splitless Injection
..g• .
1.20
u.. 1.00
..
;0 0
.... ..li ~
0.80
U!
U!
ll!
0.60
~ ...
.~..
0.40
(C)
0.20
CARBON NlIMBER
Figure D67 Discrimination curves for C12-C44 ...alkanes with different injection techniques. (From Watanabe et al. [117].) A. Capillary GC. on-column injection. B. Capillary GC. split less injection. injector at 350°C. C. Same. but injector at 250°C. D. Packed column GC. on-column injection. E. Packed column GC. flash evaporation injection. injector at 350°C. F. Same. but injector at 250°C.
At an injector temperature of 250 °C, coefficients of variation for C28 are usually 3-6 % and discrimination, primarily as a result of losses inside the syringe needle, below 15 %. The results suggest that some (then still unknown) elemen tary rules were neglected. Neither the syringe needle han dling technique is described nor is information provided on injector geometry, the temperature of the injector head, or the length of the syringe needle. The carrier gas flow rate (hardly 1.3 mLJmin) was low. On the other hand, most of today's injectors are similar, and in routine laboratories the know-how on optimizing conditions is probably inferior. Hence such performance could easily be obtained even to day. Maybe the data should be understood as a warning about the possible extent of errors. Polyaromatics
Springeret al. [118] did not obtain better results, even though they merely used standards in a pure solvent. The mix ture contained polynuclear aromatics (PNAs) and a few n alkanes serving as internal standards. A very high injector temperature (380°C) was found to provide the best results. The coefficient of variation for peak areas of pyrene (4-ring system eluted at ca. 170-200 °C) normalized with respect to n-decane was, nevertheless, as high as 15 % (only 1 % if n eicosane was the internal standard). The carrier gas flow rate at the column temperature during sample transfer was
-9.1. Data on Precision from the Literature
393
hardly 1 mllmin and the splitless period lasted for only 30 s. The coefficient of variation for absolute areas of a compo nent like pyrene should not exceed 5 %. It should be lower if an internal standard is used, irrespective of whether it is n decane or n-eicosane. In 1985, McMahon [1191 reported results of a collaborative study on the quantitative results obtained by split, splitless, and on-column injection using a sample of polyaromatic hydrocarbons (naphthalene to chrysene). Results were based on an internal standard. After excluding outliers, the relative standard deviation of the results from 23 laboratories was ca. 6 %. On-column injection produced clearly better results.
Comparison with Split Injection
Schomburg et al. [1201 tested splitless injection with a mix ture of C18-C36 n-alkanes in different solvents and came to the conclusion that although the performance of splitless injection was better than that of split injection, it de pended strongly on solvent volatility. Most of the deviations resulted from syringe needle problems.
Phenols
Kalman [1211 reported results on the determination of free phenols. Although he did not use conditions which could be considered optimized, standard deviations were mostly 1-2 % when an internal standard was used and about three times higher with use of an external standard (25 ng/flL solu tions).
Chlorinated Benzenes and Biphenyls
In 1983, Onuska et al. [1221 evaluated splitless and on-col umn injection for the analysis of chlorinated benzenes and biphenyls. They concluded that quantitative results obtained by splitless injection were not satisfactory, particularly so if mixtures contained components with a wide range of vola tility. "The splitless injector acts like a non-linear splitting device and delivers unpredictable and irreproducible quantities of individual components on to a WCOT column. " This is an unusually clear statement in a scientific journal. Manual injection resulted, in fact, in data with relative stand ard deviations of up to more than 30 % and which changed from one day to the next. With an autosampler, re producibilities were within a few percent. The experiments were performed on two types of instrument, both equipped with liners which were much too small.
Drugs
Plotczyk [1231 reported coefficients of variation of 5-12 % for absolute peak areas of drugs when the injector was kept at 200-250 °C. With an internal standard, relative stand ard deviations were ca. 5 %. The test mixture was synthetic, hence free from involatile by-products.
Pesticides
Stan and Goebel [1241 tested the repeatability of splitless and on-column injection for mixtures of pesticide standards,
394
D 9. General Evaluation of Split/ess Injection
using the internal standard method. Relative standard de viations for chlorinated pesticides varied between 0.2 and 5.5 % (mean 1.7 %), those for the organophosphorus pesti
cides between 1.1 and 11.8 % (mean 3.4 %).
Response factors obtained with splitless injection were
checked with those from on-column injection. Compared with
the internal standard, up to two thirds of the later eluted
material was lost, whereas the peaks of some other compo
nents were up to 60 % too large (owing to discrimination
against the internal standard).
9. t, t, Limited Utility of Literature Data
9. '.2. Message to a Lawyer
The utility of such data for a generalized evaluation of split less injection must be questioned for the following reasons. For the determination of accuracy, data on precision (re producibility) is of limited value. Systematic errors of ten far exceed random errors (standard deviations). Deviations arising from discrimination or incomplete sample transfer often change from one set of conditions (e.g. for the calibration mixture) to another (e.g. for the analysis of the sample). Data on precision can, there fore, only be used to estimate the minimum probable error - and this is hardly what we are interested in. 2 Hardly any of the reports adequately specifies the ex perimental details. It is, therefore, impossible to con clude whether high standard deviations were a result of poorly optimized conditions or of the splitless injection technique per se. Unfortunately most of today's stand ardized methods are no better at specifying injection conditions. Hence analysts cannot be expected to pro duce better results. 3 The reproducibility tests reported were performed with clean, synthetic mixtures. Real samples containing a considerable concentration of high-boiling or involatile by-products tend to be characterized by higher devia tions (drifting matrix effects). Most results from analytical laboratories eventually end up on the desks of engineers or lawyers who have to make decisions based on our results, but know nothing about analytical chemistry (except that our results are expen sive and not very reliable). If they asked for some general indications on accuracy and reliability, we might give them the following answers. 1 Despite the much higher cost, trace components can not be measured as reliably as temperature in the office. 2 It is probably more difficult to determine the range of uncertainty than the concentrations or amounts them selves, because standard deviations and linearity tests provide minimum rather than maximum deviations. 3 If sampling and sample preparation do not signifi cantly contribute to deviations, relative standard de
9.1. Data on Precision from the Literature
4
5
6
7
S
9
9.2. Comparison with Alternative Techniques
9.2. 1. On-Column Injec tion
Better Performance
395
viations easily reach 10 %. Then statistics tell us, e.g., that there is 65 % probability that the true value is between 9 and 11. To obtain 95 % certainty, the range must be widened by a factor of two. Statistically there is, however, still 5 % probability that the true value is below S or above 12 - and in reality, the probability is ratherhigher than 5 %. Standard deviations do not include systematic errors. Systematic deviations are frequent, often rather sub stantial, and difficult to quantitate. If, e.g., extraction and derlvatizatlorr are involved, rela tive standard deviations are closer to 20 % and the true value within 40 % of the result given. Hence the value is likely to be somewhere between 6 and 14. Systematic deviations (such as matrix effects) can cause a deviation of 60 %. Hence, if the analyst had to guarantee the result by staking his personal sal ary~ he would haveto indicate a value between maybe 4 and 16 and still make sure that he has enough food in the freezer to survive in case he lost his salary. This staggering uncertainty has nothing to do with poorly performed work, such as miscalculation, inac curate weighing, or spilling sample liquid on the lab bench. The major part of the deviations has to do with, e.g., uncontrolled processes during injection. The accuracy of the results could often be substan tially enhanced. This would presuppose perfecting techniques (such as spHtless injection) and methods (e.g. by introduction of verification procedures), but presently nobody seems to be willing to fund such an investigation. Working hard on the accuracy of their results, many' analysts overestimate their achievement and deliver results like 10.2 when, in reality, it would be more appropriate to state" a value between Sand 12", l.e. 10±2.
Splitless injection cannot be classified as accurate, reliable. and well developed, but is applied still far more widely than alternative techniques. This vote from the users either flat ters splitless injection or confirms that chromatographers are conservative. An absolute judgment is rather useless: splitless injection must evaluated in comparison with the alternatives. In real ity it has to compete mainly with cold on-column and PTV injection. On-column injection is the method of choice whenever its application is possible. With no other technique are the re sults more reliable; there is no discrimination or other devia
396
0 9. General Evaluation of Split/ess Injection
tion affecting sample introduction apart from adsorptive ef fects, and the danger of systematic errors is small. Its applica tion is simple, as there are few working rules to be followed. Larger Sample Volumes
On-column injection is also more flexible with regard to sam ple volume: from 0.2 to 500 III can be injected without loss of volatile components. In fact, the limitation of the sam ple volume in splitless injection to a few microliters is a draw back which is much more severe than commonly recognized, because most analysts are used to it and methods are de signed accordingly.
Only for rather Clean Sam ples
Considering these overwhelming advantages, it was believed that splitless injection would soon be replaced. There remain, however, important applications where on-column injection cannot compete. On-column injection is primarily hampered by the fact that involatile sample material is deposited in the oven-thermostatted column inlet and can severely dis turb chromatography. Even if an uncoated precolumn is used, peaks are broadened and tail as soon as the accumulated amount of involatile material exceeds ca. 10 Ilg [125]. i.e. after a few injections of samples containing 0.1 % of in volatile material.
9.2.2. Splitless Injection for Analysis of "Dirty" Samples
The major field of application of splitless injection is trace analysis of "dirty" samples, e.g. many biological materials, foods, and environmental samples. Splitless injection toler ates far larger amounts of involatile material than on-col umn injection, because most of it is deposited inside the in jector. Usually many injections of solutions containing as much as 10 % non-evaporating material can be per formed before the liner needs cleaning or replacement and a contaminated section ofthe column inlet must be removed. Colored and even rather viscous samples can be injected. Although often chromatograms with at least reasonably shaped peaks are obtained, the analyst should not forget that involatile material can seriously affect quantitation (matrix effects). Fortunately, for many typical applications involving samples loaded with by-products, such as pesticide residue analysis or the determination of veterinary drugs in meat or urine, accuracy is not of primary importance. Sampling (e.g. selec tion of the apple being analyzed for pesticides) usually intro duces the predominant uncertainty.
Minimizing Sample Clean-Up
The often-heard statement that only clean samples should be analyzed is unrealistic. For many samples, clean-up suffi cient for on-column injection requires excessive effort. Clean up is, moreover, a permanent source of uncertainty, e.g. from varying recoveries and blanks. It is, therefore, certainly worth while devoting some effort to the analysis of contaminated samples (such as checking for matrix effects) to save the far larger amount of work needed for sample clean-up.
-9.2. Comparison with Alternative Techniques
397
9.2.3. PTV Splitless Injection
Programmed Temperature Vaporizing (PTV) injection in the
splitless or solvent split mode is another serious competitor
against classical splitless injection. In terms of accuracy and
simplicity it cannot compete with on-column injection, i.e. it
is not the first choice for the analysis of clean samples, but
has important advantages which make it a tough competi
tor against classical splitless injection in the field of
the matrix-loaded samples.
Vaporization Process
Because the sample is introduced into a cool injector, PTV
injection rules out problems arising from evaporation of the
sample in the syringe needle. Sample evaporation occurs
from a surface (liner wall or packing material), which keeps
the process under control and ensures that only vapor
reaches the column, ruling out contamination ofthe column
inlet with involatile material. So far it resembles splitless in
jection under conditions of band formation.
For the analysis of high-boiling, adsorptive, and labile com
ponents, PTV injection does not always produce superior
results. This reflects the difficulty of vaporizing these solutes
from active, possibly contaminated surfaces. Nebulization in
a hot chamber and evaporation in the gas phase. as com
monlyachieved in classical splitless injection by the hot nee
dle technique, is unsurpassed in this respect.
Matrix Effects
Enhancing matrix effects may be strong also in PTV injec
tion (they have the same source as in classical splittles in
jection). Reducing matrix effects, however. were found to be
strongly reduced [1261. probably because of the well con
trolled deposition of the sample liquid in the vaporizing cham
ber.
Sample Volume
PTV splitless injection is possible for sample volumes up
to 20 JlL without loss of volatile components. which is an
important advantage in trace analysis. It is difficult to under
stand why this has not developed into an important com
petitive advantage. In solvent split mode, the sample vol
ume can be further increased by a factor of ten. One factor
limiting these techniques is again the lack of inert packing
materials for the liner.
9.2.4. Outlook
In the nineteen eighties it seemed obvious that a technique
as unreliable and difficult to control as splitless injection
would soon be replaced by better technology. This did not
happen and is why efforts to improve classical splitless
injection should be continued.
Connected with the improvement of splitless injection, there
should also be standardization on a single principle (neb
ulization or band formation, with all the consequences in
volved), such that methods can be perfected also in this prob
ably most sensitive step of the analysis.
398
0 References
References D
2 3 4 5 6
7 8 9 10
11
12
13 14 15
16
17 18 19
20
Kurt Grob and Gertrud Grob, "Splitless Injection on Capillary Columns, Part I, The Basic Technique; Steroid Analysis as an Example", J. Chromatogr. Sci. 7 (1969) 584, and "Part II, Conditions and Limits, Practical Realization", J. Chromatogr. Sci. 7 (1969) 587. Kurt Grob and Konrad Grob, "Isothermal Analysis on Capillary Columns without Stream Splitting; the Role ofthe Solvent", J. Chromatogr. 94 (1974) 53. K. Grob, "Solvent Effects in Capillary GC", J. Chromatogr. 279 (1983) 225. K. Grob, "On-Column Injection in Capillary GC", Hlithig, Heidelberg (1987) 270 and 302. K.Grob and A Artho, "Distorted Solvent Peaks in Capillary GC: A Symptom of Porous Column Surfaces", J. High Resol. Chromatogr. 13 (1990) 803. Kurt Grob and G. Grob, "Techniques of Capillary GC. Possibilities of the Full Utilization of High-Performance Columns. Part I: Direct Sample Injection", Chromatographia 5 (1972)
3. J. V. Hinshaw, "The Effects of Inlet Liner Configuration and Septum Purge Flow Rate on Discrimination in Splitless Injection", J. High Resol. Chromatogr. 16 (1993) 247. R.D. De Veaux and M. Szelewski, "Optimizing Automatic Splitless Injection Parameters for GC Environmental Analysis", J. Chromatogr. Sci. 27 (1989) 513. K. Grob, M. Biedermann, and Z. Li, "Checking the Capacity of a Splitless Injector - a Simple Test", J. Chromatogr. 448 (1988) 387. K. Grob and M. Biedermann, "Injector Chambers for Classical GC Splitless Injection Must be Large!", J. High Resol. Chromatogr. 12 (1989) 89. R.P. Snell, J. W. Danielson, and G.S. Oxborrow, "Parameters Affecting the Quantitative Performance of Cold On-Column and Splitless Injection Systems Used in Capillary GC", J. Chromatogr. Sci. 25 (1987) 225. H.B. Lee, R. Szawiola, and R.S.Y. Chau, "Solvent Effects on Response Factors for Polynu clear Aromatic Hydrocarbons Determined by Capillary GC Using Splitless Injection", J. Assoc. Off. Anal. Chern. 70 (1987) 929. K. Grob, "Solvent Effects on Response Factors - Problems in Performing Splitless Injec tion", Letter to the Editor, J. Assoc. Off. Ana1. Chern. 71 (1988) 76A. C.-G. Hammar, "New Injector Design for Splitless Capillary Column GC", J. Chromatogr. 249 (1982) 167. A Kaufmann, "Prevention of Vapor Overflow in Splitless Injection by a Novel Injector Design", J. High Resol. Chromatogr. 21 (1998) 258. Ph.L. Wylie R.J. Phillips, K.J. Klein, M.O. Thompson, and B.W. Hermann, "Improving Splitless Injection with Electronic Pressure Programming", J. High Resol. Chromatogr. 14 (1991) 649. K. Groband K. Grob, "Splitless Injection and the Solvent Effect", J. High Resol. Chromatogr. Chromatogr. Commun. 1 (1978) 57. F.J. Yang, AG. Brown, /II, and S.P. Cram, "Splitless Sampling for Capillary-Column GC", J. Chromatogr. 158 (1978) 91. K. Grob, S. Brem, and D. Frohlich, "Splitless Injection of up to Hundreds of Microliters of Liquid Samples in Capillary GC: Part 1, Concept", J. High Resol. Chromatogr. 15 (1992) 659. K. Grob and S. Brem, "Splitless Injection of up to Hundreds of Microliters of Liquid Sam ples in Capillary GC: Part 2, Experimental Results", J. High Resol. Chrornatoqr, 15 (1992) 715.
D References 21 22
23 24
25
26
27
28
29
30 31
32 33 34
35 36
37
38 39
40
41
399
K. Grob and D. Frohlich, "Splltless Injection of Large Volumes of Aqueous Samples - A Basic Feasibility Study", J. High Resol. Chromatogr. 16 (1993) 224. K. Grob and D. Frohlich, "Splitless Injection of Large Volumes: Improved Carrier Gas Regulation System", J. High Resol. Chromatogr. 15 (1992) 812. K. Grob and Ch. Siegrist, "Determination of Mineral Oil on Jute Bags by 20-50 JlI Splitless Injection onto a 3 m Capillary Column", J. High Resol. Chromatogr. 17 (1994) 674. T. Suzuki, K. Yaguchi, K. Ohnishi, and T. Yamagishi, uGC Detection of Tris(2-chloroethyl) and Tris(2-butoxyethyl)phosphate in Groundwater by Large Volume Injection", J. AOAC Int. 77 (1994) 1647. Th. Noy, E. Weiss, T. Herps, H. Van Cruchten, and J. Rijks, "On-Line Combination of LC and Capillary GC. Preconcentration and Analysis of Organic Compounds in Aqueous Sam pies", J. High Resol. Chromatogr. Chromatogr. Commun. 11 (1988) 181 K. Grob and E. Muller, "Co-Solvent Effects for Preventing Broadening or Loss of Early Eluted Peaks when Using Concurrent Solvent Evaporation in Capillary GC. Part 1: Con cept of the Technique", J. High Resol. Chromatogr. Chromatogr. Commun. 11 (1988) 388. T. Suzuki, K. Yaguchi, K. Ohnishi, and T. Yamagishi, "Determination of Pesticides in Water by Capillary GC with Splitless Injection of Large Sample Volumes", J. Chromatogr. A 662 (1994) 139. U. Boderius, K. Grob, and M. Biedermann, "High Temperature Vaporizing Chambers for Large Volume GC Injections and On-Line LC-GC", J. High Resol. Chromatogr. 18 (1995) 573 . K. Grob and M. Biedermann, "Vaporising Systems for Large Volume Injection or On-Line Transfer into GC: Classification, Critical Remarks, and Suggestions (Review)", J. Chroma togr. 750 (1996) 11. K. Grob and A. Romann, "Sample Transfer in Splitless Injections in Capillary GC", J. Chromatogr. 214 (1981) 118. Ph.L. Wylie R.J. Phillips, K.J. Klein, M.a. Thompson, and B.W Hermann, "Using Elec tronic Pressure Programming to Reduce the Decomposition of Labile Compounds Dur ing Splitless Injection", J. High Resol. Chromatogr. 15 (1992) 763. P.L. Wylie and K. Uchiyama, "Improved GC Analysis of Organophosphorus Pesticides with Pulsed Splitless Injection", J. Assoc. Off. Anal. Chem. 79 (1996) 571. M. Vincenti, C. Minero, and M. Sega, "Optimized Splitless Injection of Hydroxylated PCBs by Pressure Pulse Programming", J. High Resol. Chromatogr. 18 (1995) 490. S. Klick, "Evaluation of Different Injection Techniques in the GC Determination of Ther molabile Trace Impurities in a Drug Substance", J. Chromatogr. A 689 (1995) 69. K. Grob, A. Artho, Ch. Frauenfelder, and I. Roth, "Charcoal Open Tubular Traps for the Analysis of Air and Headspace Samples", J. High Resol. Chromatogr. 13 (1990) 257. P. Van Ysacker, H.M. Snijders, H.-G. Janssen, and C.A. Cramers, "The Use of Non-Split ting Injection Techniques for Trace Analysis in Narrow Bore Capillary GC", J. High Resol. Chromatogr. 21 (1998) 491. J.D. Kokenovlch, T.F. Simonick, and V.W Watts, "High Speed Analysis of Underivatized Drugs by GC/MS", in: P. Sandra (Ed.}, Proc. 9th Int. Symp. on Capillary Chromatography, Monterey 1988, HGthig, Heidelberg (1988) 550. J.J. Langenfeld, S.B. Hawthorne, and D.J. Miller, "Optimizing Split/Splitless Injection Port Parameters for SPME", J. Chromatogr. 740 (1996) 139. N.H. Snow and P. Okeyo, "Initial Band Width Resulting from Splitless and SPME-GC In jections", Proc. 18th Int. Symp. Capillary Chromatography, Riva del Garda, 1996, P. Sandra and G. Devos (Eds.), HGthig, Heidelberg, 1996, 709. A. Kaufmann, "Maximum Transfer Conditions for Splitless Injection", J. High Resol. Chromatogr. 20 (1997) 193. D.R. Erney, A.M. Gillespie, D.M. Gilvydis, and C.F. Poole, "Explanation of the Matrix-In duced Chromatographic Response Enhancement of Organophosphorus Pesticides dur
400
42
43
44
45
46 47 48 49
50 51 52 53
54 55 56
57 58 59
60
61
62 63 64
0 References ing Open Tubular Column GC with Splitless or Hot On-Column Injection and FPD", J. Chromatogr. 638 (1993) 57. H.-M. MOiler and H.-J. Stan, "Pesticide Residue Analysis in Food with CGC - Study of the Long-Term Stability by the Use of Different Injection Techniques", J. High Resol. Chromatogr. 13 (1990) 697. O.R. Erney and C.F. Poole, "A Study of Single Compound Additives to Minimize the Ma trix Induced Chromatographic Response Enhancement Observed in the GC of Pesticide Residues", J. High Resol. Chromatogr. 16 (1993) 501. J. Hajslova, K. Holsdove, V. Kocourek, J. Poustks, M Godule, P. Cuhrs, and M. Kempny, "Matrix-induced effects: a critical point in the GC analysis of pesticide residues", J. Chromatogr. 800 (1998) 283. J.L. Bernal, MJ. del Nozal, J.J. Jimenez, and J.M. Rivera, "Matrix Effect in the Determi nation of Acaricides and Fungicides in Must by GC with ECD and NPD", J. Chromatogr. 778 (1997) 111. DB. Erneyand T.M Pawlowski, "Matrix-Induced Peak Enhancement of Pesticides in GC: Is There a Solution?", J. High Resol. Chromatogr. 20 (1997) 375. K. Grab, and M Bossart, "Effect of Dirt on Ouantitative Analysis by Capillary GC with Splitless Injection", J. Chromatogr. 294 (1984) 65. A. Shatkay and S. Flavian, "Unrecognized Systematic Errors in Quantitative Analysis by GLC", Anal. Chern. 49 (1977) 2222. A. Shatkay, "Effect of Concentration on the Internal Standards Method in GLC", Anal. Chern. 50 (1978) 1423. K. Grob and H.P. Neukam, "Glass Wool in the Injector Insert for Quantitative Analysis in Splitless Injection", Chromatographia 18 (1984) 517. K. Grab, "Band Broadening Effects and Reconcentration Techniques Related to Injection on to Capillary GC Columns", Anal. Proc. (London) 19 (1982) 293. K. Grab, "On-Column Injection in Capillary GC", Huthiq, Heidelberg (1986,1991) 110. K. Grab and K. Grob, "Are we Using the Full Range of Film Thickness in Capillary GLC?", Chromatographia 10 (1977) 250. K. Grab, G. Grob, and Kurt Grab, "Comprehensive, Standardized Quality test for Glass Capillary Columns", J. Chromatogr. 156 (1978) 1. K.O. Bartle, in "GC, A Practical Approach", P.J. Baugh (Ed.), IRL Press, Oxford (1993) 10. J.C. Sternberg, "Extra Column Contributions to Chromatographic Band Broadening", in: J.C. Giddings and R.A. Keller (Eds), Advances in Chromatography, Vol. 2, Marcel Dekker, New York (1966) 205. M Oehme, "Hochaufl6sende Gaschromatographie", Huthlq, Heidelberg (1986). K. Grab, "Partial Solvent Trapping in Capillary GC. Description of a Solvent Effect", J. Chromatogr. 251 (1982) 235. K. Grob, "Solvent Trapping in Capillary GC. Two Step Chromatography", J. Chromatogr. 253 (1982) 17. V. Pretorius, C.S.G. Philips, and W Bertsch, "Solute Focusing in GLC, Using the Solvent Effect: A General Description", J. High Resol. Chromatogr. Chromatogr. Commun. 6 (1983) 232. K. Grab and B. Schilling, "Observation of a Peak under the Action of "Phase Soaking", a GC Solvent Effect. during Passage through a Capillary Column", J. Chromatogr. 259 (1983) 37. K. Grob, "On-Column Injection in Capillary GC", Huthiq (1987, 1991) 245. K. Grab, "Peak Broadening or Splitting Caused by Solvent Flooding after Splitless or On Column Injection in Capillary GC", J. Chromatogr. 219 (1981) 13. K. Grob, "Band Broadening in Space in Splitless Injection", J. Chromatogr. 324 (1985) 251.
D References
401
65 K. Grob, H.P. Neukam, and M.-L. Riekkols, "Length of the Flooded Zone in the Column Inlet and Evaluation of Different Retention Gaps for Capillary GC", J. High Resol. Chromatogr. Chromatogr. Commun. 7 (1984) 319. 66 K. Grob, "On-Column Injection in Capillary GC", Hlithig, Heidelberg, (1987,1991) 118. 67 WL. Saxton, "Chromatographic Terminal Band Lengths", J. High Resol. Chromatogr. Chromatogr. Commun. 7 (1984) 117. 68 K. Grob and Z. Li, "Introduction of Water and Water-Containing Solvent Mixtures in Cap illary GC. I. Failure to Produce Water-Wettable Precolumns (Retention Gaps)", J. Chromatogr. 473 (1989) 381. 69 K. Grob and Z. Li, "Introduction of Water and Water-Containing Solvent Mixtures in Cap illary GC. II. Wettability of Precolumns by Mixtures of Organic Solvents and Water; Reten tion Gap Techniques", J. Chromatogr. 473 (1989) 391. 70 K. Grob and Z. Li, "Introduction of Water and Water-Containing Solvent Mixtures in Cap illary GC. III. Water-Resistant Deactivation of Uncoated Precolumns7", J. Chromatogr. 473 (1989) 401. 71 A. Pouwelse, D. de Jong, and J.H.M. van den Berg, "Use of Polar Coated Retention Gap for the Introduction of Large Volumes of Polar Solvents in On-Column Capillary GC", J. High Resol. Chromatogr. Chromatogr. Commun. 11 (1988) 607. 72 K. Grob and A. Artho, "Carbowax-Deactivated GC Precolumns Capable of Resisting Wa ter?", J. High Resol. Chromatogr. 14 (1991) 212. 73 K. Grob, "On-Column Injection in Capillary GC", Hlithig, Heidelberg, (1987, 1991) 368. 74 K. Grob, "Sample Introduction in Capillary GC", Kemia-Kemi 11 (1984) 732. 75 K. Grob, "On-Column Injection in Capillary GC", Hlithig, Heidelberg, (1987, 1991) 403. 76 R.F. Arrendale, J. T. Stewart, and R.M. Martin, "Effects of the Pre-Column in Automated On-Column Injection Capillary GC", J. Chromatogr. 518 (1990) 307. 77 G. R. van der Hoff, P. van Zoonen, and K. Grob, "Deactivation of Precolumns for Capillary GC by Thin Layer of OV-1701", J. High Resol. Chromatogr. 17 (1994) 37. 78 C.L. Wooley, K.E. Markides, M.L. Lee, and K. D. Bartle, "Deactivation of Small Diameter Fused Silica Capillary Columns with Organosilicon Hydrides", J. High Resol. Chromatogr. Chromatogr. Commun. 9 (1986) 506. 79 M. Hetem, G. Rutten, B. Vermeer, J. Rijks, L. van de Ven, J. de Haan, and C.A. Cramers, "Deactivation with Polymethylhydrosiloxane. A Comparative Study with Capillary GC and Solid State 29Si Nuclear Magnetic Resonance Spectroscopy", J. Chromatogr. 477 (1989) 3. 80 K. Grob, "On-Column Injection in Capillary GC", Hlithig, Heidelberg (1987,1991) 159. 81 K. Grob, "A Current, Easily Reparable Form of Damage to GC Capillaries", J. High Resol. Chromatogr. Chromatogr. Commun. 1 (1978) 307. 82 K. Grob and B. Schilling, "Uncoated Capillary Column Inlets (Retention Gaps) in GC", J. Chromatogr. 391 (1987) 3. 83 R.F. Arrendale, J. T. Stewart, ME Mispagel, and B. Vitavirasuk, Comparison of Cold On Column and Splitless Injection Using an Automatic Liquid Sampler: Application to the Determination of GX-071 in Animal Ration", J. High Resol. Chromatogr. 12 (1989) 749. 84 K. Grob, "On-Column Injection in Capillary GC", Hlithig, Heidelberg (1987, 1991) 441. 85 E.R. Rohwer, V. Pretorius, and V. Pretorius, "Simple Press-Fit Connections for Flexible Fused Silica Tubing in GLC", J. High Resol. Chromatogr. Chromatogr. Commun. 9 (1986) 295. 86 J. Roeraade, "Cutting of Glass and Fused Silica Capillaries", J. High Resol. Chromatogr. Chromatogr. Commun. 6 (1983) 140. 87 K. Grob, M. Biedermann, K. Bernath, H.-P. Neukam, and M. Galli, "Call for Fused Silica Tubing Furnishing light Press-Fit Connections", J. High Resol. Chromatogr. 15 (1992) 613.
402 88
D References
C. Wesen and H. Mu, "Re-Use of Press-Fit Connectors and Splitters for GC Capillary Col umns", J. High Resol. Chromatogr. 15 (1992) 136. 89 M. Vecchi and W. Walther, "Simple and Versatile Method for Connecting Fused Silica and Glass Capillaries", J. High Resol. Chromatogr. Chromatogr. Commun. 11 (1988) 337. 90 A. Bemgard and C. Ostman, "High Temperature and High Pressure Stable Gluing of Press Fit Connectors for Fused Silica and Metal Capillary Tubing", J. High Resol. Chromatogr. 15 (1992) 131. 91 J. Clark and B.A. Jones, "Fused Quartz Couplings for Capillary Columns and Restrictors in SFC", J. High Resol. Chromatogr. 15 (1992) 341. 92 K. Grab, K. Grab, and G. Grab, "Organic Substances in Potable Water and in Its Precur sor. III, The Closed Loop Stripping Procedure Compared with the Rapid Liquid Extrac tion", J. Chromatogr. 106 (1975) 299. 93 K. Grab, "Broadening of Peaks Eluted Before the Solvent in Capillary GC. Part 1: The Role of Solvent Trapping", Chromatographia 17 (1983) 357. 94 K. Grab and B. Schilling, "Broadening of Peaks Eluted Before the Solvent in Capillary GC. Part 2: The Role of Phase Soaking", Chromatographia 17 (1983) 361. 95 Kurt Grob, "The Glass Capillary Column in GC.A Tool and a Technique", Chromatographia 8 (1975) 423. 96 H. Br6tell, N.-D. Ahnfelt, H. Ehrson, and S.Eksborg, "ECD GC with Splitless Injection on Isothermally Operated Wide Bore Glass Capillary Columns", J. Chromatogr. 176 (1979) 19. 97 P.H. Silvis, "Optimizing Injection into 0.53 mm i.d. Capillary Columns", LC-GC Int. 2 Nr. 9 (1989) 19. 98 M.F. Mehran, "Large Diameter Open Tubular Columns in GC Analysis", J. High Reso!. Chromatogr. Chromatogr. Commun. 9 (1986) 272. 99 H. Kern and B. Brander, "Precision of an Automated All-Glass Capillary GC System with an ECDfor Trace Analysis of Estrogens", J. High Resol. Chromatogr. Chromatogr. Commun. 2 (1979) 312. 100 W Jennings and M.F. Mehran, "Sample Introduction in GC",J. Chromatogr. Sci. 24 (1986) 34. 101 J.v. Hinshaw, Jr; "Modern Inlets for Capillary GC", J. Chromatogr. Sci. 25 (1987) 49. 102 C. Watanabe and K. Hashimoto, "Direct Injection of Large Sample Volumes into Capillary Columns with Packed Column Injector", J. High Resol. Chromatogr. 13 (1990) 610. 103 K. Grab and B. Schilling, "The Length of the Zone Flooded by the Injection of Large Volumes onto Retention Gaps in Capillary GC", J. High Resol. Chromatogr. Chromatogr. Commun. 7 (1984) 531. 104 A. Kaufmann, "Large Volume, Low Discrimination GC Injection into a Modified Splitless Injector", Chromatographia 46 (1997) 275. 105 E.C. Shagena and J. V. Hinshaw, "Quantitation on Wide-Bore, Open-Tubular GC Columns", in: P. Sandra (Ed.), 9th Int. Symp. Capillary Chromatography, Monterey 88, Hlithig, Heidelberg (1988) 182. 106 C. Mallet and V.N. Mallet, "Conversion of a Conventional Packed-Column GC to Accom modate Megabore Columns. 1. Evaluation of the System for Organophosphorus Pesti cides", J. Chromatogr. 481 (1989) 27. 107 P.M.J. van der Berg and Th. Cox, Chromatographia 5 (1972) 301. 108 J.M. Bayona, X. Aparicio, and J. Albaiges, "A Comparison of Vaporizing Injectors for Trace Analysis in Capillary GC", J. High Resol. Chromatogr. Chromatogr. Commun. 9 (1986) 59. 109 H. Jing and A. Amirav, "Pesticide Analysis with the Pulsed-Flame Photometer Detector and a Direct Sample Introduction Device", Anal. Chem. 69 (1997) 1426. 110 S.B. Wainhaus, N. Tzanani, S. Dagan, M.L. Miller, and A. Amirav, "Fast Analysis of Drugs in a Single Hair", J. Am. Soc. Mass Spectrom. 9 (1998),1311.
D References
403
111 G. Morchio, "Rapida determinazione GC dell'esano residuo negli oli di sansa grezzi, di sansa e di oliva rettificati", Riv. Ital. Sostanze Grasse 59 (1982) 335. 112 K. Grob, M. Biedermann, and A. M. Giuffre, "Determination of Organophosphorus Insec ticides in Edible Oils and Fats by Splitless Injection of the Oil into GC (Injector-Internal Headspace Analysis)", Z. Lebensm. Unters. Forsch. 198 (1994) 325. 113 C. Mariani and E. Fedeli, "Determinazione gascromatografica di BHA, BHT e Jonox 100", Riv. Ital. Sostanze Grasse 60 (1983) 667. 114 C. Mariani, S. Venturini, and E. Fedeli, "Sulla presenza di prodotti alogenati volatili negli oli vergini di oliva", Riv. Ital. Sostanze Grasse 67 (1990) 239. 115 G. Morchio, R. De Andreis, and G.R. Verga, "Indagine sui contenuto di composti fosforganici presenti negli oli vegetali e in particulare nell'olio di oliva", Riv.ltal. Sostanze Grasse 69 (1992) 147. 116 Ch. Droz, Official Food Control Authority of the Canton of St. Gallen, Switzerland, unpub lished results, 1998. 117 Ch. Watanabe, H. Tomita, K. Seto, Y. Maseda, and K. Hashimoto, "Accuracy and Repro ducibility in Splitless, and Packed and Open Tubular CoolOn-Column Injections", J. High Resol. Chromatogr. Chromatogr. Commun. 5 (1982) 630. 118 D.L. Springer, D.W Phelps, and RE Schirmer, "Obtaining Ouantitative Data for PNA's with Capillary Column GC, Using Split and Splitless Injection", J. High Resol. Chromatogr. Chromatogr. Commun. 4 (1981) 638. 119 D.H. McMahon, "A Collaborative Study to Evaluate Ouantitation Utilizing Different Injec tion Modes for Capillary GC", J. Chromatogr. Sci. 23 (1985) 137. 120 G. Schomburg, H. Husmann, and R. Rittmann, "Direct' (On-Column) Sampling into Glass Capillary Columns. Comparative Investigations on Split, Splitless and On-Column Sam pling", J. Chromatogr. 204 (1981) 85. 121 D. Kalman, "Optimized Injection for Determination of Free Phenols by GC Using Fused Silica Columns", J. High Resol. Chromatogr. Chromatogr. Commun. 6 (1983) 564. 122 F.I. Onuske, R.J. Kominar, and K. Terry, "An Evaluation of Splitless and On-Column Injec tion Techniques for the Determination of Priority Micropollutants", J. Chromatogr. Sci. 21 (1983) 512. 123 L.L. Plotczyk, "Application of Fused-Silica Capillary GC to the Analysis of Underivatized Drugs", J. Chromatogr. 240 (1982) 349. 124 H.-J. Stan and H. Goebel, "Evaluation of Automated Splitless and Manual On-Column Injection Techniques Using Capillary GC for Pesticide Residue Analysis", J. Chromatogr. 314 (1984) 413. 125 K. Grob, "Effect of Dirt Injected On-Column in Capillary GC; Analysis of the Sterol Frac tion of Oils as an Example", J. Chromatogr. 287 (1984) 1. 126 K. Grob, T. Liiubli, and B. Brechbiihler, "Splitless Injection - Development and State of the Art, Including a Comparison of Matrix ("Dirt") Effects in Conventional and PTVSplitless Injection", J. High Resol. Chromatogr. Chromatogr. Commun. 11 (1988) 462.
E Injector Design
405
E Injector Design
This section summarizes important aspects of the design of the vaporizing chamber and the surrounding system. It ad dresses: 1 users who want to know more about the background of injector design; 2 analysts thinking of buying a new instrument. When in struments are compared, the vaporizing injector should certainly be one of the first components to be evalu ated; and 3 people developing methods and instrumentation. The discussion is restricted to subjects of general interest. For manufacturer-specific aspects the reader is referred to the manuals. Same Injector for Split and Splitless Injection
Although the requirements are quite different, split and splitless injection have always been performed with the same injector. This is worthy of discussion, because many instruments are used either for split or for splitless injection almost ex clusively. Maybe specific injectors could be improved. On the other hand, there is a fairly continuous transition between the techniques: split injection at low split flow rates ap proaches splitless injection with regard to deposition of the sample and intermediate storage of sample vapor. As split injection is older, it was splitless injection that called for the modifications and compromises. It did this with lim ited success. Even today (2000), injectors with vaporizing chambers which are too small (2 mm i.d. liners) are mar keted, because the requirement that the sample vapor must be stored before it is transferred into the column has been ignored for far too long.
406
E 1. Vaporizing Chamber
1. Vaporizing Chamber The vaporizing chamber serves several purposes: 1 vaporization of the sample liquid, which can include stopping and holding of sample liquid injected as a band (Part B); 2 housing of the vapor up to its discharge into the col umn or through the split outlet; 3 mixing of the sample vapor with the carrier gas such that it is homogeneously distributed across the cham ber when it arrives at the split point; and 4 retention of non-evaporating sample by-products to pro tect the column from contamination.
1.1. Classical Teaching
Presently (year 2000) marketed injectors basically follow the concept laid down by Kurt Grab in 1978 [1]. The split injector of that time was modified to accomodate splitless injection according to the belief that a splitless injector per forms for split injection at least reasonably, but not neces sarily vice versa.
Housing the Sample Vapor
In split injection, the sample vapor is introduced into a gas stream (primarily split flow). Basically an unlimited amount can be injected and there are no limits to the capacity of the injector. When the rate of vapor formation substantially exceeds that of the discharge, however, the vapor must be stored
Gas is driven backwards into t supply line
4~====lt= Split outlet Column entrance
Gas cannot escape and prevents vapor reaching the bottom
Figure E1 Classical concept of the filling of the vapqrizing chamber by sample vapor.
-1.1. Classical Teaching
407
until it can be moved onwards in split or splitless mode. This is critical because the 1-2 III of liquid commonly injected produces a volume of vapor approaching (sometimes exceed ing) the volume available in modern vaporizing chambers. 1. 1. 1. Longitudinal Axis
At the beginning of sample evaporation, the chamber is filled with carrier gas. The sample vapor must displace the gas to liberate the room it needs for its expansion.
Filling from the Bottom
According to classical teaching, the vaporizing chamber is filled from the bottom towards the top (Figure E1). The center of sample evaporation is positioned slightly above the column entrance. The expanding vapor dis places the carrier gas backwards into a large volume in the gas supply system, compressing the gas. A cushion of gas prevents vapor from reaching the bottom of the chamber, which presupposes that the vapor does not expand into the split outlet line.
Center of Evaporation
From routine analysis with manual hot needle splitless in jection (thermospray) it was known that involatile sample material was transferred to the liner wall forming a ring ex tending from ca. 5 mm above (behind) the needle exit to ca. 15 mm below. This indicated that the center of evaporation was located 5-10 mm below the needle exit. Today we know that this is correct provided the sample liquid is nebulized at the needle exit. In fact, for solutions in volatile solvents thermospray was normal before the fast auto sampler was introduced.
Length of Syringe Needle
This concept determined the longitudinal axis of the injec tor. The syringe needle should release the sample 15-20 mm above the column entrance such that the vapor remains above the column entrance even when it expands somewhat further down. If the maximum convenient length of the sy ringe needle is 71 mm (3 inch), the column entrance should be positioned 85-90 mm below the septum (Figure E2).
Position of the Column Entrance
Recommendations on the column position were based on
two factors.
1 The column entrance should be clearly above the bot
tom of the vaporizing chamber because septum parti cles and other materials are accumulated there (empty liner) and should be out of the way of the sample va pors. 2 For splitless injection and split injection at low split flow rates, the volume below the column entrance should be small since sample material driven there will hardly return to the column entrance: there is no gas flow to bring it upwards to the column entrance. It was concluded that the column should enter the vaporiz ing chamber by about 5 mm.
408
E 1. Vaporizing Chamber
Septum purge
Carrier gas supply ====:r~
liner, e.g. 80 x 4 mm i.d.
5mm :m#~==
Split outlet
Column
Figure E2 Geometry of the splitless injector commercialized by Carlo Erba in 1976.
Septum Purge Zone
The length of the injector head, including the septum and the septum purge zone, should be minimal because any space they occupy is at the expense of the useful length of the va porizing chamber. If the injector head is 10 mm long, the vaporizing chamber can be ca. 80 mm long.
Advantage of Longer Cham bers
Split injectors designed before the introduction of splitless injection were usually longer to provide more distance for vaporization and homogenization of the vapor. As men tioned several times in this book, however, there are no data substantiating the view that such elongation noticeably im proves the results.
1. 1.2. Internal Diameter for Split/ess Injection
The optimum internal diameter of the vaporizing chamber depends on whether or not vapor must be stored. If 2 IJ.L of sample solution is evaporated in 0.5 s, vapor volumes be tween some 0.2 mL (e.g. hexane, 150 kPa inlet pressure) and 1.5 mL (methanol, low pressure) are generated at a rate of 24-180 mLJmin. Intermediate storage is required if split flow rates are substantially lower.
Intermediate Storage of Vapor
It would be desirable to have the capacity to house the vapor from at least 2 III of sample (including the volume from the needle when performing thermospray injection). As shown in Section 03, with a 4 mm i.d. chamber of 1 mL internal volume, losses from 2 IJ.L injections of a solution in hexane were significant, but probably tolerable. For a 2 IJ.L injection of dichloromethane or methanol, the chamber is usually far too small, wich is an unsatisfactory situation.
-1.1. Classical Teaching
409
Maximum Internal Diameter
The arguments against wider liners were: 1 The gas velocity in the liner becomes too low for sat isfactory transfer into the column. 2 The wider the liner, the more the vapor expands like a smoke trail instead of a plug. This increases dilution with carrier gas (enlarging the cloud). The extra volume is poorly used. For this reason, elongation increases stor age capacity more effectively than does widening. Introduction of flow or pressure programming, which enable increase of the flow rate for the transfer and pressure to com press the vapor cloud, improved somewhat on this.
Liners of Narrower Bore
2 mm i.d. liners are preferable when carrier gas flow rates are low, such as when narrow bore columns are used. For splitless injection, the internal volume is sufficient only if inlet pressures are high: at 200 kPa, a vapor cloud at am bient pressure comprising a volume of 0.75 ml can be stored. This is the lower limit for 2 III of hexane and still not enough for 1 III methanol.
1. 1.3. Internal Diameter for Split Injection
If the split flow rate is higher than the rate of sample evapo ration (around 50 rnt/mtn). storage of vapor is no longer necessary and other arguments become important.
Deviation of the Split Ratio
As shown in Section C8.4.1, a large vaporizing chamber is preferable, because it minimizes the pressure wave and the deviation of the true split ratio from that pre-set. Recon densation of the sample matrix (solvent) in the column inlet has, furthermore, less effect, because of stronger dilution of the vapor with carrier gas. These effects favor the use of 4 mm i.d, liners.
Homogeneity of the Vapor
On the other hand, distribution of the vapor across a na~ row bore liner (2 mm) is faster, which should improve the reproducibility of the splitting process. Use of a wider bore (4 mm) liner with obstacles could be an alternative.
Sharp Initial Bands
In fast GC, particularly when performed isothermally at or near the temperature during the injection (no cold trapping), special attention is required to obtain initial bands of suffi cient sharpness. Van Lieshout et al. (2) studied the optimum liner diameter for methane as test component. With a 5 mm i.d. liner and a split flow rate of 100 mt/rnln, the peak width at half height was a totally unacceptable 6 s, With a 1.25 mm i.d. liner, it was reduced to 0.55 s. Reduction to 0.75 mm did not further sharpen the peak, indicating that the ini tial band no longer contributed noticeably.
Undiluted Samples
Samples of intermediate to high-boiling point (undiluted or in high-boiling solvents) evaporate slowly and there is, there fore, no large vapor cloud to be stored nor a pressure wave to keep low. Transfer of the liquid to the wall of an empty liner is, furthermore, safer when the diameter is small.
410
E 1. Vaporizing Chamber
1. 1.4. Conclusions
The outer diameter of the injector liner is given by the size of the cavity in the injector body, but the internal diameter can be varied by selecting liners of different wall thickness. Lin ers of 2 and 4 mm internal diameter should be made available, and methods should specify which liner to prefer.
Liners with a Narrow Bore Bottom Section
The length of the vaporizing chamber can be varied by using liners with a restriction at the bottom for splitless injection and split injection at low split ratios. This restriction (Figure E3) reduces the effective length of the chamber to the needs of the latter injection method, whereas open tubes can be used for split injection at higher flow rates. The liner at the left is designed such that the long svrlnqe needle reaches to within 15-20 mm of the column. That at the right is suitable for injection involving split flow rates exceeding ca. 50 mLJ min.
r E E
:g
E E o
'"
1
Liner for injection at low split flow rates and splitless injection
Liner for injection at high split flow rates
Figure E3 Liners suitable for injectors longer than 80 mm. The restric tion at the bottom shortens the effective length of the va porizing chamber to the needs of splitless injection and split injection at low split flow rate (dimensions of the CE Instru ment.nbermoQuest instrument).
1.1.5. Column Installa tion
As shown in Part B, the position of the column entrance in the vaporizing chamber can severely affect the results. Because there is no stop pin aiding correct positioning of the column entrance, the analyst must insert it to the proper height by monitoring the length of the inlet introduced from the oven.
Correct Height
In a first step, the appropriate height ofthe column entrance in the injector must be determined. Figure E4 shows the two most common positions. The classical installation, intended for thermospray injection, introduces the inlet into the vaporizing cham ber by about 5 mm (see above). If the liner is packed or contains obstacles, septum material and other particles accumulate above the col
1.1. Classical Teaching
411
umn entrance and remain between the sample and the column. Even then insertion into the chamber by a few millimeters is appropriate to avoid contact of the sam ple vapor entering the column with the metallic surfaces of the injector body. With a goose neck liner, there is the dilemma of whether to keep the column entrance above the accu mulated garbage, i.e. inserting it ca. 5 mm above the constriction, or to make sure no sample vapor is formed below the column entrance, which requires location of the column entrance within the constriction, as shown in the figure.
Classical style; "Goose neck" liner,
column entrance column below
above the "garbage" bottom 01the liner
Piece 01 wire or column
Figure E4
Column positions in the vaporizing chamber and measure
ment of the length of the column inlet to be introduced"
Length of Inserted Inlet
The length of the column inlet to be inserted into the injector must be determined for each type of instrument, also taking into account the fitting of the column attachment used. Usu ally the instrument manual gives some instructions, al though not always with an indication of the position reached when the column inlet is introduced by the given length.
Measurement
The correct length of the inlet section to be introduced can be measured, preferably after cooling ofthe injector. The septum cap, the septum purge device, and the liner are re moved and a glass rod or a pencil introduced to stop a piece of fused silica capillary or wire introduced from the bottom. The ferrule and the screw of the column attachment must be installed and tightened such that they are in the same posi tion as during column installation. The point at which the capillary or wire enters the attachment is then marked. The length of the introduced piece is measured, from which the length of column inlet to be introduced is calculated.
Marking the Column Inlet
To install the column correctly, the length of the inserted in let is marked, i.e. the point which should finally be located
412
E 1. Vaporizing Chamber adjacent to the nut of the column fitting. This mark can be made with a felt-tip, but the white fluid for typewriter correc tions (such as "lipp-Ex") is more easily visible.
ASTM
Column installation is described by an ASTM Standard Practice [31 which includes subjects such as carrier gas choice, deactivation of liners, choice of ferrule, setting the flow rate, column conditioning, column testing, and use of precolumns. It does not comment on the height ofthe column entrance in the chamber, however.
1.2. Newer Develop ments
As shown above, the classical concept of injector design left little room for variation: length and internal diameter were restricted within narrow limits. For splitless injection it com pelled us to accept a compromise between storage ca pacity and transfer performance which never really sat isfied. In the meantime, the concept received two new in puts, both of which influenced the premises and would have enabled fundamental changes.
1.2.1. Pressure and Flow Programming
Electronic flow and pressure regulation introduced the pos sibility of increasing the inlet pressure/column flow rate dur ing the splitJess period. Pressure increase compresses the vapor cloud and, hence, increases the injector capacity (although not spectacularly). The increased flow rate into the column as a result of the pressure increase enables es cape from the deadlock that a reasonable injector capacity (internal liner diameter) could not be combined with a low column flow rate, as, e.g., required by mass spectrometers with weak vacuum pumps. With pressure/flow programming, the gas velocity in the vaporizing chamber can easily be increased to a level suffi cient for effective sample transfer with a liner widened to 5-6 mm i.d. Widening from 4 to 5 mm i.d, enlarges the in ternal volume by 56 %. As pressure increase further enhances the capacity, a gain of at least a factor of two is achieved.
1.2.2. Fast Autosampler
In 1985, Hewlett-Packard (Agilent) introduced the fast autosampler with the intention of suppressing sample evapo ration inside the needle. It went unnoticed for a long time that this also had a substantial effect on sample evaporation inside the injector.
Transport of Liquid
Resulting band formation fundamentally changes the above logic of injector design. It is no longer true that sample evapo ration occurs ca. 10 mm below the needle exit. As shown by the videos, solutions in volatile solvents can be shotthrough hot tubes for distances longer than 20 cm without significant evaporation and without risk of the liquid touching the liner wall. Hence it is no longer true that the length of the vaporizing chamber is restricted by the length of the syringe needle. '
1.2. Newer Developments
413
As shown in Part B, injection with band formation requires means of stopping the sample liquid above the column entrance, the choice being a plug of packing or an obstacle trapping the liquid. The position of this stopper determines the center of evaporation. It can be located far from the nee dle exit, which, basically, would have enabled the construc tion of a far longer chamber and its use with a short syringe needle as early as 1985 (Figure E5). Injection with thermospray
Center of evaporation ';;i:i! near needle exit
IIJ
Injection with band formation
Sample liquid moving as a band to the obstacle, determining the evaporation site
Packing or obstacle
Figure E5
Injection with band formation enables the construction of a
long vaporizing chamber that can be used with a short sy
ringe needle.
Neglected Opportunity
Elongation ofthe vaporizing chamber increases the capac ity for temporary storage of the vapor more efficiently than widening: there is less mixing with carrier gas and the gas velocity during the splitless period is higher. This would have been particularly important for the injectors from Hewlett Packard because their vaporizing chamber is fully open at the top (carrier gas flow redirected into the septum purge line).
1.3. Room for Improve ment?
Every few years, manufacturers present new GC instruments. A closer look reveals, however, that many of the vaporizing injectors are still the same as those produced 15-20 years ago - as if there were no room for improvement. Color, outside architecture, and user interfaces change, but not those parts which ultimately determine the quality of the re sults. A vaporizing chamber designed according to today's knowl edge would look different from what we currently see. Be low some options are discussed, starting from the require ments of splitless injection since the corresponding injec tors are also suitable for split injection.
414
E 1. Vaporizing Chamber
1.3. 1. Preference for Thermospray or Band Formation?
An update of the injector design requires a decision to be taken on whether to go for thermospray or band formation (Figure E6). It will probably be optimized for one of the two options, and not give a choice between the two. Both op tions offer important advantages.
Injection into hot vaporizing chamber
,;
'\
Cool needle Fast autosampler or short needle
Hot needle Manual injection and analogous autosamplers
Band ofJ/ liquid '" Mechanical I spray upon , deformed Band of liquid needle tip must be stopped ?
Thermospray
J/ Light packing
....... Trapping in obstacles
•+
Fine droplets slowed in gas
J/ in Vaporization gas phase
'" Transfer of particles to liner wall
Figure E6 The two strategies for injection into a hot vaporizing injec tor. (From ref. [4].1
1.3.2. Optimized Thermospray
Thermospray provides more gentle evaporation. It is less
affected by increasing injector contamination during a se
ries of analyses, but aerosol formation can cause problems.
Optimization of the injector might involve the following ele
ments:
Thermospray presupposes some evaporation inside
1 the needle. Negative side effects of this (excessively large sample volume, discrimination) can be minimized by reducing the volume of the spraying device (e.g. the needle). A narrow bore orifice barely 1 cm long is suffi cient if the heat supply is adequate. This orifice can be part of the syringe or of the injector. 2 The vaporizing chamber should be ca. 150 mm long. As the needle (sprayer) should be shorter, it can no longer be introduced from the end opposite to the column in let, but from the same side as the column, filling up the chamber from the column entrance towards the gas supply. No such injector has yet been constructed, although several
rather detailed projects have been designed by some instru
ment manufacturers. One of these designs resembles that
shown at the left in Figure E7.
1.3.3. Optimized Injec tion with Band Formation
The alternative approach involving band formation and
evaporation from a packing or a trap between obstacles could
be optimized in the following manner.
Evaporation in the needle is suppressed. Hewlett
1 Packard/Agilent did this by combining fast injection with a cool injector head, which excludes the possibility of manual injection. Alternatively the length ofthe syringe
1.3. Room for Improvement
415
Syringe
Gas supply
Gas
supply Band of liquid shot to bottom
Injector liner Expanding nebulized sample
Heating block
Heating block
Packing stopping the sample liquid
Syringe
II
II
Thermospray
Band formation
Column
Split outlet
needle is reduced to maybe 15 mrn, such that evaporaFigure E7
Possibilities of designing vaporizing injectors with larger internal volumes based on the prin
ciples of thermospray or band formation. The chamber can be as long as 20 cm. (From ref.
[4].1
2
tion in the needle is avoided even for manual injection and autosamplers working at normal speed. The injec tor head is again kept at a low temperature (Figure E7). The bottom of the liner is equipped with an obstacle stopping the liquid, a trap or a volume of well deacti vated wool which is sufficient to pick up the amount of sample liquid injected, which could be as much as 10
I!L. 3
4
The injector cavity houses liners 15-20 cm long and with internal diameters up to 5 mm. Different wall thick nesses result in internal diameters of 1.5, 2.5, 4, or 5 mm. Primarily the vapor of solvent and some highly volatile components expand towards the top of the chamber. The more difficult, high-boiling solutes remain in the region of the center of evaporation, hence close to the column entrance. This enables heating of the base of the injector only; the top must be warmed just to the temperature which ensures that the sample liquid is re pelled from the liner wall.
416
E 2. Surroundings of the Vaporizing Chamber
2. Surroundings of the Vaporizing Chamber 2.1. Seal between Liner and Injector Body?
There have been long disputes about whether or not injec tor liners should be sealed against the injector body. The two options are shown in Figure Ea. 1 In the injector on the left, the liner fits tightly into the metal body, but there is no seal. The carrier gas supply and the split outlet are far apart, strongly favoring flow through the vaporizing chamber over that around it (in struments from Carlo Erba/Fisons up to ca. 1990). 2 In the design on the right (probably all injectors mar keted today), there is a seal between the liner and the injector body. To eliminate dead volumes, the carrier gas supply is positioned just above this seal, the split outlet just below. -""=== Septum purge Carrier--,,=as~-===u outlet supply Split outlet Seal
Split outlet Column
Liner tightly fitting cavity
Column
Seal between liner and injector body
Figure E8 Injector designs without and with ferrule between the liner and the injector body.
Arguments Against a Seal
The arguments against the use of a seal are: a seal complicates replacement ofthe liner (which should be easy because frequent exchange may be necessary); there is a risk of the fitting releasing material into the incoming carrier gas, generating "ghost" peaks; If the seal is not tight, the carrier gas is likely to take the wrong route: it flows from the supply directly into the split outlet. Such leaks easily remain unnoticed.
Arguments in Favor of a Seal
The situation is different if the liner is densely packed with a long bed of packing material. A worst case scenario: at a split flow rate of 50 mLJmin, the pressure drop over a 50 x
2.1. Seal between Liner and Injector Body
417
4 mm bed consisting of a material ofthe type used in packed column GC is ofthe orderof3 kPa and increases to ca. 10 kPa for a split flow rate of 150 mljmin.
Flow Around Vaporizing Chamber
Such a pressure drop across a packing in the liner can cause most of the carrier gas to flow through the gap between the injector body and the liner (Figure E9). If the regular flow rate through the vaporizing chamber drops to almost zero, a side stream enters it from the bottom and proceeds upwards into the column entrance, i.e. largely around the sample. The split ratio is severely affected. If an injector is to be suitable for the use with a densely packed liner, the latter must be sealed against the injector body. Hardly anybody uses such packings, however.
.....
Carrier gas supply .:::....-----'IE==::;_
Gas flow around
vaporizing chamber
Densely packed vaporizing chamber hindering gas flow
Gas entering the column from bottom
•• Split flow
11~==.......-1
Column
Figure E9 Densely packed liner with no seal to the injector body. The carrier gas flows (partly) around the vaporizing chamber and, in extreme circumstances, enters the column (mostly) from the bottom.
Rinsing the Space Between Liner and Injector Body
If there is no seal, the carrier gas is supplied at the top of the chamber to provide an easy route into the liner and maxi mum resistance against flow around it. For the same rea son, the split flow leaves through the bottom. The space between the liner and injector body is left without controlled rinsing. It is accessible to vapor, the solvent vapor being of primary concern, from the top and bottom, i.e. vapor overfilling the chamber (top) and leaving towards the split outlet.
Distorted Solvent Peak
Vapor slowly leaving this space upwards into the car rier gas supply reaches the column after a delay and gen erates a distorted solvent peak. Return downwards into the bottom of the injector has no adverse effect, because the carrier gas flow purges it into the split outlet before it can diffuse upwards to reach the column (column inlet entering the vaporizing chamber).
418
E 2. Surroundings of the Vaporizing Chamber
The typical pattern of solvent peak distortion sometimes observed for injectors without a seal is shown in Figure E10. The mechanism might be that the vapor enters the space between the liner and the injector body from the bottom. Some vapor diffuses upwards and enters the carrier gas stream at the top of the liner. The gas carries it into the va porizing chamber and to the column. Because diffusion to wards the top takes some time, this vapor forms a separate peak (instead of just a tailing solvent peak).
Injection
Solvent entering the column with delay
~ Figure E10 Distortion of the solvent peak as a result of vapor returning from the space betw_n injector liner and metal body. The solvent eluted after a delay can form a separate peak (as shown), a peak fused to the main solvent peak (broadening of the solvent peak), or a flat, very broad tail.
Material Used for the Seal
The seal must be manufactured from of a material which fulfils several requirements. 1 It must not bleed, because the material released from the upper region contaminates the carrier gas flowing into the column and produces "ghost peaks". 2 It must be thermostable (without bleed) up to the in jector temperatures commonly used, i.e. 350°C. 3 It must not allow diffusion of solvent from the split outlet into the carrier gas supply through the ferrule. 4 The ferrule must not stick to surfaces inside the in jector, because it would then be difficult to remove, it. Sticking can be avoided by housing the ferrule in a metal case, exposing only those parts of the ferrule which need to form a seal.
Graphite
The material best fulfilling these requirements is graphite. It is thermostable without bleed, does not stick to surfaces, is inexpensive and can be used many times when handled with sufficient care. It is preferable to embed the graphite in a metal case to prevent breakage and deformation during tightening.
Diffusion of Solvent
Graphite forms an excellent seal against gas flow, but is a poor barrier against diffusion. When the solvent leaves
2.1. Seal between Liner and Injector Body
419
through the split outlet, some vapor penetrates the graphite. This can pass through the ferrule into the carrier gas on the other side, which brings it back to the column. A minute amount of solvent passing through the ferrule may cause tailing of the solvent peak such that the analysis of early eluted components is disturbed (depending on the detector). Release from the graphite may last more than 10 min after passage of the solvent vapor through the split outlet. Diffusion through graphite can be reduced by application of high pressure, i.e. securing the seal tightly. It does not com pletely eliminate it, however. Tailing Solvent Peak
Figure E11 shows solvent (hexane) peaks obtained by split injection (10 ml.lmin split flow rate) with loose and strongly compressed graphite ferrules. At intermediate attenuation, the FID showed tailing last ing for at least 5 min (top chromatogram). 2 For diagnostic purposes, the split flow rate was increased to 100 ml.lmin 30 s after injection and reduced again 5 s later (center). This eliminated the vapor from open vol umes. The fact that the solvent residues (tailing) returned shortly afterwards is proof of a deposit slowly releasing hexane vapor, such as an adsorbing material. 3 The ferrule was then compressed, firmly securing the screw above it. This substantially improved the shape of the solvent peak (bottom), but did not fully eliminate the problem: for several minutes the baseline remained higher than before injection. The solvent would be more disturbing with a more sensitive detector, such as MS.
Loose ferrule 10 mUmin split flow rale
"'lOUlIhout Solvent vapor
diluted in 10 times
t~8 :::::~"Q
the
ferrule centaminates
incoming carrier gas
~
Loose ferrule fOmUmin after 30 S, 100 mUm;n for 5 s then baell:to 10 mUmin
Purge at 100 mUmin
Compressed ferrule 10 mUminthroughout
Time (min)
Figure E11
Solvent (hexane) peaks with a liner sealed against the injec
tor body by means of a graphite ferrUle. "1 Ill" injection;
250°C injector temperature; 90 °C column temperature.
420
E 2. Surroundings of the Vaporizing Chamber
Viton at Moderate Tempera
tures
Modified PTFE materials, such as Viton or Kalrez, or polyim ide and polyimide/graphite (Vespel) are virtually tight against diffusion, but they are of limited thermostability (250-280 °Cl, tend to bleed, and also to stick to surfaces. Because there seems to be no generally suitable material, Viton is recommended for work at low temperatures, par ticularly when using GC-MS for the analysis of low molecu lar weight components and the ions of the solvent interfere. Graphite must be used for high injector temperatures. These are usually used for the analysis of high molecular weight material, when tailing solvent is less disturbing. Maybe the use of deactivated steel liners will increase in the future, which enables sealing with metal ferrules.
2.2. Accessible Volumes around the Vaporizing Chamber
We like to think of the injector as a closed chamber waiting to be filled with sample vapor, similar to the loop in HPLC injection valves. This is wrong: 1 the chamber is already full of carrier gas and there is no "waste" outlet to release the carrier gas as in HPLC injectors; 2 the vaporizing chamber is connected to the gas supply and two outlets with large volumes, and there is no valve to prevent the vapor from leaving the cham ber and entering these systems. Instead of expanding in the liner, the vapor might well expand into the split outlet line.
Pressure Increase
Injection into a vaporizing chamber creates a pressure in crease, because sample vapor is added to a chamber full of gas. If the vapor expands to a volume corresponding to half of that of a hypothetically closed injector, absolute pres sure increases by 50 %. If, for instance, the inlet pressure is 100 kPa (200 kPa absolute pressure), pressure should increase to 200 kPa (300 kPa absolute). The pressure increase observed on the manometer or pres sure sensor is much less because the chamber is not closed. In a system with pressure regulation and needle valve, the needle of the manometer jumps up by hardly 10 kPa. The expanding vapor drives gas and possibly vapor into the accessible volumes around the vaporizing cham ber. If the total accessible volume is 10 times larger than that of the vaporizing chamber (usually it is even more than that), pressure increases 10 times less, i.e. by 5 % or the 10 kPa observed in reality. This means that most of the extra volume added by the sample flows out of the vaporizing chamber. It is important to ensure that only carrier gas is leaving.
Boundaries of the Vaporizing Chamber
Upstream of the vaporizing chamber, the system is open up to the gas regulation device. Mechanical pressure regula tors close when the pressure at the outlet exceeds that regu lated; flow regulators continue feeding gas and prevent flow
2.2. Accessible Volumes around the Vaporizing Chamber
421
backwards. Electronic devices (proportional valves) do the same as soon as the pressure sensor has noticed the pres sure increase. Downstream, flow of gas and vapor is stopped at the closure of the split outlet. Direction of Expansion
If the resistance to flow is neglected, the flow from the va porizing chamber is directed primarily into the largest of the accessible volumes since pressure is leveled out over the whole accessible gas volume. Instrument design must con sider this and direct the expansion of the sample vapors by appropriate volumes in the gas supply and the split outlet. The center of sample evaporation must be positioned ac cordingly.
Vapor Cloud in the Center?
It seems convincing that the two volumes upstream and downstream of the vaporizing chamber (gas supply plus septum purge, split outlet) should be equal and that the sam ple should evaporate in the center of the chamber. Then the vapor expands equally in both directions. This might be so if the resistances against gas flow were really identical or negligible, but this is not realistic: the vapor would first ex pand in the direction of lower resistance, maybe leave the liner on that side, and shortly afterwards flow backwards in the other direction. In the end, the bulk of the vapor would be situated in the liner, but higher-boiling components would be lost on surfaces outside the chamber.
Classical Teaching
The classical concept defines the direction of expansion as backwards towards the gas supply system, and the center of evaporation as near the column entrance (short dis tance for high-boiling components). The carrier gas supply line was of a large bore and included a mechanical manom eter of large internal volume with a rather large T-piece (Fig ure E12).
Pressure regulator
Vapor expanding upwards
Center of sample evaporation
4...!====~1:-~P~i1 ;>:~t~~t
Column
Figure E12 Classical concept: expansion of the sample vapor towards the large volumes in the gas supply system.
422
E 2. Surroundings of the Vaporizing Chamber
Small Volume in Split Outlet
No Filters
When filling the chamber from the bottom (column entrance) upwards, flow into the split outlet must be avoided. The vol umes in the region of the column attachment and the split outlet to the closing valve must be small. In fact, the split outlet of the Carlo Erba instruments comprised 20 em x 0.5 mm i.d. tubing with an internal volume of ca. 40 ul., The volumes in the connections to the needle valve and a possible device for automatic closure were small. Nowadays volumes in the split outlet tend to be much
larger. 1
2
3
The outlet passes through the volume between the liner and the injector body up to the ferrule and the outlet line (several hundred microliter). The line tends to be long because closure occurs in a module positioned as far as possible from the hot oven (typically somewhere at the rear of the instrument), It contains a filter, a tube packed with charcoal, easily of 2 mL volume, to prevent contamination of the electric valves by material injected in split mode.
Solvent Recondensation in the Outlet
Another aspect is indirectly related to the pressure increase and may have a similar effect: if solvent vapor is adsorbed in the charcoal filter or recondensed on the walls of a cool split line, it sucks further vapor into the split outlet (as dis cussed for solvent recondensation in the column inlet). The cool parts must be far enough from the injector that they cannot be reached by the vapor.
Conclusions
1
2
3
2.2. f. Reversed Split Flow?
So far, no alternative to the classical concept has been proposed. The accessible volume in the split out let must be small to enable a well defined expansion of the sample vapor from a site close to the column inlet. Electronic regulators in the split outlet must be protected from sample material, and the filter is, therefore, an es sential part of the system. To keep the accessible vol ume small, the closing valve must be positioned near the vaporizing chamber, upstream of the filter. Deposition of the sample liquid on to a packing (injec tion with band formation) renders problems related to vapor expansion less critical. Higher-boiling solutes stay on the packing until solvent evaporation is complete and the flow of expanding vapor comes to a standstill (ef fect also used for large volume splitless injection by over flow). Volatile solutes expand and flow with the solvent vapor, however.
Kaufmann [5) proposed preventing flow of sample vapor into the split outlet by use of a gas flow backwards from the split outlet into the vaporizing chamber. Using a 2 mm i.d. liner with a constriction at the bottom, he observed that even an extremely small flow rate (0.25 mLJmin) eliminated the broad tail of the solvent peak.
2.2. Accessible Volumes around the Vaporizing Chamber
423
Purge Inwards
He installed a flow regulator delivering a small flow of car rier gas into the line between the injector and the solenoid valve of the Hewlett-Packard system. At a flow rate of 0.25 ml/min, the tail of the solvent peak was substantially reduced. Higher flow rates broadened the solvent peak because this purge flow counteracts the gas flow rate transferring the sam ple vapor from the vaporizing chamber into the column. The purge flow rate must, in fact, be small compared with the column flow rate. After the split outlet is opened, the purge flow is vented through the split line.
Stopping a Pulse?
A purge flow of 0.25 ml/min cannot prevent a pressure pulse driving vapor into the compressible volumes of the split out let (the vapor is formed at a rate 160-1000 times higher). It can only return lost material into the vaporizing chamber. Ifthe accessible volume in the split outlet was 2.5 mL, it takes a long time to purge it at 0.25 ml/min. It remains question able whether higher-boiling and somewhat adsorptive com ponents will also return to the column.
2.3. Septum
The septum has been one of the most widely discussed sub jects almost since the invention of GC, septum bleed being the predominant problem in early times (e.g. [6].) Numerous inventions have been made to replace the septum by a better means of closing the injector, but hardly any has been commercially successful. This prompted pro ducers to improve classical septa with regard to bleed, thermostability, puncturability, particle formation, and adhe sion to metal surfaces. An excellent summary is given by Restel< [7]. The thermostability of septa was discussed in Sec tion A8.3.
2.3.1. Required Tightness
The septum seals the injector chamber against ambient at mosphere, preventing escape of carrier gas and diffusion of air into the injector (possibly against a stream of escaping gas). How tight does it need to be?
Loss of Sample Vapor?
Some analysts fear that a leak through the septum causes sample material to be lost together with the escaping gas. They might overlook that such loss can occur only if the vaporizing chamber is overfilled, i.e. under conditions which are anyway unacceptable. With the Hewlett-Packard system, during splitless transfer the split flow rate is directed through the septum purge line and the vapor does not even reach the septum leak, because it has already been removed through the septum purge. This also removes air diffusing inwards through a leak.
Gas Regulation System
The effect on the analysis of a leak in the septum primarily depends on the gas regulation system. A leak can affect split injection, but not splitless injection. The mechanically pressure-regulated system is ro bust: it delivers an extra flow of carrier gas correspond-
UNIVERSIDAD DE ANTIOQUlA BffiUOTECA CENTRAL
424
E 2. Surroundings of the Vaporizing Chamber
ing to that leaving through the leak; the column and split flow rates remain the same, hence also the split ratio. This is no longer true for electronic pressure regula tion. As the proportional valve in the outlet regulating the split flow is guided by a flow sensor in the gas sup ply line (Section E4.3.2), the split flow rate will be too low by the extent of the leak flow through the septum. Excessively large peaks are obtained. Flow/backpressure-regulated systems adjust too Iowa split flow rate whether based on mechanical or electronic devices: the flow rate through the split outlet is lower by the amount leaking through the septum. Peaks turn out to be excessively large.
2.3.2. Septum Bleed
Packed column gas chromatographs and corresponding in struments adapted for capillary GC were highly sensitive to septum bleed because they had no septum purge installed.
Septum Purge
Material evaporating from the lower face of the septum dif fused into the gas stream directed to the vaporizing cham ber and the column. With an active septum purge (Section E4.5), this problem is eliminated: the small purge gas flow constantly removes the bleed material.
Septum Particles
There remains, however, the problem of septum particles cut or ruptured from the septum and carried into the va porizing chamber by the syringe needle. Material bleed ing from these particles is not removed through the septum purge. Their effect on the chromatograms depends on nu merous factors, including the selectivity ofthe detector used. In split injection, the material is split in the same way as the sample components while almost the full amount enters the column during splitless injection (unless the needle is intro duced before the split outlet is closed, as recommended in Section D2.5).
Influence of Column Position
Packings or obstacles in the liner positioned above the column entrance stop the septum particles. Bleed material evaporates into the gas stream directed to the column. With an empty liner and a column entering it by some 5 mm (classical concept, Figure E4), the particles drop past the column entrance and bleed material will hardly show up in the chromatogram. In split injection, the gas flow immediately carries the material out of the injec tor. In splitless injection, the vapor is unlikely to be swept upwards to the column entrance and is also discharged at the end of the splitJess period. Septum particles occasionally cling to the liner wall above the column entrance. Evaporated material will then reach the column, causing septum bleed to show up occasionally.
-2.3. Septum
425
Poor Reproducibility
Septum bleed originating from particles dropping into the vaporizing chamber typically produces "ghost peaks" of widely varying size. There might be 10 injections without a fresh septum particle being introduced and the "ghost peaks" are absent, whereas the next produces a forest of "ghost peaks". Hence a rapid test involving a single injection of sol vent easily leads to a false conclusion.
Testing
The fingerprint of the septum material should be known to recognize it when a chromatogram is severely disturbed by it. Because even a large number of solvent injections might not produce the peaks, a test with a small piece of septum is more effective. The piece is cut from a septum of the type used and inserted into the vaporizing chamber. It should be handled with tweezers to avoid a "fingerprint" chromato gram in the proper sense -large amounts of squalene, cho lesterol, branched wax esters and fatty acids are transferred by a single touch [81. A liner must contain some wool or an obstacle to support the piece of septum. The piece is dropped into the chamber, the chamber closed and the gas switched on again. After some 10 s with an elevated split flow, purging material from the surfaces, the split outlet is closed for splitless transfer with the column temperature low enough to achieve cold trapping. The split outlet is then opened widely and the oven temperature programmed. The analysis can be repeated with a longer splitless period (maybe 10 min) to compensate for the fact that thermal desorption of the bleed material might already be fairly complete.
Bleed Material
As shown by chromatograms in the Restek Guide, the com position of septum bleed can vary widely. It may contain low molecular weight siloxane monomers and oligomers, plasti cizers, such as phthalate esters, mineral oil hydrocarbons used on tools for cutting the septa, or material transferred from the fingers during handling and mounting.
2.3.3. Effect of Particles
After some time, septum particles no longer release bleed, but can still affect chromatographic performance. Because they are manufactured by the same material as the most widely used stationary phases, their retentive power is sub stantial and they tend to hinder vaporization of high-boiling compounds, resulting in discrimination against the late eluted components. The video showed how the sample liquid tends to be sucked into these particles of low thermal mass, which accentuates the problem. The sample is "filtered" through retaining septum particles provided the particles are located above the column entrance, i.e. when the liner contains a packing or an obstacle, or when the column in mounted low in a goose-neck liner. Classical injector design avoided the problem by positioning the col umn entrance ca. 5 mm above the bottom of an empty liner.
on Sample Evaporation
426
E 2. Surroundings of the Vaporizing Chamber
2.3.4. Recommendations
The first recommendation is certainly that the most suitable septum should be selected from those offered commercially. High-temperature septa are not necessarily the best. When the injector head is at a modest temperature only, a softer septum will last longer, particularly when used for thick needles, such as those used for headspace analysis. Particle formation is also reduced.
Septum Conditioning?
In the early times of GC, before septum purge became stand ard, many GC ovens contained a small beaker containing several septa which were baked out with every GC run over weeks or even months. This indeed removed the volatile material, but also oxidized the septa and rendered them harder, reducing their performance with regard to punctur ability and fragmentation. With septum purge and the sub stantial improvement of the septa, conditioning is no longer considered appropriate.
Puncturing at Same Point
A needle guide in the septum cap should help the syringe needle to pierce the septum at the same spot every time such that just a single channel is cut. Autosamplers facilitate this by a reproducible movement of the needle. Manual injec tion, however, typically introduces the needle at many sites and in different directions, cutting many channels which fi nally cause this region of the septum to fragment into small pieces. Sooner or later these particles fall out and are trans ferred to the vaporizing chamber. For this reason, septa last longer when used with autosamplers.
Tightening the Septum Cap
With regard to securing of the septum cap, there are two opposing arguments. On the one hand, greater force results in higher pres sure closing the core, which keeps the septum tight for more injections - as long as the needle always passes through the same channel. On the other, it increases the probability of pieces being cut out and a hole being cored which can no longer be closed by pressure. This is particularly likely to occur when the needle cuts the septum at many points. Practice seems to suggest the following two rules. 1 Particularly for manual injection, septa should be com pressed as little as possible in order to provide an easy passage for the syringe needle. The septum cap is tightened and then loosened again until the leak detector registers escaping carrier gas. The cap is then slightly re-tightened. 2 Septa must be tightened when hot. They expand strongly upon temperature increase and build up high pressure when the cap is secured at ambient tempera ture. This is also one of the reasons why injectors should be permanently heated: shrinking upon cooling may cause a leak.
2.3. Septum
427
Syringe Needle
With regard to the lifetime of a septum, needles with a side port hole are preferable to those of the beveled or cone style. They should not be used for the injection of samples in volatile solvents, however, because ofthe uncontrolled move ment of the sample in the vaporizing chamber. Hence they are useful only for the injection of high-boiling samples (trans ferred to the liner wall) and headspace analysis. The thicker needles used for the latter tend to be particularly harmful to the septum. Particularly when of the beveled style, the tip of the nee dle must be checked frequently, because a small defor mation rapidly ruptures the septum. Fingers feel deforma tions before they are visible by eye. Small hooks or edges are easily removed by drawing the needle through two pieces of fine sandpaper which are pressed together.
2.3.5. Merlin MicroBeal
Pre-cut septa sealed by the inlet pressure have been avail able for some time, but they could not be used at high tem perature. A more recent development, the Merlin Microseal, might ,be more successful, provided the septum cap does not exceed moderate temperatures. It consists of a pre-cut septum and is actuated by a small spring which keeps the needle entrance closed. The Merlin Microseal is supposed to last for many thousands of injections and should not release septum particles.
2.4. Heating of the Injector
Today's instruments show the injector temperature with the precision of a single degree. This pretends accuracy which is neither real nor useful. A difference of 100 is hardly of importance, considering that during sample evaporation the vaporizing zone is often cooled by many tens of degrees, at exactly the time the injector temperature is really important.
Heating up
Strong deviations can occur when the injector is freshly heated, because the temperature sensor is situated near the heating cartridge and reaches the set point more rapidly than the vaporizing chamber. The injector head is heated particu larly slowly. As this severely influences the evaporation in side the needle, the first analysis often produces odd results (e.g. greater discrimination). This is another reason for not switching off the injector heating overnight or at week ends.
Temperature Distribution
Only a small section of the vaporizing chamber, situated just below the center, is really thermostatted at the set point. The injector head, including the septum, is often more than 1000 cooler. The temperature of the part reaching into the oven commonly depends on the oven temperature. The temperature profile through the injector of the Hewlett Packard 5980 instrument is shown in Figure E13. The ex treme temperature drop towards the septum cap is a pre requisite to prevent evaporation inside the needle when in
428
E 2. Surroundings of the Vaporizing Chamber jecting with the fast autosampler. A flat profile for an injector for thermospray injection, was shown in Figure A21.
-
InjlctlGII PlIIt So1Pollll Tlmpllllla,.
ollllplum
35O·C
~,
.........:O;;;;;;;;~~
10
20
:
I I I
30
Sy'TIp itI,"
40 50
&0 10
&0
".IGI
90
35·C
a.ln
tllliclioo PlIIt 50
100
150
200
250
300
350
Tlmpllo1... In Gil SIrllm (·CI
Figure E13 Temperature profile through the injector of the Hewlett Packard 5980 instrument. (From Klee [9].1
2.4. 1. Injector Head
In the early days of GC, a steep temperature drop towards the septum was a prerequisite for the use of elevated injec tor temperatures as septa were insufficiently thermostable. Today this is no longer a valid argument, firstly, because ther mostable septa are available (they withstand ca. 300 °CI and, secondly, because the septum purge prevents septum bleed from reaching the column.
Evaporation in the Needle
As discussed in Section A8.2.3, the temperature of the injec tor head is relevant to sample evaporation inside the syringe needle. A cool injector top helps to keep the needle tempera ture low and prevent evaporation inside. If evaporation in the needle cannot be avoided or is ex ploited for thermospray injection, the injector should be well heated up to the septum cap.
Condensation of High Boilers
In splitless injection, sample vapor expands backwards up
to the top of the liner. If the liner wall is substantially below
the regulated temperature, high-boiling components are
likely to recondense and might no longer reach the column
during the splitless period. Related losses are poorly repro
ducible because the expansion of the sample vapor tends to
be different for every injection.
Measuring the Temperature Profile
When methods are transferred to other instruments,
setting the same nominal injector temperature does not en
sure identical conditions, because the temperature gradients
towards the top and bottom are often different.
The user should have an idea of the temperature distribu
tion within his injector. Measurement with a thermocouple
2.4. Heating of the Injector
429
is, in fact, easy. The thermocouple is introduced through the septum cap from which the septum and the narrow bore septum purge device have been removed; temperatures are measured at different depths in the injector. 2.4.2. Base of the Injec tor
Heating of the base of the injector, including the column at tachment, is primarily responsible for the temperature of the column inlet. Because the first few centimeters of the col umn are often contaminated with retaining material enter ing as aerosol, the temperature should be at least as high as that of the oven.
Dependence on Oven Temperature
The temperature of the base of the injector depends on that of the oven and can drop below 100°C after prolonged cool ing of the latter. There is no basic objection to this, provided the vaporizing chamber is not cooled and the temperature increases again at such a rate when the oven is heated that it never lags behind that of the oven. The latter is critical for fast programs, for instance after injection at a low oven temperature to obtain a cold trapping effect.
Minimized Heating of the Oven
Large changes of temperature also cause the ferrule of the column attachment to expand and contract, affecting the reliability of the seal (see below). This is in favor of a long heating block which keeps temperature high for the base of the injector also. On the other hand, heating of the oven by the injector must be minimized as this hinders chromatogra phy at low temperatures. This undesirable heat transfer also depends on the exposed surfaces and on the insulation in the oven roof.
3. Autosamplers Autosamplers are increasingly complex instruments combin ing many functions. Here only capabilities concerning the basic injection process are considered.
3. 1. Injection Speed
Since the introduction of the fast autosampler, the market is split into two types of samplers performing fundamentally different injection.
Fast Autosampler
The fast autosampler, patented by Hewlett-Packard (Agilent) in 1985, performs the whole injection in less than 500 rns (definition in the patent), sufficiently rapidly to prevent evapo ration inside the needle if the injector head is kept rather cool. Advantages and drawbacks have been extensively dis cussed in previous chapters.
430
E 3. Autosamplers
Non-Fast Autosamplers
All other autosamplers inject more slowly - speed relating to the process from inserting the needle to its withdrawal, not necessarily the depression of the plunger (see below). Hence "slow autosampler" would not be an appropriate term. They essentially imitate manual injection, with the ad vantage that manual and automatic injection result in the same evaporation process.
Needle Preheating
The more sophisticated non-fast autosamplers are program mable to perform hot needle injection, i.e. thermospray. The sample is withdrawn into the barrel of the syringe and the needle preheated in the injector during an adjustable period of time before the plunger is depressed. The function of leav ing the needle in the injector for an additional period of time after injection is less important.
Withdrawal of Solvent
Some autosamplers also enable withdrawal of solvent be fore or after the sample. When withdrawn before, it serves to perform solvent flush injection. Picking up ca. 0.2 III of solvent after the sample serves to clean the needle be fore it is introduced into the injector. It flushes the layer of sample liquid from the needle wall into the barrel. This prevents formation of a small pre-peak as discussed in Sec tion A5.3.4.
3.1.1. Injection Rate
Many autosamplers have a programmable injection rate, i.e. speed of depression of the plunger. This function has a vari ety of applications apart from split and splitless injection, but for vaporizing injection, fast depression of the plunger is always preferred. The fast autosampler injects in rapid mode to prevent evaporation inside the needle, but, as shown by the vid eos, is still slower than normal manual injection. For the other autosamplers, the plunger should be de pressed as rapidly as possible to enable the best per formance of hot needle injection. Slow depression of the plunger results in strong discrimination against the high-boiling analytes (Section A5.3.2).
Slowing in Last Phase
The drawback of depression by means of a stepper motor (the way programmable injectors are constructed) is the de creasing speed when the plunger approaches the bottom of the syringe. The movement must be slowed to avoid exces sive wear when the plunger hits the bottom. This slowing is undesirable but not totally avoidable.
3.1.2. Adjustable Depth of the Needle
Some autosamplers enable adjustment of the depth of pen etration by the syringe needle: the needle can be inserted only partly. This is useful in at least two instances: Split injection at elevated split flow rates profits from a longer distance between the needle exit and the col umn entrance, particularly when the liner is empty: there
3.1. Injection Speed
431
is more room for homogenization of the vapor. At split flow rates exceeding ca. 50 mLJmin, it is sufficient to insert the needle 3 cm. When the needle is inserted merely a minimum distance (ca. 15 rnrn), sample evaporation inside the needle can be avoided when the septum cap is not very hot and the solvent not too volatile. This results in the same performance (band formation) as with the fast auto sampler. In this mode of use, heating of the needle be fore and after depression of the plunger is avoided.
4. The Gas Regulation Systems The two fundamentally different concepts of gas regu lationfor split injection were described in Section C1.3: the pressure regulator/flow restriction and the flow/backpressure regulation system. Electronic systems differ somewhat from the early concepts using mechanical devices - approaching each other. Systems with mechanical regulators are also described be cause there are still many instruments of this type around and need not be replaced as long as there are no basic im provements. 4.1. Mechanical Pressure Regulation/Flow Restric tion
The pressure regulator/flow restriction system, shown in Fig ure E14, is the oldest concept. The gas supply is adjusted by a mechanical pressure regulator followed by a manom eter. The flow rates through the outlets of the septum purge and split line are regulated by means offlow restrictors, such as needle valves. Downstream ofthese valves there are usu ally devices for automated closure of the exits for splitless Manometer
~
y.
Needle valve
~ Septum purge
Il!IIIj!!....-
Pressure
regulator
Vaporizing
chamber
Needle
~
Flow meter
11
valve
cOlumn~L---y.--+ Split outlet
Figure E14
The classical pneumatic regulation system according to the
pressure regulationlflow restriction concept involving me
chanical components.
432
E 4. The Gas Regulation Systems injection. Some instruments direct the two lines to the same closing valve, which reduces costs, but renders adjustment of the flow rates less convenient.
4. 1. 1. Pressure Regula
tors
Basic Design
Here some general information on mechanical pressure regu lators is collected because these are used on many older GCs and in almost all gas supply systems, such as on the gas cylinders and in the gas distribution system. Mechanical pressure regulators contain a membrane which is in contact with ambient pressure (air) on one side and the gas to be regulated (e.g. the carrier gas) on the other (Fig ure E15). A spring compensates for the overpressure on the side ofthe regulated gas and can be loaded through a screw with a knob. The membrane actuates the valve. If pressure is too low (the sum of ambient pressure plus the force of the spring exceeds the pressure of the regulated gas), the valve allows gas to pass and to increase the pressure. It closes when the membrane approaches the equilibrium, i.e. the required pressure is reached. Knob to regulate pressure on the membrane
Figure E15
Schematic design of a mechanical pressure regulator.
Dependence of Pressure on Flow Rate
One of the weaknesses of mechanical pressure regulators is that the output pressure depends on the flow through the device. The valve should stop delivering gas as soon as the set point is reached - closure should occur at equilibrium. This is impossible because some force (overpressure) is required to obtain a seal. Pressure regulators are not designed for complete closure of the valve, but for the adjustment of a restrictor. The lower the gas flow rate, the tighter the valve should close, which requires increased overpressure. For this reason, the regu lated pressure tends to increase as the flow rate is reduced, with the effect that retention times become de pendent on the split flow rate. This is a problem primarily at flow rates below about 10 mL/min.
4.1. Mechanical Pressure Regulation/Flow Restriction
433
Effect on Retention Times
In split injection, the flow dependence of the regulated pres sure can affect retention time reproducibility when split flow rates are varied or when the split flow rate is strongly, but not reproducibly reduced some time after the injection is completed (gas saver). In splitless injection, closure of the exits of the split and the septum purge line can increase pressure and the column flow rate during the sample transfer period. This corresponds to a weak pressure pulse. It is probably not of significant usefulness, but has no adverse effect either.
Temperature Dependence
Pressure released by mechanical regulators depends on tem perature because the tension of the membrane and the pressure of the spring depend on it. This is one reason why retention times tend to drift at the beginning of longer series of analyses: pressure regulators for the carrier gas are usually installed as far removed from the oven as possible, but warming from a hot oven cannot be avoided entirely.
Precision, On/Off Valves
Some, users maintain the inlet pressure also during longer stand-by periods, such as weekends. They argue that re-ad justment is inaccurate and responsible for instability of the retention times. They often pay for this in the consump tion (waste?) of large amounts of carrier gas. Some instruments are equipped with on/off valves between the pressure regulator and the manometer. This enables switching off of the carrier gas without touching the pres sure regulators.
Air Tightness
Ambient pressure, i.e. air, is on one side ofthe relatively large membrane, carrier gas passes on the other side. The mem brane must not permit diffusion of air, because otherwise the carrier gas will be contaminated with oxygen and hu midity.
Flexibility of the Membrane
For accurate regulation, the membrane should be highly flex ible. So far, the best membranes have been made from rub ber or plastic. Polymers are open to diffusion of air and humidity, although to a widely varying extent, and one should keep in mind that diffusion is also possible against a pressure drop. It makes no sense to buy highly pure carrier gases when pres sure regulators contaminate them. Oxygen is a severe prob lem for polyglycol (Carbowax) type stationary phases, but also causes lacquering (excessive crosslinking) of silicones at temperatures above ca. 300°C. Humidity does not seem to be a problem for the column, but it does affect the per formance of ECDs.
Metal Membranes
Diffusion-free membranes are made from metal, mostly con structed as bellows for flexibility. As an inexpensive trick, plastic membranes can be covered with thin metal
434
E 4. The Gas Regulation Systems foil. The regulator is dismantled and aluminum foil (e.g. from a chocolate bar, the chocolate rewarding the effort of saving money) is placed on the membrane. Thin steel foil is actually preferable because of the lower risk of its being torn during re-assembly ofthe regulator [101.
Regulators in the Gas Distribution
Regulators on gas cylinders and in gas distribution systems are usually more of a problem than those in the instruments. Some have extremely large membranes and enable passage of a correspondingly large amount of oxygen and humidity. It is recommended that regulators with steel membranes are used for these installations, also because precision is of minor importance there.
4.1.2. Manometer.
Accuracy of pressure regulation primarily depends on the manometer, because the regulator is adjusted to reach the set point shown by the latter. Mechanical manometers usu ally contain a hollow spring that tends to stretch (straighten) with increasing internal pressure. By means of a reversing lever, the position of the end of the spring turns the needle of the manometer.
Problematic Accuracy
Mechanical manometers are sensitive to overpressure and sudden increases of pressure, because the spring is easily deformed. In fact, when manometers are checked after some years of use, some easily show deviations of 20-30 kPa.These are often the main cause of variations in the retention times obtained from different instruments. The pressure indicated depends, furthermore, on temperature, because it depends on the tension of a spring.
Check Column Head Pres sure in Injector
Inaccurate column head pressure is often the main reason for deviations in retention times. If such deviations cause problems, inlet pressures should be checked regularly, e.g., by use of a manometer equipped with a syringe needle. The needle is introduced through the septum, as shown in Fig-
Carrier gas
Figure E16 Measurement of the carrier g8S pressure inside the injector by means of a manometer equipped with 8 syringe needle.
4. 1. Mechanical Pressure Regulation/Flow Restriction
435
ure E16. It should be long enough to enable penetration through possible packings, because this enables compari son of the pressure above and below such a resistance. The most reliable pressure reading is obtained in the "quiet" corner just below the septum, because a high gas velocity at the needle exit can pull gas from the manometer, causing it to indicate too Iowa pressure. 4.2. Mechanical Flow/ Backpressure Regulation
In the late seventies, Hewlett-Packard introduced the flow/ backpressure regulation system in response to the dense packings (occasionally) used in the vaporizing chamber at that time. The mechanical system, still incorporated in the HP 5890, is shown in Figure E17. It includes a flow regula tor in the carrier gas supply line, a needle valve in the septum purge outlet, as well as a charcoal filter, manometer, and backpressure regulator in the split outlet.
-b-o---.,r-I---- ~
,Needle valve
Flow regulator
Septum purge
Flow
sensor
Manometer Filter Column
Split outlet Backpressure regulator
Figure E17 The mechanical flow/backpressure regulation system of the HP 5890 system for the split-only inlet.
Pressure Drop over Dense Packing
Backpressure regulation in the split outlet was introduced to enable reliable control of the column head pressure even when there was a substantial pressure drop in the injector liner (dense packing). It was a further development of the system proposed by German and Horning [11], who found that retention times depended on the split flow rate, as a result of varying pressure drops over the packing. As mentioned above, pressure drops become noticeable only under conditions combining a high split flow rate with a nar row bore liner packed with a long and dense plug of pack ing. A 1 cm bed of commonly used column packing material creates less than 10 kPa pressure drop even when the split flow rate is as high as 300 mllmin. Dense plugs of glass wool are clearly more permeable and do not produce noticeable pressure drops under any conditions. It should, furthermore, be remembered that high split flow rates cause variations of the column head pressure for other reasons also. Hence, backpressure regulation was introduced to solve a problem that no longer exists.
436
E 4. The Gas Regulation Systems
Splitless Injection
As the regulated flow could not be stopped during the splitless period, the flow passing through the vaporizing chamber was re-directed. As shown in Figure E18, an elec tric three-way valve was installed in the split outlet. During the splitless period, the main gas stream passed into the septum purge line and around the injector directly into the split outlet. To purge the injector (normal position), the sole noid valve was switched to feed the gas flow through the vaporizing chamber, closing the re-direction route. In con trast to the pressure regulator/flow restriction design, no on/ off valve was required at the exits of the septum purge and split line (closing the septum purge exit was useless since there was anyway a high gas flow rate passing the top of the vaporizing chamber).
I
Needle valve
4-o--n,....----T"""-.y--.. Flow regulator
Septum purge
Flow sensor Re-direction of the split flow during the splitless period Manometer
Split outlet
Figure E18 The flowlbackpressure regulation system of the HP 5890 instrument as used for splitleaa injection.
4.2. 1. Comparison of the Two Systems
Both the pressure regulator/flow restriction and the flow/ backpressure regulation system have advantages. Beyond those mentioned above, the following points are important. The flow/backpressure regulator system basically ena bles adjustment of the split flow rate without flow measurement at the split exit. 2 The maximum split flow rate is limited by the capac ity of the flow regulator, usually 500 mt/m!n. 3 Split flow rates and, hence, split ratios controlled by the flow/backpressure regulator system are more strongly affected by the pressure wave resulting from sample evaporation than those regulated by pressure/flow re striction systems (Section C8.3.1). 4 In the event of severe leakage or if the column is dis mantled without the carrier gas supply being switched off, the loss of carrier gas into the GC oven is limited by the flow regulator of the flow/backpressure regulator system, whereas it can be extremely high in the other. If hydrogen is the carrier gas, however, safety considera tions still call for a sensor to check hydrogen concentra tions in the oven atmosphere.
-4.2. Mechanical Flow/Backpressure Regulation
5
4.3. Electronic Regula tion Systems
437
The flow/backpressure regulator system is a drawback for splitless injection since the high gas flow rate pass ing over the head of the liner into the septum purge line accentuates the loss of sample material backwards out the vaporizing chamber.
In the early nineteen nineties, fully electronic regulation sys tems were introduced in response to the need of automa
tion and regulation by means of data systems. Data systems enable downloading of complete meth
ods, ruling out erroneous adjustment of parameters.
Quality assurance and GLP require complete documen
tation.
Electronic devices tend to be more accurate than me
chanical regulators.
Because mechanical regulators could not be directly trans lated into electronic devices, the transition brought about some modifications. Proportional Valves
Mechanical pressure and flow regulators were replaced by proportional valves which feed a gas flow according to a set point which can be a pressure or a flow rate. This enhanced the flexibility of the system. A flow and a pressure sensor were built into the system which enabled regulation by ei ther principle and measurement of the other for calculating column and split flow rate.
4.3.1. Flow/Backpre88ure Regulation
A diagram of the pneumatic system of the Hewlett-Packard/ Agilent 6890 instrument is shown in Figure E19. Proportional valve 1
~ ...i.l.ter .....
F?
P?
Flow sensor
Pressure sensor
Pressure R .. I estnction regu ator /
~~-+-SePtumpurge ~ Onloff valve
Fixed septum purge regulator
t--......-.... Split outlet
Figure E19
Electronic carrier gas control of the HP 6890 instrument.
Split Mode
The philosophy ofthe system for split injection corresponds to that with the mechanical regulators. Proportional valve 1 feeds gas according to the set point for the flow rate controlled by the flow sensor down stream in the supply line. The combination of the valve and the sensor acts like the previous flow regulator. Proportional valve 2 in 'the split line controls the split flow rate. It is regulated by the pressure sensor and a
438
E 4. The Gas Regulation Systems pressure set point from the software for the column head pressure. It acts, hence, like the previous backpressure regulator. The split flow rate is equal to the total flow rate regulated by the flow sensor minus the fixed septum purge flow rate (3 mt/rnln) and the calculated flow rate through the column.
Pressure Sensor Above Liner Packing
In contrast with the earlier design, the pressure sensor is positioned in the septum purge line. On the one hand, this protects it from sample material passing through the split outlet. On the other, a reduced column inlet pressure result ing from a pressure drop over a dense packing in the vaporizing chamber can no longer be prevented, hence the original justification of flow/backpressure regulation is aban doned.
Splitless Mode
Because of the flexibility of the components, splitless trans fer can now be performed by the principle of pressure regu lation/flow restriction. During the splitless period, proportional valve 1 feeds gas according to a set point which can be a constant pressure or a pressure program, controlled by the pres sure sensor in the septum purge line. The flow through the split outlet is stopped by an on/off valve. After the splitless period the system switches back to backpressure regulation mode, valve 1 guided by flow, valve 2 by pressure. In its essence, the pneumatics active during splitless injec tion made the transition back to the classical design.
Flow Adjustment by Means of Pressure Regulation
There is frequently confusion about electronic regulation of column flow rates in capillary GC. Direct flow regulation is possible for packed columns, but not for capillary GC with split/splitless injection because of the far higher flow rates through the split and the septum purge exits. Column flow rates are adjusted by means of the inlet pressure; the soft ware calculates the required inlet pressures for given oven temperatures, adjusts it is flow performance is pro grammed, and defines the pressure set points accordingly.
4.3.2. Pressure Regula tion/Flow Restriction
The electronic and data-system-controlled version of the pneumatics for the pressure regulation/flow restriction sys tem is shown for the TRACE GC from CE Instruments. The components used are basically the same as those found in the HP 6890 instruments (Figure E20).
Regulation system
The proportional valve 1 in the supply line feeds gas accord ing to the pressure set-point and the pressure determined by the pressure sensor. The desired split ratio is entered into the data system, where the split flow rate is calculated from the column flow rate and the fixed septum purge flow rate (5 mljmin for helium). The split flow rate is controlled by
4.3. Electronic Regulation Systems Proportional valve 1
F?
P?
Flow sensor
Pressure sensor
Pressure A I 'c!' I esm Ion regu ator /
~~sePtumpurge
~ . . . iller •...
439
~
On/off valve
Fixed septum purge regulator
1-..... -...
Split ounet
Figure E20 Electronically controlled pneumatic system of the TRACE GC from CE Instruments.
proportional valve 2 in the split outlet which is guided by the
flow sensor in the supply line.
For splitless injection, the system incorporates two on/off
valves, but works as in split mode.
Reaction on the Pressure Wave
Electronic regulation systems react to the pressure wave ini
tiated by sample evaporation in a way other than the two
mechanical systems described above. Immediately after in
jection, the pressure sensor observes a value exceeding the
set point and closes the proportional valve. The flow sensor
observes a reduction and tends to open the proportional valve
in the split outlet. As this would, in fact, increase the split
flow rate (the weakness of backpressure regulators), the re
action of the proportional valve is dampened to such an
extent that it does not respond to a wave.
4.4. Charcoal Filters in the Split Outlet
Many instruments are equipped with a charcoal filter in the
split outlet line. There are good reasons for this, but also
some problems.
4.4.1. Advantages
Some analysts are concerned about the toxicity of the solute
material leaving the split outlet - in split injection, 90-99 % of
the sample is vented through this outlet. Handling of toxic
material certainly requires proper attention, but samples with
toxic components are usually highly diluted and injected by
a non-splitting method. Much more material is spilled, fur
thermore, e.g. during cleaning and loading of the syringe.
Unless the toxic substances are highly volatile, they will
hardly ever leave a split line. They undergo a kind of capil
lary GC in the cool outlet tube coated with a thick layer
of previously deposited sample material. In fact, such tubes
can even become plugged.
Retention of Toxic Sub stances
Protection of Regulators
Regulation of the split flow rate by means of electronic ele
ments requires a filter preventing contamination of the
devices. Needle valves were easy to clean (and might have
required cleaning every year to ensure good performance),
but this is no longer possible with modern systems.
440
E 4. The Gas Regulation Systems
Stability of the Split Ratio
The last (and oldest) argument concerns the stability of the split ratio in systems regulated by means of a restrictor (such as a needle valve). The viscosity of the solvent vapor differs from that of the carrier gas, and when passing through the restrlctor, it alters the flow rate. A strong adsorbent, such as charcoal, is used in order to retain solvent vapors for a short period of time at least, such that the change in the split flow rate occurs only after the whole sample has passed the split point.
Viscosity of Sample Vapor
The least viscous vapor, that from pentane, is nearly three times Jess viscous than helium and 20 % less viscous than hydrogen. The most viscous vapor (dichloromethane, chlo roform, acetone) is slightly more than half as viscous as he lium and some 15 % more viscous than hydrogen [121. Hence, vapor viscosity differs rather little from that of hydro gen, and even compared with helium, differences are not spectacular when it is considered that the vapor is diluted several fold. Backpressure regulation is not affectedby viscosity changes, nor are modern electronic systems with proportional valves.
4.4.2. Drawbacks
At least when the charcoal is fresh and absorbs the vapor, it sucks the sample vapors into the filter, i.e. into the split out let, and increases the split ratio. In most instruments, the charcoal is not exchanged for years (many users not even know of its presence) and has lost most of its effect (includ ing the negative one). As filters have an internal volume of ca. 2 mL, they are a severe problem for splitless injection: as described above, pressure increase during sample evaporation pushes vapor into the split outlet. Closure ofthe line should occur upstream of the filter.
4.4.3. Suitable Size
Present filters are large, probably to have a high capacity to retain solvent. Assuming that charcoal retains an amount of solvent similar to its own weight (several hundred milli grams), after a few hundred injections it is saturated and the solvent is slowly released again. Release will occur at low concentration, such that the filter still has a dampening effect and prevents solvent recondensation in the cool regu lating devices. The capacity for higher-boiling material is high and ensures that the vapor pressure in the passing gas re mains low enough to prevent condensation in the critical parts. In trace analysis it takes years to deposit milligrams of mate rial. Injection of undiluted samples in split mode can, on the other hand, consume the capacity of the filter in weeks. If the injector is primarily used for splitless injection, char coal filters should be small (e.g. 300 ~L). When also used for split injection of concentrated samples, they must be regu larly replaced even when their internal VOlume is ca. 2 mL.
4.5. Septum Purge
441
4.5. Septum Purge
The septum purge was introduced by Kurt Grob in 1972 (13). As the term implies, it serves to keep septum bleed away from the vaporizing chamber and the column. Removal of septum bleed is particularly important if high injector tem peratures are used.
Removal of Solvent Vapors
The septum purge was, however, introduced for another purpose specific to splitless injection: even if the vaporizing chamber is not significantly overloaded, some vapor diffuses backwards from the liner into the septum area (Section D3.3.1I. Purging the vaporizing chamber at the end of the splitless period does not remove this vapor. If there is no septum purge, such vapor slowly diffuses back into the stream of carrier gas directed towards the column entrance and causes broadened and tailing solvent peaks. The septum purge may be constructed as shown in Figure E21. The carrier gas entering the injector is split into a main stream directed to the column and a small purge stream flow ing towards the septum and through a separate exit. Septum bleed and solvent vapors diffusing towards vaporizing chamber
Septum
Carrier gas in
===--~;;r::N
Side stream of carrier gas stopping diffusion
Injector liner to column and split exit
Figure E21
Injector head with septum purge. A small proportion of the
carrier gas flows towards the septum and through a sepa
rate exit.
Design
The key component is a narrow channel through which carrier gas is diverted from the vaporizing chamber towards the septum purge outlet. The relatively high velocity of the gas in this channel rules out diffusion from the septum re gion towards the vaporizing chamber. The septum purge device must be removable to enable re placement of the injector liner and must be tight fit in the injector body so that it does not create new dead volume. A ferrule between the device and the injector body should be avoided because this might again cause bleed and "ghost" peaks. As there is no significant pressure drop, it is sufficient if the device fits closely into the injector body.
Gas Velocity
The linear velocity of the gas in the narrow channel di rected towards the septum must be at least equal to the ve
442
f 4. The Gas Regulation Systems locity of the vapors tending to diffuse from the septum zone towards the column. This velocity is in the order of millimeters per second. The minimum purge ge8 flow rete required is smaller the narrower is the channel; the channel must be just large enough to enable passage of the syringe needle. For a 0.8 mm i.d. channel, the minimum flow rate is calculated to be ca. 0.1 mLlmin (which is difficult to measure).
Purge Flow Rate
The flow rate can exceed this minimum substantially. Dur ing splitless injection, high gas velocities can cause turbu lence in the liner and suck out sample vapor. Suitable septum purge flow rates range from 0.5 to 10 mLlmin. As the septum purge flow rate is rather uncritical, it is usu ally adjusted just once, by application of an intermediate carrier gas inlet pressure. The needle valve can be replaced by a (cheaper) restrictor consisting of 0.5 mm i.d. steel tub ing crimped to provide the required flow rate. New instruments often regulate a fixed 8eptum purge of 3-5 mL/min. This is achieved by means of a pressure regula tor releasing the gas at a constant and' low pressure (below the inlet pressures likely to be used), followed by a restrictor. Hence, the pressure drop overthe restrictor is kept independ ent ofthe carrier gas inlet pressure by means ofthe pressure regulator.
E References
443
References E K. Grab and K. Grob, "Splitless Injection and the Solvent Effect", J. High Reso!. Chromatogr. Chromatogr. Commun. 1 (1978) 57. 2 M. van Lieshout, M. van Deursen, R. Derks, H.-G. Janssen, and G.A. Crsmers, "The Influ ence of Liner Dimensions on Injection Band Broadening in Split Injections in Fast Capil lary GC", J. High Reso!. Chromatogr. 22 (1999) 116. 3 American Society for Testing and Materials (ASTM), "Standard Practice, Installing Fused Silica Open Tubular Capillary Columns in Gas Chromatographs", ASTM E 1510-93, 1993. 4 K. Grob and M. Biedermann, "Visual Experiments on Sample Evaporation: Conclusions on Split and Splitless GC Injection and Injector Design", Anal. Chern. (2001) 5 A. Kaufmann, "Maximum Transfer Conditions for Splitless Injection", J. High Resol. Chromatogr. 20 (1997) 193. 6 D.M. Ottenstein and P.H. Silvis, "GC Septa: A Comparison of Bleed Characteristics", J. Chromatogr. Sci. 17 (1979) 389. 7 Anonymous, "A Guide to Minimizing Septa Problems", Restek Corporation 1998. 8 M. Biedermann and K. Grob, "GC Ghost Peaks due to Fingerprints", J. High Resol. Chromatogr. 14 (1991) 558 9 M.S. Klee, "GC Inlets - An Introduction", Hewlett-Packard Co., Avondale (1991) 42. 10 K. Grob, "Diffusion-free Pressure Regulators in Capillary GC", J. High Resol. Chromatogr. Chromatogr. Commun., 1 (1978) 173. 11 A.L. German and E.G. Horning, J. Chromatogr. Sci. 11 (1973) 76. 12 K. Grob, "On-Column Injection in Capillary GC" (1991) 529. 13 Kurt Grab and G. Grob, "Techniques of Capillary GC. Possibilities of the Full Utilization of High-Performance Columns. Part I: Direct Sample Injection", Chromatographia 5 (1972)
3.
Appendix 1
445
Appendix 1 Selection of the Injection Technique
Classical Split Injection
Use for: relatively concentrated solutions: 20 ng/Ill to 1 % (FID) per component; analysis of undiluted samples; headspace analysis; and/or fast, fully isothermal analysis. Simple to handle; flexible with regard to sample concentra tion, solvent, and column temperature during injection; op timum reproducibility of absolute retention times; demand ing for analyses requiring high accuracy; high risk of sys tematic errors.
PTV Split Injection
Eliminates problems resulting from evaporation inside the needle: enables injection of small volumes «1 Ill) and avoids discrimination against high-boiling material as a result of se lective elution from the needle; samples always evaporate from surfaces (liner wall or packing), i.e. reproducible proc ess, but sensitive to surface effects.
Splitless Injection
Use for: dilute samples: 0.5 to 50 ng/Ill per component, 10 pg/ III with vapor overflow (FID); and/or "dirty" samples, especially if highly accurate results are not the first priority. Produces relatively accurate results for volatile solutes; prob lems with quantitation of high-boiling solutes (matrix ef fects!); requires reconcentration of the initial bands by cold trapping or solvent effects, which often necessitates cooling of the column during injection.
PTV Splitless Injection
For differences compared with classical splitless injection, see PTV split injection.
PTV Solvent Split Injection
For splitless injection of components of intermediate to high boiling point; most of the solvent is vented (all if performed by backflushing). Used for large volume injection (up to 500 Ill) and if the solvent or a derivatization reagent disturbs the detector.
446
Appendix 1
On-Column Injection
Dilute samples: 300 to 0.01 ng/Ill per component (FlO); best method for producing highly accurate results and analyzing labile compounds; not suitable for highly contaminated sam ples (samples containing more than ca. 0.1 % of involatile by-products); injection requires cooling of the column be low the solvent boiling point (except for high oven tempera ture on-column injection).
Appendix 2
Selection of Conditions for Classical Split and Splitless Injection Evaporation Inside Syringe Needle
If possible, prevent sample evaporation inside the syringe needle. Use high-boiling solvents, low injector temperature (including cool septum cap), short needle, fast injection. If evaporation inside the needle cannot be prevented, the amount of sample material transferred from the needle should be maximized by the use of a high injector tempera ture (including a hot injector head) and hot needle injection.
Sample Volume
If evaporation inside the syringe needle cannot be avoided, use 5 or 10 III syringes, although the minimum volume in jected then corresponds to the needle volume, i.e. 0.5-1 ul., Injection of "0.5" to "1 Ill" (volumes read on the barrel of the syringe, i.e. in addition to the needle volume) improves transfer of high-boiling components from the syringe nee dle. Splitless injection without vapor overflow: maximum sample volume ca. 2 ul., Split injection: small sample vol umes (ca. "0.5" Ill) tend to produce better quantitative re sults.
Length of Syringe Needle
long needles, releasing the sample near the column entrance, for split/ess injection and split injection with low split flow rates (exception, fast autosampler injection), as well as for headspace analysis. Short needles for split injection with high split flow rates and for samples in high boiling matrices or matrices which evaporate with difficulty.
Injector Temperature
Minimum injector temperature if sample evaporation inside the syringe needle can be avoided. Otherwise maximum in jection temperature not degrading solute material. Splitless injection: high injector temperature improves sample trans fer and reduces matrix effects.
Appendix 2
447
Width of Liner
The sample vapor must not overfill the injector liner (except for the vapor overflow technique). Splitless injection: liners of 3-5 mm i.d, Split injection: split ratios tend to be more accurate with 3-5 mm i.d. liners; if split flow rates are low, 2 mm i.d. liners provide sharper initial bands.
Packed Liners; Liners with Obstacles
Rule to start with: 1 packed liner or liner with built-in obstacle for fast autosampler injection; 2 packed or narrow bore empty liner for samples in high boiling matrices; 3 empty liner for injection with thermospray. Packing the vaporizing chamber with, e.g., silanized glass or quartz wool, or use of liners with built-in obstacles prevents unevaporated sample liquid from flying past the column entrance after injection with band formation. Such techniques might also reduce entry into the column of involatile by-prod ucts after injection with thermospray. The packing material might promote decomposition of labile solutes, cause "ghost" peaks, and retain (adsorb) high-boiling components.
Carrier Gas Flow Rate
Splitless injection: high carrier gas flow rates improve trans fer of solutes from the injector into the column; below 2 mLl min sample transfer usually becomes unsatisfactory (below 1.5 mLlmin if solvent recondensation accelerates transfer). If
possible, increase pressure during transfer.
Split injection: high carrier gas flow rates to obtain maxi
mum sensitivity, but low flow rate for high split ratios. At
high carrier gas flow rates, the best separation efficiencies
are obtained with 0.32 mm i.d. columns.
Duration of the Splitless Period
At a carrier gas flow rate of 4 mLlmin and without solvent recondensation, a splitless period of 40 s is usually sufficient; at 2 mt/rnln, the duration should be extended to 90 s.
Column Temperature During Injection
Split injection: whenever possible avoid column tempera tures more than 20° below the solvent boiling point to pre vent recondensation in the column inlet (sucking more sam ple material into the column than expected from the pre-set split ratio). Splitless injection: reconcentration of bands broadened in time requires either reduction of the column temperature to at least 60-90° below the elution temperature of the solutes of interest (cold trapping) or a column temperature at least 20-25° below the solvent boiling point (solvent effects).
448
Appendix 3
Appendix 3 Glossary of the Most Important Terms Used in the Text Air plug injection: syringe handling technique for injection of liquids; use of an air plug be tween the sample plug and the plunger. Autosampler. device for automatic injection. Band broadening in space: spreading of the initial solute bands in a manner which causes their length to be equal in terms of column length; caused, e.g., by flow of sample liquid in the column inlet. Band broadening in time: spreading of the initial solute bands such that they have the same width in terms of gas chromatographic retention time at the temperature of injection; caused, e.g., by slow transfer of the solute material from the injector into the column during splitless injection. Band formation: injection through a cool syringe needle such that the liquid leaves as a band (jet) or row of aligned droplets; typical of fast autosampler injection. Butt connector. "low" or "zero dead volume" unions for connecting capillaries by means of a compression fitting and ferrule. Capacity of the column: maximum amount of a component which can be injected without causing overloading of the column (peak asymmetry). Cold split/splitless injection: synonymous with programmed temperature vaporizing (PTV) injection. Cold trapping: technique used for reconcentrating solute bands broadened in time: the sol utes are introduced into the column at an oven temperature substantially below their elution temperature. Concurrent solvent evaporation: evaporation of the sample solvent during introduction of the sample into the column inlet. Classical vaporizing injection: injection into a permanently hot split/splitless injector. Cool needle injection: the sample liquid is withdrawn into the barrel of the syringe, the needle is introduced into the injector, and the plunger is depressed without delay. Dead time: see Gas hold-up time. Direct injection: non-splitting vaporizing injection into a liner connected directly to the col umn entrance (there is no split outlet). Discrimination: discrimination against a solute occurs if the proportion of the solute entering the column is smaller than that of other solutes used as the basis of comparison.
Appendix 3
449
Dynamic headspace analysis: analysis of the volatile components of a sample by stripping with a flow of gas or by continuous removal of the headspace gas above the sample; components are usually enriched on a trap. Elution temperature: column temperature at which a component is eluted from the column and enters the detector. Enhancing matrix effect presence of matrix material in the sample causes peak areas for a given amount of solute to be larger for the sample than a solution of standard in solvent (e.g. calibration mixture); results from adsorption in the injector or column. External standard method:. determination of a concentration or amount represented by a peak by comparison of the peak area or height with that obtained by analysis of a mixture of standards containing a known amount or concentration of the solute of interest. Fifteen degree rule: rule of thumb that the chromatographic migration speed of a solute changes by a factor of two for each 15° step in column temperature. Filled needle injection: the sample is not withdrawn from the needle into the barrel of the syringe before injection. Flash evaporation: vaporizing injection under conditions resulting in virtually instantaneous sample evaporation in the gas phase; term coined before sample evaporation in a hot injector was investigated. Flooded zone: column inlet section over which the sample is spread by flow of the liquid; occurs in on-column injection or in splitless injection with solvent recondensation. Fluctuating split ratio: changing ratio of the split and the column flow rates during the split ting process. Full trapping: complete retention (solvent trapping) of a solute within the flooded zone during solvent evaporation, resulting in sharp initial bands. Gas hold-up time: time required for the carrier gas to pass through the column (also called "dead time"). Ghost peaks: peaks in a chromatogram not arising from material injected with the sample. Headspace analysis: indirect analysis of solutes in liquid or solid samples via the gas phase, i.e. the gas above the sample. Hot split/splitless injection: injection into a conventional, permanently hot injector. Hot needle injection: the sample liquid is withdrawn from the needle into the barrel of the syringe; the inserted needle is pre-heated in the injector for 3-5 s before rapid depression of the plunger. Injection temperature: column temperature during sample introduction. Initial band length: length of the column inlet over which sample material is spread (corre sponds to the length of the flooded zone in on-column injection or in splitless injection with solvent recondensation). Initial band width: width, in terms of time, of the solute band in the column inlet. Insert also injector insert or liner; tube housing the vaporizing chamber. Internal standard method: determination of concentrations or amounts of solutes by com parison of peak areas or heights with those obtained from a known amount or concentra tion of a substance added to the sample injected.
450
Appendix 3
Linear splitting: the split ratio is equal for all the components of a sample; the composition of the sample entering the column is identical with that inside the injector. Liner. glass or metal tube in the injector housing the vaporizing chamber. Matrix effect influence of the sample matrix (solvent, involatile sample by-products) on quan titative results. Matrix-induced chromatographic response enhancement see "enhancing matrix effect". Memory effect appearance of peaks arising from samples injected previously. Moving needle injection: solvent-free splitless injection by deposition of liquid samples on the tip of a needle at ambient temperature, evaporation of the solvent by a stream of carrier gas, and introduction of the needle into a vaporizing chamber to transfer the sol utes to the column. Needle rinse injection: determination of solute material remaining inside the syringe needle by sucking solvent into the syringe and injecting the needle washings. On-column injection: direct introduction of the sample liquid into the oven-thermostatted col umn inlet without a vaporization step in a separately heated chamber. Overflow technique: discharge of solvent vapor by expansion of the vapor (in contrast with vapor carried away by a gas stream). Partial solvent trapping: incomplete retention of a solute within the sample layer in the col umn inlet during solvent evaporation, causing peak deformation ofthe "chair" or "stool" type. Peak splitting: although there are numerous mechanisms resulting in splitting of peaks, "peak splitting" is often used synonymously with "band broadening in space". Phase soaking: solvent effect taking place in the coated column beyond the flooded inlet for solutes which are co-chromatographed with the solvent or another strongly overloading component; solute migration is slowed owing to swelling of the stationary phase. Press-fit connection: connection of capillaries by pressing a fused silica capillary into a ta pered seat of a (glass) connector, T-piece, widened glass capillary butt, or another ta pered seat. Pre-set split ratio: split ratio set by adjustment of the gas flow rates through the split outlet and into the column. Pressure wave: increase of pressure in the injector caused by rapid evaporation of the sample liquid. Programmed temperature vaporizing (PTV) injection: injection into a cool injector; the solute material is transferred into the column in split or splitless mode after rapid heating of the injector. Recondensation effect increase of the flow rate into the column inlet or the split outlet by recondensation of a substantial proportion of the injected sample material (mostly of the solvent), affecting the true split ratio and accelerating sample transfer into the column in splitless injection. Reducing matrix effect presence of matrix material in the solution injected reduces the peak area for a given amount of solute compared with a solution of standard in solvent (e.g. calibration solution); probably results from transfer to the liner wall in droplets of invola tile material.
Appendix 3
451
Retention gap: column inlet of low retentive power compared with the separation column, usually consisting of a deactivated but uncoated pre-column; used for reconcentration of solute bands broadened in space or for reduction of the effects of involatile sample by products. Sample transfer. transfer of the sample material from the vaporizing chamber into the col umn. Sandwich injection: the plug of sample liquid in the syringe is placed between plugs of sol vent, each separated from the sample plug by an air bubble. Septum purge: purge line leaving a vaporizing injector between the septum and the entrance of the carrier gas into the vaporizing chamber; a small flow of carrier gas through this exit removes septum bleed, or sample vapor which entered the septum area from the injector. Solid injection: injection of liquid samples involving removal of the solvent (and volatile sol utes) before transfer of the solute material of interest to the column (e.g. moving needle or solvent split PTV injection). Solvent effects: effects of the sample solvent or another strongly overloading component on the chromatography of the solutes (solvent trapping, phase soaking, band broadening in space). Solvent evaporation temperature: column temperature during evaporation of the sample sol vent within the flooded zone. Solvent evaporation time: time required for the sample solvent to evaporate from the flooded zone. Solvent flush injection: the syringe needle is filled with solvent, followed by an air bubble, before the sample liquid is picked up. Solvent split injection: injection technique involving use of a programmed temperature va porizing (PTV) injector. The sample solvent is evaporated and vented through the split exit at low injector temperature, followed by heating of the injector and splitless transfer of the solute material into the column. Solvent trapping: solvent effect describing the behavior of solutes during solvent evaporation within the flooded zone.
SPI: Septum-equipped temperature-programmable injector; PTV-like injector from Varian In struments. Split flow rate: carrier gas flow rate leaving the exit at the base of a vaporizing injector. To getherwith the column flow rate it determines the split ratio, but is also used to purge the vaporizing chamber after splitless injection. Split injection: injection under conditions causing a (usually relatively small) proportion ofthe sample vapor to enter the column and the main stream to leave through the split outlet. Splitless injection: injection technique resulting in almost complete transfer of the sample material into the column, involving a vaporizing injector also suitable for split injection; the split line is closed during sample transfer. Splitless period: period of time during which the split exit is closed for transferring the sample material into the column.
452
Appendix 3
Split line: outlet line at the base of the vaporizing chamber of a split/splitless injector, used for discharging sample material in split injection or purging the vaporizing chamber after splitless sample introduction. Split point zone in the vaporizing chamber around the column entrance where the sample vapor is divided into the portion entering the column and the portion purged through the split line. Split ratio: usually understood as pre-set split ratio: ratio of the carrier gas flow rates passing by the column and entering it before the injection is performed (adjusted split ratio). Static headspace analysis: analysis of volatile components in the gas phase above a sample after a single equilibration step. True split ratio: effective split ratio, calculated from the proportion of the solute material enter ing the column. Standard addition: method for quantitating solute concentrations or amounts by adding to the sample a known concentration or amount of the solutes of interest. The added mate rial corresponds to the difference between the peak areas or heights obtained from the analysis ofthe sample with and withoutthe added standard material. The concentrations or amounts are calculated therefrom. Terminal band length: column length over which the solute material is spread when reaching the end of the column. Thermospray injection: introduction of a liquid sample into the injector through a hot syringe needle causing the sample liquid to be sprayed at the needle exit; partially evaporated solvent acts as a propellant. Vapor overflow injection: solvent vapor leaves the vaporizing chamber by expansion as a result of its vapor pressure and because the volume of vapor exceeds that of the vaporiz ing chamber. Vaporizing chamber: volume in the liner of a vaporizing injector where sample evaporation is (or supposed to) take place. Wet needle injection: method for introducing very small volumes of liquid samples into va porizing injectors. The sample is withdrawn from the needle into the barrel ofthe syringe and the needle introduced into the injector without depressing the plunger (injection of the 30-80 nL of sample liquid coating the needle wall).
Subject Index
453
Subject Index (referring to the book only)
A Absorption in septum particles 95,425
Accuracy of sample volume 2, 57
Acoustic flow meters 159
Addition of standards, use of 10 ~L syringes
12 '
Adsorption
effect of contaminants 368
in syringe needle 45
in vaporizing chamber 129, 130, 132,
135,222,316
on glass wool 236
Adsorption suppressors 46
Aerosol formation 88, 115, 229
Air plug, solvent flush injection 32 33
Air, effect on column, solutes, ECO' 39
Air plug injection 23,37,448
Alcoholic beverages 248
Amino acids 174
Aqueous samples 365
Autosamplers 429, 448
fast autosamplers 4, 62, 232, 412, 429
B Back diffusion from vaporizing chamber 273
Backpressure regulator 152,435
Band broadening
avoidance 339,350,365
basic description 334,335,337,357
distinction of effects 334
in space 303,377,448
in time 334,448
Band formation 62,72,83,88, 116,414,448
Band widths in space and time 164
Baseline problems 344, 368
Batching oil, jute bags 289
Benzene in gasoline 212
Beveled needle tip 10
Bleed from ferrule of column attachment 345
Boiling points of some components 109
Brominated alkanes 128
Buffer volume in split outlet 201,420
Butt connector 448
c Calibration, problems of 209,224,237,316,
323
Capacities of standard capillary columns
150,448
Carbamate insecticides 126
Carbofrit 103
Carrier gas control
CE Instruments TRACE 439
HP 6890 437
Carrier gas flow rates
at different inlet pressures 302
dependence on oven temperature 156
split injection 183, 189
splitless transfer 295, 298
Carrier gas overnight? 142
Charcoal filters in the split outlet 201,422
439 '
Charcoal traps to avoid ghost peaks 350
Charge separation during thermos pray 114
Chemical stability of deactivation 367
Chlor~nated benzenes and biphenyls 393
Chlorinated pesticides in edible oils 391
Chloroalkanes 128
Chlorohydrin 127
Cholesterol 136.329
Christmas tree effect 172
ChromatoProbe 387
Cleaning
injector liners 143
454
Subject Index
syringes 12
Closure of the septum purge 278
Cognac 222
Cold trapping 336, 339, 375, 448
Column Flow Rate
at different inlet pressures 302
dependence on oven temperature 156
split injection 183, 189
splitless transfer 295, 298
Column installation 410
Column packing material for packed liners
103
Column temperature during injection 447
split injection 198, 204
splitless injection 341,351,375
Column-labile compounds 123
Comparison of injection techniques 126,251,
291,395
Concentrated samples 185
Concentration of vapor in the carrier gas 204
Concentration per component suitable
for split injection 163,445
for splitless injection 445
Concurrent solvent evaporation 448
Conditioning of columns 368
Conical style needles 10,84
Contaminants
acting as retaining stationary phase 132
evaporation from 19, 112,323
retention in injector 114
retention in precolumn 368
Contaminated carrier gas 347
Contamination
of column inlet 114, 229
of column outlet 344
Conversion of gas velocity into flow rates
160
Cool (cold) needle injection 23, 28, 448
Cooling of the injector by sample evapora
tion 74
Cup or "Jennings" liner 96, 244
Cycloliner 98
D DC-200 simulating contaminants 323
DDT 136
Deactivation
by sample material 131,141,222,316
by silytation 138, 140
by stationary phase 140
of glass and quartz wool 133, 140
of liners 133, 138
of uncoated precolumns 367
Dead time 448
Deformation
of needle tip 84
of syringe plunger 7
Degradation of solutes
countermeasures against 125
in injector 128, 135,316
in injector or column? 122
in precolumn 368
in syringe needle 4, 31
mechanisms of 124
of endrin 299
testing of injector activity 134
Degraded contaminants from injector 265,
348
Deposition on surfaces 73, 121
Depression of the plunger 174
Detector block 345
Determination of
column flow rate 157
enzyme activity 174
injector activity 134
injector capacity 270
injector overflow 272
losses in the needle 24
split ratio 156
Deviation from the pre-set split ratio 202
Dew point ofthe gas/vapor mixture 108, 111,
200,354
Diameters of syringe needles 10
Diffusion in the injector 297,312
Diffusion speeds, non-linear splitting 214
Dilution in the injector 109, 118, 178,274,
408
Dimethoate 45
Dioctyl phthalate 375
Dioctyl sebacate 329
Direct injection 379,448
Direct sample introduction 386
Discrimination effects 425,448
split injection 154,213
splitless injection 267,315,392
syringe needle 3,26,41,42,47,51
Distortion of solvent peak 263,265,346,417,
419
Divinylcyclobutane 126
Drifting baseline 368
Duration of
pressure pulse for splitless transfer 302
solute evaporation 206
Subject Index solvent evaporation 75, 77, 105,283
splitless period 264,294,298,312,339,
447
Dynamic headspace analysis 176, 449
E Early vapor exit 289
ECDs, effect of air 39
Effect of injecting air 38
Ejection from syringe needle 18
Electronic flow and pressure regulation 279,
298,412,424
reaction to pressure wave 439
Electronic flow meter 159
Elution temperature 449
End face ofthe column 216
Endrin 134
Enhancing matrix effect 238,300,316,449
Evaluation of GC instruments 55 .
Evaporation from surfaces (packings) 96,
116,222,231,414
Evaporation in gas phase 87,107,226,414
Evaporation inside syringe needle 15, 446
Expansion of the sample vapor 195,269,421
External standard method 210, 328, 331,
449
F Fast autosampler 232,412,429
avoiding evaporation in syringe needle
4,62
resulting in band formation 62,83
Fast GC 172, 308, 409
examples 174
Fat as sample impurity 371
Fatty acid methyl esters 208, 245
Fatty acid silyl ester 136
Ferrule between liner and injector body 416
Fifteen degree rule 340, 449
Filled needle injection 22, 26, 449
Filters in the split outlet 201,422,439
Flash evaporation 87,226,449
Flavor components 238
Flooded zone 334, 353, 449
Flooding process 351,357
Flow meters
electronic 159
with floating particle 161
soap bubble meter 158
Flow/backpressure regulation 424
455
split injection 152, 197
splitless injection 263
regulation systems 435, 437
Fluctuating split ratio 207,220,247,449
Full solvent trapping 350, 449
Fused silica, cutting of 372
Fused silica wool, see "Glass wool
G Gaseous samples 251
Gas hold-up time 449
Gas regulation systems 151, 196,263,431,
437
Gas syringes for headspace analysis 10
Ghost peaks 384,418,449
from degraded sample by-products 237
from liner packing 140, 237
from septum material 265, 425
search for 344, 346,
Glass bead liner 98
Glass capillary columns 138
Glass frits 102
Glass wool 101,118,136,140
filtering out nebulized matrix 115
improving evaporation 112
split injection 235, 246, 249, 250
splitless injection 284,332
Goose neck liner 93, 95, 411
Graphite ferrules 418,419
H Headspace analysis 10,39, 176,251,377,
449
Heat
for solvent evaporation 71, 73
from liner wall 75
Heat capacity
of glass 74
of hydrogen 74
Heating ofthe injector 50,53,414,427
overnight and at weekends 142
Herbicide analysis 242
High-boiling sample solvents 36, 59, 239,
242,378
High-boiling samples 239
Historic background
split Injection 152
splitless injection 257
Homogenization of vapor across the liner
227,243
456
Subject Index
Hot needle injection 23,29,227,231,449
Hump eluted after the solvent peak 346
Hydroxylated PCBs 300
I
Incomplete sample evaporation 70,93,217,
200,236
Influence of
initial band width on final peak width
170
liner diameter on sample transfer 296
vapor viscosity on discrimination 230
Initial band 150
effect on peak width 169
length 449
shape, splitless injection 334, 338, 360
width 151,164,449
Injection of large volumes
splitless overflow 282
direct injection 382
Injection point 182
Injection speed 46
autosamplers 430
discrimination 28
fast analysis 173
splitless injection 280
Injector design 149,405,407
for splitless overflow 287
direct injection 379
Injector temperature 47,106,121,228,250,
322,446
Injector-internal headspace analysis 388
Injector-labile substances 122
Insert: also injector insert or liner 449
Internal diameter of vaporizing chamber 447
for split injection 181, 182,202,206,409
for splitless injection 273,296,309,312,
408
Internal standard method 209,329,331,449
Interpretations of "sample volume" 20
Inverted cup liner 97
Iodine experiment 117,292
Isokinetic splitting 215
J Jade valve 278
L
Laminar liner 99, 244
Leaching of silica 138
Leak through septum
after cooling of injector 56
dependence on needle style 10
effect depending on gas regulation 423
Length of
contaminated column inlet 370
flooded zone 361
initial bands 337
injector liner (vaporizing chamber) 408,
413
syringe needle 60, 446
split injection 167,183,190,202,
228,234,250
splitless injection 274,407,414
uncoated precolumn 367
Linear gas velocity 160,215,312
Linearity of splitting 213,248,450
Liner diameter, see "Internal diameter of
vaporizing chambers"
Liner types 450
baffles 96, 246
constriction at bottom 93,95,216
constriction at top ("goose neck") 277
cup 96,244,245
cycloliner 98
for injectors longer than 80 mm 410
glass bead 98
glass frit 102
laminar 99,244
Losses through septum purge 266
M
Manometers 434
Matrix effect 113,114,210,229,237,450
elution from the syringe needle 20
enhancing 238,300,316,449
in PTV injection 397
reducing 239,323,450
Matrix-induced chromatographic response
enhancement 450
Matrix-matching standard solutions 321
Matrix material as contaminants 114,368
Maximum peak height 167
Maximum sensitivity, split injection 176
Maximum tolerable initial band widths 169,
173
Measurement of
evaporation time 80
gas pressure inside injector 434
temperature drop 79
see also "Determination of.. ."
Subject Index Mechanical
flow/backpressure regulation 263,435
pressure regulation/flow restriction 262,
431
spray effect 84
Mechanisms of solute degradation 124,125
Memory effects 11,268,348,450
Merlin microseal 427
Message from standard deviations 193
Message to a lawyer 394
Metal liner 99
Metal surface at base of injector 93, 128
Methane peaks 168,337,339
Method of standard addition 177,209,331,
452
Micro-pentane extraction 375
Minimum flow rate, splitless injection 296
Minimum split flow rate 170
Mixing with carrier gas 74,227,244,276
Moving needle injection 385,450
Mustard oils 31, 127
N Narrow bore columns 172, 189,308
Nebulization of sample liquid 72, 87, 90
limits to 85
Needles, see "Syringe needles"
Needle
rinse injection 24, 450
dwell time 62
valve 262
Non-linearity of the response 130
Non-wetting samples 364, 365
o Observation of
initial band shapes 337
sample evaporation 81,352,359
On-column injection 360,376,381,395,446,
450
into detached column inlet 308
One-microliter syringes 9, 57, 188
Optimized split flow rate 177
Organochlorine pesticides 319
Organophosphorus pesticides 299,319,391
Overflow technique 282,450
Overheated column outlet 345
Overlapping chromatograms 175
Oxidized sample 39
Oxygenated dibenzothiophenes 127
457
p Packed liners 233
column packings 103, 140
see also "Glass wool"
Partial solvent trapping 61,353,376,377,
450
Partial vapor pressure 108
Particles attracted to liner wall 229
Particles driven into column 371
Peak broadening and distortion 334,361,368
effect of splitting on 169
for peaks eluted before solvent 242
solute degradation 123
splitting 450
Perylene 81,359
Pesticide analysis 299,319,372,387,391
Phase soaking 450
extra-retention times 356
Phase stripping 343, 353
Phenols 134
Phesil surfaces 139
Plugged syringe needles 14
Plunger guides 7
Plunger-in-barrel syringes 6
Plunger-in-needle syringes 9,57, 188
Plungers 6, 183
Pneumatic system
HP 6890 instrument 437
CE Instruments TRACE 439
for large injection by splitless overflow
287
Polyimide seal, press-fit 372
Polynuclear aromatic compounds 235,330
~2 ' Poor reproducibility 4,204, 219
of absolute peak areas 200
Position of column entrance 167,182,407,
410
Pre-evacuated injectors? 278
Pre-heating of carrier gas 186
Pre-peaks, hot needle injection 31
Pre-separation of solutes in the injector 221
Pre-set split ratio 194,450
Precolumn solvent splitting 289
Precolumns
uncoated 365,367
for contaminated samples 368
with thin film of stationary phase 372,
390
Press-fit connection 372,450
additional tightening 374
458
Subject Index
testing for tightness 373
Pressure and flow programming 412
Pressure increase, volumes around chamber
420
Pressure increase during splitless injection 279,298,412 Pressure pulse 279,298,412 Pressure regulator/flow restriction system 151,197,431,438
Pressure regulators 432
Pressure wave, split injection 195,205,220,
273,450
Prevention of aerosol formation 116
Priming ofthe injector and column 141,231,
320
Programmed temperature vaporizing (PTV)
injection 253,396, 445,450
Proportional valves 437
Purge exit 390
Purging injector after a splitless injection
263,265 Q
Quantitation on basis of pre-set split ratio 209
Quantitative results 394
obtained by split injection 153,251
obtained by splitless injection 313,391
R
Random deviations 193
Raw fused silica wool 136
Re-using press-fit connectors 373
Reconcentration of initial bands 259,334
by cold trapping 171,340
by solvent effects 171, 350
by bands broadened in space 366
Recondensation in the column inlet 450
split injection 198,220,249
splitless injection 261,275,351
Reducing matrix effect 239,323,450
Removable needles 11, 47
Removal of the contaminated inlet 368
Reproduction of absolute retention times
343,356 Reproducibility of
absolute peak areas 200
quantitative results 4,29,204,219,329,
332
Repulsion of liquid from hot surface 91
Resistance in split line 186
Retention gap technique 337,365,382,451
Retention power in the injector 132,222,316
Retention power of a surface 119
Retention times 433
influence of solvent effects 356
Reversed split flow 422
5
Sample clean-up 396
Sample evaporation 174
effects if incomplete 70,93,217, 2QO,
236
in the needle 2, 15,59
in the injector 63,69,93,200,217
Sample matrix, importance of 211,224
see also "Matrix effects"
Sample transfer into column 292,451
accelerated by pressure increase 298
accelerated by solvent recondensation
304
as aerosol 88, 115, 229
Sample volume 36,41,42,228,446
adjustment to liner volume 179
for gaseous samples 179
for splitless injection 269
Sandwich injection 23,37,46,451
Seal between liner and injector body? 416
Selection of the internal standard 327
Semivolatiles in cigarette smoke 376
Separation of liquid from needle tip 187,240
Septum 348, 423, 426
bleed 141,349,424
particles 94, 95, 424
thermostability of 55
tightening of 56,426
Septum purge 265,424,441,451
flow rates 265, 442
Shrinkable PTFE tubing 381
Silylating the syringe? 46
Silylation
of glass and quartz wool 133, 140
of liners 133, 138
of uncoated precolumns 367
reagents 12
Slow carrier gas: nitrogen 189
Slow injection? 23,28,280
Soap bubble flow meters 158
Solid injection 385,451
Solid phase micro extraction (SPME) 310
Subject Index Solute concentration in the injector 110
Solute evaporation 106
Solvent
damaging the column? 385
diverting column 289
evaporation 43,71,81,282,269
flush injection 23,32,451
peak, distortion of 263,265,346,417,
419
residues in pharmaceuticals 377
split injection 451
Solvent effects 261,350,375,451
at elevated column temperatures 378
on response factors? 276
Solvent recondensation
accentuated by pressure increase 303
split injection 198,220,249
splitless injection 261,275,351
split outlet 200
Solvent trapping 350,449,451
effect on retention times 356
mechanism 351
Sources of heat for solvent evaporation 73
Speed of evaporation, n-alkanes 120
Speed of sample liquid 72
SPI 451
Split
injection 149,171,451
outlet line 149, 200, 452
point 149,452
Split flow rate 150, 168,451
adjustment of 161
maximum 186
Split ratio 155, 177, 185,452
changes during injection 221
commonly applied 163
problems concerning 192
Splitless injection 35,257,445,451
Splitless period 451
Standard addition 177, 209, 331, 452
Static headspace analysis 176, 452
Stationary phase focusing 339
Stigmasterol in olive oil 326
Stop flow split injection 230
Syringe cleaners 13
Syringe needle handling 22
Syringe needles 9
attachment 47
for autosamplers 10
preheating 430
tip 10
with sideport hole 10, 183,240,389
459
Systematic errors 192, 193, 223, 225, 229,
317,329
T Temperature drop during injection 79
Temperature gradient
column attachment zone 358
towards septum 48, 52
Temperature profile through the injector 51,
428
Tenax TA, vapor overflow 285
Terminal band length 362, 452
Testing
completeness of sample transfer 306
inertness of injector 134
elution from syringe needle 24, 450
Tetrachloroethylene 211,212,375
Thermal capacity of syringe needle 85
Thermal conductivities of gases 76
Thermal focusing 339
Thermospray injection 84,87,107,121,227,
414,452
Thickness of needle wall 86
Thioglycollic acid 212
lightening septum cap 56,426
lightness of syringe plunger 7
lime for sample evaporation 71
Toxic substances, retention in split outlet 439
Transparent injector 82
Triazine herbicides 288
Triglycerides 44
air as carrier gas, 39
in the sample matrix 325, 329
passing through precolumn 371
True split ratio 194,452
u Uncoated pre-columns 365
as waste bin 368
Undiluted samples 185, 217
v
Valve to prevent backflow 278, 383
Vapor
concentration in the injector 179
overflow injection 282, 452
pressure of solutes 107
Variation of the split ratio 220
Video taping 81
460
Subject Index
Viscosity of sample vapor 201, 440 Viscous sample liquids 186 Visual observation of sample evaporation 81 Viton 420 Volatility of the solvent 44, 204 Volume around the vaporizing chamber 280, 420 of solvent vapor, calculated 269 of vaporizing chamber 181,273,311, 410,414
w Wax esters 371 Wet needle injection 23, 188,452 Wettability of liners 139 stationary phases 364 Williams distillate 249