Polymer Spectroscopy Edited by
ALLAN H. FAWCETT The Queens University of Belfast, Belfast, Northern Ireland, UK
JOHN W...
155 downloads
1292 Views
17MB Size
Report
This content was uploaded by our users and we assume good faith they have the permission to share this book. If you own the copyright to this book and it is wrongfully on our website, we offer a simple DMCA procedure to remove your content from our site. Start by pressing the button below!
Report copyright / DMCA form
Polymer Spectroscopy Edited by
ALLAN H. FAWCETT The Queens University of Belfast, Belfast, Northern Ireland, UK
JOHN WILEY & SONS Chichester • New York • Brisbane • Toronto • Singapore
Copyright © 1996 by John Wiley & Sons Ltd, Baffins Lane, Chichester, West Sussex PO19 IUD, England National International
01243779777 (+44) 1243 779777
All rights reserved. No part of this book may be reproduced by any means, or transmitted, or translated into a machine language without the written permission of the publisher. Other Wiley Editorial Offices John Wiley & Sons, Inc., 605 Third Avenue, New York, NY 10158-0012, USA Jacaranda Wiley Ltd, 33 Park Road, Milton, Queensland 4064, Australia John Wiley & Sons (Canada) Ltd, 22 Worcester Road, Rexdale, Ontario M9W ILl, Canada John Wiley & Sons (SEA) Pte Ltd, 37 Jalan Pemimpin #05-04, Block B, Union Industrial Building, Singapore 2057
British Library Cataloguing in Publication Data A catalogue record for this book is available from the British Library ISBNO 471960292 Typeset in 10/12pt Times by Thomson Press (India) Ltd, New Delhi Printed and bound by Antony Rowe Ltd, Eastbourne This book is printed on acid-free paper responsibly manufactured from sustainable forestation, for which at least two trees are planted for each one used for paper production.
LIST OF CONTRIBUTORS
Gordon G. Cameron Department of Chemistry, University of Aberdeen, Meeston Walk, Old Aberdeen AB92UE, Scotland, UK Michelle Carey Department of Chemistry, Imperial College of Science, Technology and Medicine, South Kensington, London SWl'2AY, UK Trudy G. Carswell Chemistry Department, University of Queensland, Brisbane, QLD 4072, Australia Francesco Ciardelli Dipartimento di Chimica e Chimica Industriale, Universita of Pisa, Via Risorgimento 35, 56126 Pisa, Italy Iain G. Davidson Department of Chemistry, University of Aberdeen, Meeston Walk, Old Aberdeen AB9 2UE, Scotland, UK Christine Duch Chemistry Department, University of Wales, Swansea, Singleton Park, Swansea SA2 8PP, Wales, UK Allan H. Fawcett School of Chemistry, The Queen's University of Belfast, Belfast BT95AG, Northern Ireland, UK Adriano Fissi, CNR Institute of Biophysics, University of Pisa, Via Risorgimento 35,56126 Pisa, Italy Jerome Fournier Chemistry Department, University of Wales, Swansea, Singleton Park, Swansea SA2 8PP, Wales, UK R. Wayne Garrett Chemistry Department, University of Queensland, Brisbane, QLD 4072, Australia J. G. Hamilton School of Chemistry, The Queens University of Belfast, Belfast BT95AG, Northern Ireland, UK
Robin K. Harris Department of Chemistry, University of Durham, Science Laboratories, South Road, Durham DHl 3LE, UK James R. Hayden Chemistry Department, University of Wales, Swansea, Singleton Park, Swansea SA28PP,Wales,UK Patrick J. Hendra Department of Chemistry, University of Southampton, Highfield, Southampton SO95NH, UK Ian R. Herbert Department of Chemistry, University of Durham, Science Laboratories, South Road, Durham DHl 3LE, UK David J. T. Hill Chemistry Department, University of Queensland, Brisbane, QLD 4072, Australia Oliver W. Howarth Centre for Nuclear Magnetic Resonance, Department of Chemistry, University of Warwick, Coventry CV4IAL, UK Roger N. Ibbett Department of Chemistry, University of Durham, Science Laboratories, South Road, Durham DHl 3LE, UK Jack L. Koenig Department of Macromolecular Science, Case Western Reserve University, 10900 Euclid Avenue, Cleveland, OH 44106-7202, USA
W.F.Maddams, Department of Chemistry, University of Southampton, Highfield, Southampton SO95NH,UK James H. O'Donnell Chemistry Department, University of Queensland, Brisbane, QLD 4072, Australia (Deceased) David Phillips Department of Chemistry, Imperial College of Science, Technology and Medicine, South Kensington, London SW72AY, UK Osvaldo Pieroni Dipartimento di Chimica e Chimica Industriale, and CNR, Institute of Biophysics, Universita di Pisa, Via Risorgimemto 35, 56126 Pisa, Italy Peter J. Pomery Chemistry Department, University of Queensland, Brisbane, QLD 4072, Australia
Adrian R. Rennie Polymers and Colloids Group, Cavendish Laboratory, University of Cambridge, Madingley Road, Cambridge CB3 OHE, UK R. W. Richards Department of Chemistry, University of Durham, Durham DHl 3LE, UK J. J. Rooney School of Chemistry, The Queen's University of Belfast, Belfast BT9 5AG, Northern Ireland, UK
H.W.Spiess Max-Planck-Institute Germany
fur Polymerforschung, Postfach 3148, D-55021 Mainz,
Alan E. Tonelli Fiber and Polymer Science Program, College of Textiles, North Carolina State University, PO Box 8301, Raleigh, NC 27695-8301, USA Graham Williams Chemistry Department, University of Wales, Swansea, Singleton Park, Swansea SA2 8PP, Wales, UK Mark A. Whiskens Department of Chemistry, University of Durham, Science Laboratories, South Road, Durham DHl 3LE, UK Catherine L. Winzor Chemistry of Department University of Queensland, Brisbane, QLD 4072, Australia Robert J. Young Manchester Materials Science Centre, University of Manchester, Grosvenor Street, Manchester Ml 7HS, UK
Contents
List of Contributors .............................................................
xiii
Introduction to Polymer Spectroscopy ..........................
1
1. NMR Characterisation of Macromolecules in Solution .......................................................................
7
1.1
Introduction ...................................................................
7
1.2
Branched Molecules: Polyethylene and a Polyester System ..........................................................
9
1.3
The Microstructure of Linear Chains ............................
15
1.4
The Participation of a Charge-Transfer Complex in a Free Radical Polymerization Reaction ......................
22
1.5
The Polymerization of Dienes ......................................
25
1.6
Ring-Opening-Metathesis Polymerizations ..................
30
1.6.1
Stereoselectivity in ROMP .........................
32
1.6.2
Distribution of trans Double Bonds in High cis Poly(Norbornene) .........................
36
1.6.3
Regioselectivity in ROMP ..........................
41
1.6.4
Direct Observation of Tacticity ...................
45
References ...................................................................
52
2. Conformation: the Connection between the NMR Spectra and the Microstructures of Polymers .........
55
1.7
2.1 2.2
Introduction ................................................................... 13
Substituent Effects on C Chemical Shifts .................. This page has been reformatted by Knovel to provide easier navigation.
55 56
v
vi
Contents 2.3 2.4
2.5
γ-Gauche Effect Method of Predicting NMR Chemical Shifts .............................................................
60
Applications of γ-Gauche Effect Analysis of Polymer Microstructures ...............................................
64
2.4.1
Polypropylene (PP) ....................................
64
2.4.2
Propylene-Vinyl Chloride Copolymers (P-VC) ........................................................
67
2.4.3
Poly(Propylene Oxide) (PPO) ....................
68
2.4.4
Poly(Vinylidene Fluoride) (PVF2) ................
81
NMR Spectroscopy as a Means to Probe Polymer Conformations ..............................................................
84
2.5.1
Styrene-Methyl Methacrylate Copolymers (S-MM) ...................................
84
Ethylene-Vinyl Acetate (E-VAc) Copolymers ................................................
88
NMR Observation of Rigid Polymer Conformations ..............................................................
92
References ...................................................................
93
3. ‘Model-Free’ RIS Statistical Weight Parameters from 13C NMR Data .....................................................
97
2.5.2 2.6 2.7
3.1
Introduction ...................................................................
3.2
Methods ........................................................................ 100
3.3
Some Calculation Details ............................................. 101
3.4
Individual Polymers ...................................................... 102
3.5
The Calculated RIS Parameters .................................. 109
3.6
β-Gauche Effects .......................................................... 111
3.7
Coupling Constants ...................................................... 111
3.8
Characteristic Ratios .................................................... 113
3.9
Conclusions .................................................................. 114 This page has been reformatted by Knovel to provide easier navigation.
97
Contents
vii
3.10
Acknowledgement ........................................................ 115
3.11
References ................................................................... 115
4. NMR Studies of Solid Polymers ................................ 117 4.1
Introduction ................................................................... 117
4.2
The Techniques ............................................................ 118
4.3
High-Resolution Carbon-13 NMR of Polymers ............ 121
4.4
Proton Spin Relaxation ................................................. 125
4.5
Discrimination in Carbon-13 Spectra ........................... 128
4.6
Spectra of Abundant Spins ........................................... 131
4.7
Conclusion .................................................................... 132
4.8
Acknowledgements ...................................................... 132
4.9
References ................................................................... 133
5. Multidimensional Solid-State NMR of Polymers ...... 135 5.1
Introduction ................................................................... 135
5.2
Multidimensional Solid-State NMR Spectra ................. 137
5.3
Examples ...................................................................... 138 5.3.1
Increase of Spectral Resolution ................. 138
5.3.2
Separated Local Field NMR ....................... 140
5.3.3
Wideline Separation Experiments .............. 141
5.3.4
2D and 3D Exchange NMR ........................ 142
5.3.5
Chain Alignment from 2D and 3D NMR ...... 144
5.3.6
Domain Sizes from Spin Diffusion Experiments ............................................... 146
5.3.7
Spatially Resolved Solid State NMR .......... 146
5.4
Conclusion .................................................................... 148
5.5
Acknowledgements ...................................................... 149
5.6
References ................................................................... 149 This page has been reformatted by Knovel to provide easier navigation.
viii
Contents
6. NMR Imaging of Polymers ......................................... 151 6.1
6.2
Introduction ................................................................... 151 6.1.1
Basis of NMR Imaging ............................... 151
6.1.2
Relaxation Parameters in NMR Imaging .... 153
6.1.3
Resolution in NMR Imaging ....................... 155
6.1.4
Utility of NMRI ............................................ 155
6.1.5
Image Processing ...................................... 156
Advanced Imaging Techniques .................................... 156 6.2.1
6.3
Chemical Shift Imaging .............................. 156
Applications of NMRI to Polymers ................................ 159 6.3.1
Detection of Voids in Composites .............. 159
6.3.2
Detection of Nonuniform Dispersion of Filler ........................................................... 161
6.3.3
NMRI of Physical Aging ............................. 161
6.3.4
NMRI Studies of Diffusion in Polymers ...... 162
6.3.5
Desorption of Liquids from Polymers ......... 165
6.3.6
Multicomponent Diffusion as Studied by NMRI ......................................................... 167
6.3.7
Absorption-Desorption Cycling of Liquids in Polymers .................................... 169
6.4
Acknowledgements ...................................................... 171
6.5
References ................................................................... 171
7. Fourier Transform Infrared and Raman Spectroscopies in the Study of Polymer Orientation .................................................................. 173 7.1
Introduction ................................................................... 173 7.1.1
The Basis of Orientation Measurements by Infrared Spectroscopy ........................... 174
This page has been reformatted by Knovel to provide easier navigation.
Contents 7.1.2 7.2
7.3
ix
The Basis of Orientation Measurements by Raman Spectroscopy ............................ 176
........................................................................................ 177 7.2.1
Experimental Techniques on Static Samples ..................................................... 177
7.2.2
Infrared Spectroscopic Studies on Oriented Polymers ..................................... 180
7.2.3
Raman Spectroscopic Studies on Oriented Polymers ..................................... 182
Time Resolved Measurements .................................... 185 7.3.1
The Response of a Viscoelastic System to Sinusoidal Stress ................................... 185
7.3.2
Experimental .............................................. 187
7.3.3
Some Examples of Dynamic Linear Dichroic Infrared Studies ............................ 192
7.4
Elastomers Under Stress ............................................. 198
7.5
Conclusion .................................................................... 200
7.6
References ................................................................... 201
8. Deformation Studies of Polymers using Raman Spectroscopy ............................................................. 203 8.1
8.2
8.3
Introduction ................................................................... 203 8.1.1
Polydiacetylene Single Crystals ................. 204
8.1.2
Extension of the Technique to Other Materials .................................................... 206
High-Performance Polymer Fibres ............................... 206 8.2.1
Aromatic Polyamide Fibres ........................ 206
8.2.2
Polyethylene Fibres ................................... 210
Isotropic Polymers ........................................................ 214 8.3.1
Urethane-Diacetylene Copolymers ............ 214
This page has been reformatted by Knovel to provide easier navigation.
x
Contents 8.3.2 8.4
Deformation Studies .................................. 217
Composites ................................................................... 221 8.4.1
Single-Fibre Composites ............................ 221
8.4.2
Interfacial Micromechanics ......................... 224
8.5
Conclusions .................................................................. 227
8.6
Acknowledgements ...................................................... 228
8.7
References ................................................................... 228
9. Spin-Label Studies of Heterogeneous Polymer Systems ...................................................................... 231 9.1
Introduction ................................................................... 231 9.1.1
9.2
Synthesis of Spin Labels ............................ 232
Theoretical Background ............................................... 235 9.2.1
9.2.2
Correlation Times ...................................... 235 9.2.1.1
Fast Motion ................................... 239
9.2.1.2
Slow Motion ................................... 240
The Glass Transition and T50G ................... 240
9.3
Heterogeneous Systems .............................................. 242
9.4
Polymer Blends ............................................................. 245
9.5
References ................................................................... 251
10. The Use of ESR Spectroscopy for Studying Polymerization and Polymer Degradation Reactions .................................................................... 253 10.1
Introduction ................................................................... 253
10.2
Experimental ................................................................. 254
10.3
Results and Discussion ................................................ 255 10.3.1 Free Radical Polymerization ...................... 255 10.3.1.1 Identification of the Radicals in the ESR Spectrum ........................ 255
This page has been reformatted by Knovel to provide easier navigation.
Contents
xi
10.3.1.2 Measurement of Radical Concentration ................................ 256 10.3.1.3 Monomer Concentration during Polymerization ............................... 256 10.3.1.4 Radical Concentration during Polymerization ............................... 257 10.3.1.5 Correction for Changing Sensitivity of the Spectrometer ..... 259 10.3.1.6 Kinetic Analysis ............................. 260 10.3.1.7 Crosslinking Methacrylate Monomers ..................................... 261 10.3.2 Polymer Degradation by High-Energy Radiation ................................................... 263 10.3.2.1 Poly(Methyl Methacrylate) ............. 263 10.3.2.2 Polystyrene ................................... 267 10.3.2.3 Random Copolymers of Methyl Methacrylate and Styrene ............. 268 10.3.2.4 ESR and the Mechanism of Radiolysis ...................................... 269 10.4
Conclusions .................................................................. 273
10.5
Acknowledgements ...................................................... 273
10.6
References ................................................................... 273
11. Dynamics of Bulk Polymers and Polymerizing Systems as Studied Using Dielectric Relaxation Spectroscopy ............................................................. 275 11.1
Introduction ................................................................... 275
11.2
Amorphous Polymers: Phenomenological and Molecular Aspects ........................................................ 276
11.3
Crystalline Polymers ..................................................... 280
This page has been reformatted by Knovel to provide easier navigation.
xii
Contents 11.4
Liquid Crystalline (LC) Polymers .................................. 282
11.5
Real-Time Studies of Chemical and Physical Changes ....................................................................... 288
11.6
Conclusions and Future Prospects .............................. 293
11.7
Acknowledgements ...................................................... 294
11.8
References ................................................................... 294
12. Light Scattering from Polymer Systems .................. 297 12.1
Introduction ................................................................... 297
12.2
Small Angle Light Scattering (SALS) ........................... 298 12.2.1 Semi-Crystalline Polymers ......................... 298 12.2.2 Phase-Separating Polymer Mixtures .......... 305
12.3
Quasi-Elastic Light Scattering (QELS) ......................... 309 12.3.1 Dilute Polymer Solutions ............................ 309 12.3.2 Gels ........................................................... 311 12.3.3 Semi-Dilute Solutions and Trapped Chains ....................................................... 313 12.3.4 Surface Quasi-Elastic Light Scattering (SQELS) .................................................... 316
12.4
Conclusions .................................................................. 321
12.5
References ................................................................... 321
13. Neutron Scattering from Polymers ........................... 325 13.1
Introduction ................................................................... 325
13.2
The Principles of Neutron Scattering ........................... 325
13.3
Neutron Experiments .................................................... 329 13.3.1 Studies of Polymer Dimensions: Small Angle Scattering ........................................ 330 13.3.2 Polymers at Surfaces-Reflection ................ 333
This page has been reformatted by Knovel to provide easier navigation.
Contents
xiii
13.3.3 Polymer Dynamics-Quasi-Elastic Scattering .................................................. 334 13.4
Some Examples of Recent Progress ........................... 336 13.4.1 Studies of Copolymers ............................... 336 13.4.2 Adsorption at Surfaces ............................... 339 13.4.3 Kinetics and Polymer Motion ...................... 341
13.5
Final Remarks ............................................................... 342
13.6
References ................................................................... 342
14. Optical Activity and the Structure of Macromolecules ......................................................... 347 14.1
Introduction ................................................................... 347 14.1.1 Origin of Optical Activity in Macromolecules ......................................... 347 14.1.2 Objective .................................................... 350
14.2
Chiroptical Properties of Photochromic Polypeptides ................................................................. 351 14.2.1 Polypeptides Photoresponsive to UV Light ........................................................... 351 14.2.1.1 Azobenzene-Containing Polypeptides .................................. 351 14.2.1.2 Light-Induced Conformational Changes ........................................ 352 14.2.1.3 Photosimulated AggregationDisaggregation Effects .................. 355 14.2.2 Photomodulation of Polypeptide Conformation by Sunlight ........................... 357 14.2.2.1 Spiropyran-Containing Polypeptides .................................. 357
This page has been reformatted by Knovel to provide easier navigation.
xiv
Contents 14.2.2.2 Photomodulation of Conformation ................................. 360 14.2.2.3 Photoinduced Variations of Viscosity ........................................ 366 14.3
References ................................................................... 367
15. Polymer Luminescence and Photophysics ............. 369 15.1
Introduction ................................................................... 369
15.2
Probes of Order in Polymers ........................................ 370
15.3
Probes of Sub-Group Motions ...................................... 372
15.4
Photochemistry in Polymers ......................................... 372
15.5
Excimer-Forming Polymers .......................................... 374
15.6
Dynamics of Luminescence ......................................... 376
15.7
Fluorescence Decay in Vinyl Aromatic Polymers ........ 377 15.7.1 Diffusional Models ..................................... 379 15.7.1.1 Random Walk Migration, Evenly Spaced Chromophores ................. 380 15.7.1.2 Random Water, Random Distribution Chromophores ........... 380 15.7.1.3 Multiple Trap Energies .................. 381 15.7.1.4 Reversible Excimer Formation ...... 381 15.7.1.5 Diffusion of Energy and Chromophore ................................ 381 15.7.1.6 Fluorescence Anisotrophy Measurements .............................. 385
15.8
Conclusion .................................................................... 387
15.9
Acknowledgements ...................................................... 388
15.10 References ................................................................... 388
Index .................................................................................. 391 This page has been reformatted by Knovel to provide easier navigation.
INTRODUCTION TO POLYMER SPECTROSCOPY A. H. FAWCETT
The Queen's University of Belfast
Historically there was a difficulty in dealing with macromolecules that was simply the realisation of their large size; the organic chemist's early painstaking methodology for isolating, studying and recognising the readily obtained small natural product molecule did not lend itself to the examination of many natural macromolecules such as cellulose and rubber. Such chemists, used to identifying their substances by the melting point complemented by similar studies on the derivatives and then the slow construction of the molecule by use of a developing repertoire of piecemeal reactions, were slow to accept how readily high polymers might be man-made by a simple but powerful repetitive process. Ancient practices and evolving technology might utilise materials such as wood, leather, silk and cotton, but the true macromolecular nature of these materials was not appreciated until about 60 years ago, and methods for exploring the large molecule and the development of appropriate concepts for a proper scientific enquiry took time to evolve. Spectroscopy has played a role in this process, light scattering in particular being used to show how high molecular weights might be, and NMR spectroscopy latterly being used to identify polymer structures. Now spectroscopy is at the heart of modern developments within polymer science, being used not only to characterise the microstructure of the chains, but also to monitor their dynamics, so important in determining the physical properties of interest to the materials scientist and engineer, and to explore the interesting properties that are being introduced in the search for special effects to be used in devices. Two developments have given us insight into polymers at the molecular level, the first being the spectroscopic techniques for recognising molecular components and the manner in which they are linked together, which is the topic of the first part of this book. Of course, the analytical problem of recognising a particular polymer is less severe to the man who chose the monomer and the polymerisation process (and any plasticiser or stabiliser) than it is to a would-be emulator, but the proper description of the microstructure of a macromolecule is as essential to the developmental chemist (Chapter 1) as it is to his competitor. For this purpose, NMR spectroscopy has now overtaken IR spectroscopy as the Polymer Spectroscopy. Edited by Allan H. Fawcett © 1996 John Wiley & Sons Ltd
analytical tool in general use. A second advance, much associated with Flory, was the development of statistical mechanical methods. These have provided insight into the equilibrium configurations of the isolated polymer chain and the manner in which modest thermal energies develop elaborate configurations within the backbones and any side chains, so that the calculations of the mean values of such quantities as dipole moment and end-to-end distance are complex, yet focus upon such readily visualised ideas as the potential surface for the conformations of each pair of adjacent bonds. NMR spectroscopic quantities such as chemical shift and coupling constant may be considered in just these terms, as Tonelli has described for us (Chapter 2). One has only to reflect on a subject area such as liquid crystals, where so often the description is formulated by the physicist in terms of unit cell properties, to realise how much closer workers with polymers routinely think in terms of molecular structure, and are able to link a certain molecular feature to an interesting property. Configurational elaborations are the prime characteristic of molecules rendered extremely long by the repetitive enchainment of a small number of simple residues: Ciardelli et al. describe the manner in whch stimuli such as light may induce changes in the structure of pendent groups and so in polymer-solvent interactions that are amplified by the connectivity of the system to cause profound changes in the equilibrium statistics of the single chain, and hence in its solution properties. Indeed, a group of chains may so be led to associate reversibly (Chapter 14). The manner in which light interacts with chromophores in bulk polymers, located either within the standard residues or merely within minor components such as end groups, is the subject of Phillips and Carey's contribution (Chapter 15). There are two interrelated factors to be disentangled—the manner in which light is absorbed, whether it is retained or migrates, and how the energy is eventually used, together with the dynamics of the moieties involved in this process. Excimer formation, luminescence, fluorescence and other photophysics processes are all subject to such factors as spacing constraints and the timescales of segmental motions, which in the bulk are not merely the property of a single molecule. Although the physical chemistry of the chain isolated in solution is well understood, the question of its performance within the bulk has thus become the subject of much study. Rapid movement between adjacent conformations ceases below the glass transition of an amorphous polymer, and in the crystalline state packing effects become significant and restrict configurations to a very few. The question of the location of the backbone is readily tackled: spectroscopic techniques for studying the configurations of the polymer in amorphous and crystalline phases within the bulk are well established; neutron scattering is a prime, if expensive, tool for the determination of molecular dimensions and for the study of dynamics (in a quasielastic scattering mode) and is now being developed as a method for studying surface structures (Chapter 13). The contrast is obtained by use of perdeuterated molecules. Light scattering is a more familiar
tool for investigating polymers; the method was introduced originally by such luminaries as Debye, and has developed, with the availability of lasers, in the quasielastic mode, not just for chains isolated in solution but also for gels, when various modes of motion may be inferred from treatments of the fluctuations of the intensity of the light scattered. The technique is now applied to studying phase separating mixtures and events within polymers upon surfaces (Chapter 12). Richards also covers the small angle light scattering method as used to investigate semi-crystalline polymers. IR and Raman spectroscopy characterise the high frequency vibrations of the skeleton and pendent atoms of the macromolecule, and so immediately tell us what groups are present; they have a useful analytical capacity to distinguish, for example, a poly(methyl methacrylate) (PMMA) from a PVC or a polyolefin. Vibration modes extend over several simple oscillators (such as bonds and bond angles); in the crystalline state they reflect the arrangement adopted within the unit cell, from which IR bands and Raman shifts follow conventional symmetryrelated selection rules. They may be used to measure crystallinity, as such. In the amorphous state conformational elaborations are not averaged out on the timescale of the vibration. Observed bands are thus composite and relatively broad, and although they may indicate whether in a rubber a double bond is cis or trans, and may measure the presence of methyl groups in low density polyethylene, band frequencies are not as sensitive as solution NMR spectroscopy to microstructure details extending over several residues. The fine structure observed in the shifts of linear polymers is itself a topic of careful consideration, as Tonelli and Howarth et al. have described (Chapters 2 and 3). The conformational origin within vinyl polymers of the patterns displayed in 13 C shifts is now well established, and provides the best source of information on tacticity and residue sequence, so that one might attempt to discriminate between mechanisms for propagation, such as those of the Bernoullian and Markov type, those involving charge-transfer complexes, and mechanisms involving catalysts derived from metal complexes (Chapter 1). Once one has evidence on the reaction mechanism, one may proceed to the design of new and better catalysts. Like vibration spectroscopy, NMR in the solid state, made feasible by the cross polarisation-magic angle spinning dipole decoupling method, is similarly rather insensitive to microstructural issues within the crystalline and amorphous states, but interesting results may be obtained when carefully chosen systems are compared: Harris presents the cases of the 4/1 helix of syndiotactic polypropylene and the 3/1 helix of isotactic polypropylene, the former clearly displaying sensitivity to the helix structure through the gamma-gauche effect so that internal and external methylenes are distinguished, and the latter displaying some sensitivity to the helix sense of the neighbouring chains (Chapter 4). The solid state NMR method is capable also of sensing inhomogeneities such as arise from microcrystals within a homopolymer such as polyethylene, and within blends of two different and only partly compatible polymers (Chapters 4 and 5), an area
that is similarly tractable by modern two-dimensional methods that are being developed within IR spectroscopy (Chapter 7). Both chemical shift and IR vibration frequency of one chain are sensitive to the nature of the neighbouring chains, particularly if an interaction such as a hydrogen bond is possible. The timescale of magnetic polarisation decay is capable of being linked to the size of the inhomogeneities. Mobility as measured by proton or carbon NMR relaxation times is a property of matter, including polymeric materials and any permeated liquid, that may be sensed by a scanning technique and displayed in an image form, usually in two dimensions. Koenig surveys for us the various applications he has made, the images providing an interesting comparison with the more conventional light and electron microscope viewing methods (Chapter 6). Vibration spectroscopy is sensitive, as Hendra and Maddams describe (Chapter 7), to such factors as anisotropy within such samples as uniaxially drawn rods and biaxially drawn films, allowing their properties to be optimised from an understanding of the molecular process. Such well established use of IR spectroscopy is now being succeeded by dynamic dichroic methods, to reveal how the backbones and side chains separately respond to imposed cyclic stresses. This provides a fascinating account of the manner in which different modes of motion come into play. A development of Raman spectroscopy described by Young is the response of certain vibrations in the spectrum to a progressive strain imposed upon the material, a technique that may exploit recent instrumental developments such as charge coupled device cameras and the confocal Raman microscope (Chapter 8). For a composite material, the technique allows us to answer a question such as the manner of the distribution of strain along a polyaramid fibre within a matrix that initially bears the imposed stress; the particular interest is the length of fibre required to take up the strain. The timescale of the response of a polymer to a stimulus ranges from the high frequencies of IR radiation through to the low frequencies or long time scales of diffusion of the whole molecule by the reptation mechanism, a process that is amenable to study by dielectric relaxation spectroscopy, as in studies on cispolyisoprene by Adachi. The dielectric response is present only from polar units, and is governed by the location of the dipoles, whether within side chains or backbones, in the geometry of the dipole itself and the geometry and flexibility of the neighbouring segments. For the chain in solution, simple and satisfactory accounts are available in these terms, and only in special cases do the dipoles themselves mutually organise to control the response. For the bulk material, whether in crystalline, amorphous or liquid crystalline form, cooperations between chains may be significant. For example, the alpha relaxation of crystalline polyethylene is a progression of a kink in one chain within a crystalline region, as computer simulations have modelled: it is the linear all-trans neighbours that define the tube within which the single chain performs (Chapter 11). Distributions of correlation times may be extremely wide in an amorphous material, but how
much this derives from variations in local conformations and orientations of the dipole within the chain in question, and how much from intra-chain influences (which may themselves have a response) is, as they say, a very good question! The same issues arise when studying the dynamic mechanical behaviour of polymers, a method closer to the concerns of the polymer engineers. Perhaps the developing power of NMR spectroscopy to measure correlation functions and the magnitude of the orientational jump and to identify the pathways of the motion will help provide an answer to these questions (Chapter 5). As Spiess describes, the NMR method might measure the angle of displacement, as well as its frequency, for poly(oxymethylene), displaying helical jump dynamics. Two-dimensional and three-dimensional experiments are now being performed to measure motions and to determine order within oriented solids (Chapter 5). The use of a paramagnetic probe coupled with electron spin resonance (ESR) monitoring provides information, within the timescale range of 10"3 s to 10"7 s, of a complementary nature, for by sensing the mode of rotation of the radical within the polymeric matrix, it measures the behaviour of the "holes", the packets of free volume, that facilitate the movements of the chains and play a vital role in the glass transition, Tg, phenomena. Locating the radical on the chain or at its end allows one to sense the extra degree of freedom at a polymer chain end (Chapter 9). The ESR technique in this book is applied to a second issue, monitoring the radicals actually responsible for a polymerisation of pure monomer plus a certain amount of crosslinker, the interest lying in the changes that take place to create a new regime when the gel effect operates, during which termination reactions are much retarded by the immobilisation of the radicals, as they are also in the final period, when the development of a glass is the cause of onset of a third regime (Chapter 10). O'Donnell's work monitors the radicals by ESR and the unreacted groups by near-IR spectroscopy, to reveal new insight into the kinetics during these periods. This study of the chemistry of free radical polymerisation is succeeded by a discussion of an equally important topic, as far as industrial use is concerned, the detailed chemistry of degradation by ionising radiation of polystyrene and poly(methyl methacrylate): following such training, O'Donnell's previous students helped develop microlithography. This book records the principal lectures given at a Conference in Grasmere organised by the Macro Group. The proceedings of two of the previous conferences with this subject area and sponsorship have also been published [1, 2] and provide a useful indication of the developments that have occurred over recent years in the practice and value of polymer spectroscopy.
REFERENCES [1] KJ. Ivin (Ed.), Structural Studies of Macromolecules by Spectroscopic Methods, John Wiley & Sons, London, 1976. [2] A.H. Fawcett, Br. Polym. /., 1987,219,97 and following papers.
1 NMR CHARACTERISATION OF MACROMOLECULES IN SOLUTION A. H. FAWCETT, J. G. HAMILTON AND J. J. ROONEY School of Chemistry, The Queens University of Belfast, Belfast BT9 5AG, Northern Ireland, UK
1.1 INTRODUCTION The NMR method of studying the microstructure of macromolecules is the most effective available, provided that the materials can be obtained in solution. The method is now routinely employed to characterise and to identify the structures present in polymers, both those in common use and those created by the chemist when working with new monomers or new catalyst systems [1-6]. Derivatives of polymers and reactions on polymers are similarly accessible to study. The NMR parameter that is sensitive to these structural issues is the chemical shift, commonly measured in ppm from an internal reference. It senses readily information on the framework of the polymer—its connectivity—by providing information on the number and type of atoms linked to each particular nucleus, and also senses such factors as the relative chirality of pairs of such centres and cis/trans isomerism within double bonds. The nucleus most often employed for both man-made and natural macromolecules is 13C, despite its being rather dilute (only 1% of the carbons). This is because in the spectrum the dispersion of shifts is particularly large; much detail or fine structure is generally encountered that is directly related to the polymer structure itself, and signal intensity is rarely a problem with modern high field instruments. Many other NMR-active nuclei such as 19 F and 31 P may be used too when they are present in the macromolecule. Proton NMR spectra are complicated by the presence of coupling effects between the spins of the protons if, as is usual, the protons are present on directly bonded carbon atoms. In certain cases these coupling effects are of extreme value: as Bovey showed for poly(methyl methacrylate) [2,7], the tacticity of the polymers may be identified directly, and the value of vicinal coupling constants provides information on the conformational properties of the bond [5,8]. However, frequently, as for example with polyolefins, they conceal the shift effects associated with the microstructure Polymer Spectroscopy. Edited by Allan H. Fawcett © 1996 John Wiley & Sons Ltd
by creating a multiplicity of splittings, a complicating factor which may be relieved only by the use of a substantial proportion of selective deuteration, as has been demonstrated for polypropylene [9,10]. We may note two rather special cases of proton NMR spectra: for highly syndiotactic polystyrene the methylene protons, being equivalent, have a simple three line 1:2:1 pattern that derives from the coupling effect of the two flanking methine protons [ H ] . The highly isotactic polymer has a slightly more complex but still recognisable spectrum [12]. Features in the spectrum of the atactic polymer are quite unrecognisable, as proton coupling effects intermingle with chirality effects, coupled with substantial chemical shift anisotropy from the phenyl ring [13]: each main chain carbon bears at least one proton, a situation that is unfortunately more usual. We are familiar with only one case, involving the furfurol oligomer bis(5-furfuryl-2-furylmethane), in which the methylene protons are more sensitive to position than is the carbon of the same group; this is probably because the central methylene protons sample the anisotropic shielding cone of the furan rings in a manner different from that for the protons of the flanking methylene groups, but the carbons, being in the plane of the rings, experience a constant effect [14]. During the last 25 years the development of the NMR method, firstly in terms of the power of the magnet employed and secondly by turning to computer-based operating systems, has often been stimulated, if not driven, by the need to understand polymer microstructure. In 1971 the chemical companies Dow, ICI and Du Pont themselves commissioned new magnets that increased the magnetic field beyond 5 T in order to pursue their studies of polymers so vital to their business. This magnetic field, equivalent to more than 200 MHz in terms of the proton resonance frequency, was achieved by employing superconducting windings at cryogenic temperatures [15]. The stronger the magnetic field, the greater the sensitivity and the dispersion of shifts (and the closer the proton spectra come to being first order). Initially man-made polymers were the subjects of study, but more recently biological polymers have been the targets. The last ten years has seen field strengths in common use rise to 11.74 T (equivalent to 500MHz for protons and 125.7 MHz for carbons) by the adoption of superconducting magnets, and similar technical improvements associated with versatile signal transmitter and receiver coil design have also come into common practice. Indeed, 17.5 T instruments have recently been announced. Just as important as these developments in magnet design has been the introduction of pulsed Fourier transform methods, for these permit the performance of new types of experiment by the computerised systems that control the production, acquisition and processing of the experimental data. New pulse sequences increasingly made available by instrument manufacturers within their software suites permit the routine performance of these new experiments: an early example is the distortionless enhancement polarisation transfer, or DEPT, experiment to identify the number of protons attached to a carbon by controlling the final
proton pulse flip angle [16]. A later example is provided by 2-D and 3-D experiments, the introduction of which has made the connectivity of the carbon and protons much clearer [17,18], has much reduced the problem of distinguishing coupling effects from shift effects by providing extra dimensions for displaying the NMR signal, and has even provided an extra structure-discriminating route [19-22]. One development that exploits the storage of data on the computer base for subsequent processing can be optimised for a particular purpose, such as resolution enhancement using the Lorentz-Gaussian transformation technique, in which the free induction decay data is multiplied by the product of a Lorentzian and a Gaussian weighting function prior to the Fourier transformation [23]. Similarly, the computer base has been used for some time to control measurements within the time domain and to provide values for such parameters as T1, the spin-lattice relaxation time, which is sensitive to the motions of the chains, such as those of polysulphones, whose dynamic response is dispersed on opposite sides of the Larmor frequency when made from 1-olefins and 2-olefins [24]. The nuclear Overhauser enhancement (NOE effect) is also sensitive to the motions of the polymer chains, and good practice, when careful quantitative measurements of 13 C signals are required, is to use instrument settings that eliminate the NOE [25], so preventing it from enhancing the signals of certain carbons relative to those of others.
1.2 BRANCHED MOLECULES: POLYETHYLENE AND A POLYESTER SYSTEM We choose to start our discussion of the 13 C chemical shift effects in macromolecules with a mention of the substitution parameter schemes such as those of Grant and Paul [26], which were introduced into polymer spectroscopy by Bovey at an earlier conference in the series [I]. The rule that a carbon's chemical shift increases by a fairly constant increment when a covalently attached hydrogen atom is replaced by a methyl group, the alpha effect, has proved of value when spectral assignments are made. Similar parameters associated with substitution at progressively more remote sites, the beta, gamma and even delta effects, have been established and found to diminish in magnitude (alpha = 11 to 2.5 ppm, beta = 9 to 7ppm, gamma= —2.5ppm, delta = O to 0.5ppm). Although quite precise values are often given [2,3], the values of these parameters are sensitive to the exact structure of the site of supposed structural change, and the best practice utilises model compounds close to the target structures, as in Randal's studies on the side chains of polyethylene [27-29]. A development of this substitution approach, which is appropriate to molecules containing heteroatoms, is to study the effect on chemical shifts of replacing a —CH 2 — group with another atom or group. This has been used to predict shifts in molecules and polymers containing
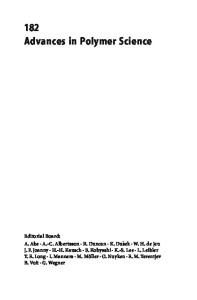
Figure 1.1 100 MHz 13C NMR spectrum of a high density polyethylene sample in solution at 125 0C. The spectrum shows peaks from end groups (E) and methyl, ethyl and butyl side chains. The sample had been irradiated at 423 K with 300 KGy of gamma rays [32] and shows minor features near 29,32 and 41 ppm from the H structures thus formed —O—, —NH— and —SO 2 — groups, the electronegativity of these groups causing in general a down-field effect. Thus, the shifts of polymers containing heteroatoms may also be predicted from first principles, for assignment purposes, if the shift of the corresponding hydrocarbon is known [30]. For the high density polyethylene spectrum of Figure 1.1, the main feature is the intense signal at 30 ppm from the long runs of methylene units. The shifts of the end groups (marked E 1 , E 2 , E 3 as we move inwards from the methyl signal) are the next feature, but a number of resonances from side chains are present. The methyl group of a butyl side chain coincides with E 1 , but the second methylene group, E 2 , is distinguished at % 23.4 ppm. The methyl groups of a small proportion of ethyl side chains (Etx) and methyl side chains (Me1) are also seen at 20 and 11 ppm respectively. The main chain carbons at the root of and next to the branches are also seen, the assignments for those next to the butyl unit being shown in the first part of Scheme 1. Methyl and ethyl side chains are probably derived from traces of propene and but-1-ene within the ethylene feedstock. The features from these are clear, but are in very small proportions compared with the end group signals for this linear polyethylene.
-CH2-CH2-CH-CH2-CH2CH 2 -CH 2 -CH 2 -CH 3 Bu3 Bu2 Buj Butyl side chains to polyethylene —CH2-CH2-CH-CH2-CH2-CH2-CH2-CH-CH2-CH2H crosslinks
— CH2-CH2-CH-CH2-CH2CH2-CH2-CH2Y links / long branches (1)
Scheme 1 Elementary structure in polyethylenes.
Application to the field of low density polyethylenes was prompted by the need to understand the high proportion of carbons in the form of methyl groups (perhaps as much as 8%), an early result from the IR spectra. The studies led to the recognition of an elaborate branched structure, for the production of which the mechanism of Roedel, backbiting by the propagating radical, was introduced. The normal process produces butyl side chains as a result of a cyclic transition state of five carbons-I-one hydrogen for the intramolecular hydrogen atom abstraction. Ethyl side chains (Et) may have formed by two consecutive backbitings. Randal has characterised low density polyethylene and related copolymers by carbon-13 NMR spectroscopy: complex dendritic structures are revealed by the analysis [30]. Long side chains form also by intermolecular abstractions of hydrogen atoms—chain transfer to polymer. A study of linear low density polymers, the side chains of which, as they derive from a 1-olefin component of known structure and occurrence, are well-defined, allowed the derivation of substitution parameters appropriate to the polyethylene problem itself, gave much security to this approach [27,28], and so led to the full assignment of the methylene carbon shifts dispersed on each side of the main signal at 30.0 ppm from the long runs of methylene groups. More assignments subtle were also found, such as a distinction between the methyl groups at the end of butyl side chains (14.21 ppm) and those at the ends of longer chains (14.01 ppm) [29]. Besides the use of substitution parameters, assignments were also made using special spectrometer settings: APT (attached proton test) and DEPT techniques allow the direct recognition of quaternary carbons, of methylenes and of methyls and methines together [30]. A coherent view of the complex dendritic structure of free radically-produced low density polyethylene is now available. The usual microstructural features of high density polyethylene, alkyl side chains, have also been observed in ultra high molecular weight polyethylene, but in much smaller proportions [31].
A related study has been the elucidation of the crosslink structures induced within polyethylene by high energy radiation. The secondary carbon radicals thus produced by C—H bond scission may diffuse by hydrogen atom abstraction. They have been shown to combine in pairs to form H type junctions, and to create Y type junctions by reactions with the vinyl end groups of the chains and with primary carbon radicals produced by main chain scission. In each case the shifts characteristic of the new structure were identified [32]. The shifts of the H junctions are distinct, being 41.1, 31.9 and 28.7 ppm respectively at the (CH) junction and the first and second linked carbons, as is shown in Scheme 1, but the shifts of the Y junctions coincide with those at the roots of long branches, and their formation is recognised only when a careful comparison has been made of the areas of these shifts before and after irradiation. In a similar area, that of the characterisation of branched and network polyesters from difunctional acids and tri- or tetra-functional alcohols, in systems that were first used about 150 years ago when there was no understanding of their polymeric nature, our studies have found a similar sensitivity in the NMR spectrum [33] within the 55-75 ppm region, where the carbons of the alcohol and ester functions are found; see Scheme 2. The shifts of the carbons of glycerol [33] or erythritol [34] during the progressive conversion of alcohol functions to ester groups by a reaction with succinic anhydride change after each step by a few ppm in a manner that is readily recognised, for the sequence in time and symmetry of substitution of the molecules that form reflects the greater reactivity of the primary alcohol sites. Thus, replacing the —O—H group of an alcohol with an O—H
i
I CH2-CH-CH2-O-H O-SA-OH O—H III CH 2 -CH-CH 2 O—SA-OH O—SA-OH
II CH 2 -CH-CH 2 -O-H O-H O-SA-OH O—H IV CH 2 -CH-CH 2 -O-SA-OH O—SA-OH
O—SA-OH V CH 2 -CH-CH 2 -O-SA-OH
l O — S A - OH Scheme 2 Primary oligomers of glycerol and succinic acid
—O—succinate has at the first, second and third carbons alpha, beta and gamma effects of respectively +2.6, —3.1 and — 0.4 ppm [33]. (These alpha, beta and gamma parameters correspond to the beta, gamma and delta parameters of Grant and Paul [26] because of the intervening oxygen atom.) If the second site of the succinic acid residue subsequently forms an ester, the shifts of the previously linked glycerol residue appear in slightly different places. Thus, a glycerol residue linked 1, 3 within a chain has different shifts from one linked 1, 3 at the end of a chain and from the oligomeric 1,3-discuccinate (III). We have introduced the term III" for such a chain-extending unit and III' for a unit at the end of a branch, the number of primes indicating how many of the second, and more remote, acid groups have reacted. The shifts of the glyceryl residues of the oligomers of Scheme 2 thus provide good guides to the shifts of glyceryl residues at branch points (V), in chain extenders (III and IV) and at chain ends (I and II) in the highly branched or fractal polymers that may be made, thus allowing the assignments of Figure 1.2. The trisuccinate oligomer V can be readily obtained in pure form [33], unlike the other oligomers. It may be polymerised in a single process by heating in a vacuum, where succinic acid is first lost as the anhydride to the vapour phase, and the vacated alcohol site (in a III or IV type residue, for which evidence is present in Figure 1.3) then forms an ester with an acid group of another oligomer. The consequence of this development of linkages is seen in the shifts of each carbon of the glycerol residue, where extra fine structure develops as the molecule evolves towards a dendritic or fractal structure. The initial molecule is a heptamer (XV of Scheme 3 [33]), but others emerge. The shifts are sensitive not only to whether the link at the remote site has formed an ester, but also (in the case of the central carbon) to whether that site was a primary or a secondary alcohol. The shifts of the network node are sensitive to the structure of the immediately
Figure 1.2 13C NMR spectrum at 126 MHz of the mixture of oligomers formed by the reaction of glycerol with succinic anhydride [33]. Only the region of the glycerol residue shifts is shown. The oligomers are identified in Scheme 2; G refers to glycerol
Figure 1.3 13C NMR spectrum at 126MHz of the mixture of oligomers formed by heating oligomer V in a vacuum at 1800C. Parts (a) and (c) for 40 min, part (b) for 20 min, part (d) for 60 min. The labels refer to Scheme 3. The region of the glycerol residue shifts is shown in (a), and for the higher resolution plots (b-d) only the signal from the central methine carbon. The resolution of the latter parts was obtained with zero line broadening. Reproduced with permission from [33] adjacent nodes when the link is succinic acid, but not if glutaric acid is used, for the extra methylene group renders the linkage too remote. In Figure 1.3 the shifts at three early stages may be seen, as the molecules evolve towards a polymeric form of III: peaks z and y 3 we assign to the shifts of the primary and secondary glycerol carbons when the primary carbon is linked to another glycerol residue; peaks yx and y 2 come from a secondary carbon of a glycerol which is linked through a succinic acid residue to respectively a primary and a secondary site of a glycerol residue, as shown in Scheme 3. These distinctions in the fine structure are relatively minor, are best observed with a high field system [33], and assist in the development of the chemistry of the formation of fractal polyesters. Novel liquid crystalline forms, for example, have been produced using such means, the
XV [V'- S A - VT 3 y3 z yi 1 H—O—SA-O—CH 2 -CH-CH 2 -O—SA-O—CH-(—CH 2 -O-SA-OH) 2
XVI
O—SA-OH 3 y3 z H-O-SA-O-CH2-CH-CH2-O-SA
[V-SA-V"- SA-Vl
I HO—SA-O
I O Y2 CH-CH 2 -O-SA-OH zCH2 O
H-O-SA-O-CH 2 -CH-CH 2 -O-SA HO—SA-O
xvn
[V 1 -SA-V] 3 k c* 2 1 H—O—SA-O—CH 2 -CH-CH 2 -O—SA-O—CH-(—CH 2 -O-SA-OH) 2 O—H Scheme 3 Some higher oligomers of glycerol and succinic acid; the numbers are those of ref. [33] mesogenic units being present as pendent groups demonstrably in full complement upon what was a poly(erythntolfractal glutarate [ O — H ] 2 backbone [34].
13 THE MICROSTRUCTURE OF LINEAR CHAINS The first microstructural issue of linear homopolymer chains that we examine is tacticity, which we illustrate with spectra from two systems from our own work: the poly(alkyl cyanoacrylates) [ - C H 2 - C ( C N ) C O O R - ] , which constitute a vinylidene system the spectra of which are shown in Figure 1.4, and the polyalkene sulphides and sulphones: [—CH 2 —CHR—S—] and [—CH 2 — CHR—SO 2 —], spectra of which are shown in Figure 1.5. We show meso or m dyad structures of two of these polymers in Scheme 4. Note how the two chiral centres of the first polymer appear to be equivalent, but for the second polymer the equivalence is less immediately evident, for the residues contain three bonds
Figure 1.4 NMR spectra of poly(ethyl cyanoacrylate) samples. Part (a) has the main chain methylene proton signals at 400 MHz of samples prepared in acetone with sparteine as initiator (A2) and in THF with cinchonidine as initiator (A5). Part (b) shows the 13C spectrum of the side chain methylene carbons of the samples A2 and A5, with triad and pentad assignments [38] (a) C N H CN I I I —C—C—C— C O H CO I (b) I OEf ; OEt
H CH2-CH3 I I -SO2-CH2-C-SO2-CH2-C-SO2CH2-CH3 H
Scheme 4 Meso structures of poly(ethyl cyanoacrylate) and poly(but-l-ene sulphone). The projections have the backbones in a planar ziz-zag, and show the chain from above and in successive residues a particular atom is in turn in the "up" and the "down" position. Triad, tetrad, pentad and longer sequences may be obtained by the successive inclusion of extra residues and may be recognised by NMR. The stereochemical structure of these longer sequences are described in terms of the m or r relationships of the successive pairs of chiral centres [2,3]. In the case
ppm
ppm
Figure 1.5 13C NMR spectra of the backbone methylene carbons of (a) a tactic poly(but-l-ene sulphide), (b) of the tactic poly(but-l-ene sulphone) made from it by oxidation, and (c) of an atactic polysulphone. The dispersion of shifts of the sulphone polymer is greater because of the gamma-gfaucfie effect of the oxygens. The small peak at 6 = 49.2 ppm is from H — H sequence.
of the first polymer the residues, as they have just two backbone carbons, are sensitive to influences equally from each direction along the chain, and mr and rm heterotactic sequences are identical as far as the signals from carbons at or pendent to the central chiral centre are concerned. At high resolution the influence of the next two chiral centres may be expressed, so we may be able to distinguish the rmrr and mmrr pentads. For the polysulphides and polysulphones the residues have three components, so that the influence upon chemical shifts of one residue that derives from the chiral centres of the two neighbouring residues is diflferent, and depends upon the direction: thus, an mr sequence will not for symmetry reasons have the same shifts as an rm sequence. (The mechanism that generates shift multiplicity depends upon fine differences in bond rotation populations for different chiral sequences that are coupled to the gamma-^auc/ie interactions, as Tonelli describes elsewhere [8]). As in the related olefin oxide and styrene oxide polymers [34,35], the residues of the polysulphide predominantly orientate in only one direction, so that head to head junctions are also encountered, and provide minor features in the spectrum, as we indicate in Figure 1.5. This type of enchainment has been termed positional isomerism, orienticity [3] or regioselectivity, the last term being used below for ring-opening metathesis polymerisation (ROMP) systems. Another consequence of the presence of three distinct groups in each residue of the linear backbone is the possibility of optical activity, a property that independently permits recognition of isotacticity [37]. We first discuss the spectra of poly(ethyl cyanoacrylate), proton spectra being shown in Figure 1.4(a) and the corresponding 13 C spectra in Figure 1.4(b) [38]. We use the classical route, first used by Bovey and Tiers for poly(methylmethacrylate) [2,7], PMMA, for determining the type of tacticity that predominates. They recognised the four-line pattern of an AB quartet in the 60 MHz spectrum of a predominantly isotactic polymer in the signal from the main chain methylene protons within a meso dyad—this was distinctly different from the single line from the methylene protons of a racemic dyad that was found in a polymer produced by a different mechanism (the absence of an effect from the coupling constant deriving from the equivalence of the two protons). For our assignment two polymers were available, poly(ethyl cyanoacrylate)s that had been made in different solvents and with different chiral initiators for the anionic polymerization process (it transpired that the solvent was the important factor). In contrast to the case with PMMA, an AB quartet was not immediately apparent in the proton NMR spectrum, and a pair of clear lines (a and b in Figure 1.4(a)) considered for part of such a system was found to be unsuitable: the splitting between the lines was not —14 Hz (the value of a geminal coupling) nor were there signals nearby at that splitting. Moreover, their relative intensities changed in a simple manner with the value of the tacticity parameter deduced from the 13 C NMR spectrum. They were thus assigned to rrr and rrm fine structure, and these assignments were confirmed by checking their relative
intensities with values predicted with the aid of a single (Bernoullian) tacticity parameter obtained from the side chain methylene carbon spectrum. Discrepancies between the Bernoullian and the experimental intensities were of the order of 2% within both proton and carbon spectra. The direct recognition of an AB quartet in spectra such as those of Figure 1.4(a) was prevented by partial overlap of m dyad signals dispersed by tetrad effects and a coincidence with the remaining r-centred tetrad, as a two-dimensional experiment has subsequently made clear [39]. The main components of the AB structure lie near 2.6 and 2.8 ppm. In the carbon spectrum pentad effects were resolved within the rr-centred triad of the side chain methylene carbons (Figure 1.4(b)). The two peaks of the mr-centred triad may be assigned as indicated in the figure to mrmm and (mrmr + rrmm) sequences, of expected relative intensities of 0.100 and 0.096 respectively of A2; the remaining sequence rrmr, of Bernoullian intensity 0.02, is apparently not resolved in the signal. This set of pentads may be more readily recognised on the basis of more clearly different line intensities in the spectrum of A5. They and the other peaks were assigned, once the chains were recognised as being predominantly isotactic, on the manner in which their intensities varied with the value of P1-, a practice which is widely adopted when samples of different tacticities are available. In the case of polyacrylonitrile [—CH 2 —CH(CN)—], which gives an atactic polymer when the free radical reaction is performed in solution, enhancement of the tacticity to Pf values as high as 0.70-0.87 has been provided by performing a polymerisation when the monomers were constrained, or lined up, within a urea canal complex. This allows the development within the 13 C NMR spectrum of intense peaks from certain heptads [12], the emphasis providing clear indication of the origin of the signals from sequences of high isotactic content. The fine structure of the 13 C NMR signals from the methyl groups of polypropylene displays pentad and partial heptad fine structure, for the assignment of which a number of methods were adopted, depending mainly upon the availability of polymers of known tacticity, as their crystal structures had previously been determined, but also using 13C-labelled model compounds of known stereo sequence content [40]. Highly isotactic polystyrene has been produced using a titanium trichloride-derived catalyst [41]. Once such a material is available the spectra may give an insight into the manner in which the process behaves: a catalyst for isotactic polypropylene sometimes allows errors in stereochemistry, but these are immediately corrected, as the presence of mrrm but not mrmm pentads testifies [2]. Such interesting evidence on the manner in which a catalyst functions helps us to understand the mechanism; we conclude this review with an account of such effects discovered in our studies of ring-opening metathesis polymerisation, or ROMP, which likewise use metal-centred catalysts. The Bernoullian nature of the free radical or ionic propagation in a polymer may be ascertained from the relative intensities of the rr, mr -I- rm, and mm components of the triad fine structure, as in our studies of the side chain
methylene group in poly(ethyl cyanoacrylate)s. Provided that each new chiral centre forms in a manner that depends only upon the type of the previous chiral centre, so that only one statistical parameter is involved for dyad occurrences, the weights of the triads are respectively [2,3] (1 - F1)2,2P1(I - P1) and (P,)2. Using in turn (from left to right) the first two areas, the second two, and then the first and third of each part of Figure 1.4(b), we solve for P1 to obtain 0.63,0.72 and 0.68 for sample A2, values which are hardly significantly different from each other; and for sample A5 we have correspondingly 0.52, 0.60 and 0.56, which are close. A test for Markov behaviour is provided by the relationships involving two parameters [2, 3]: JV/m) = « = (nn)/(2(m)) = (mr)/(2(mm) + (mr)) and P(m/r) = w = (rm)/(2(r)) = (mr)/(2(rr) + (mr)), where P(r/m) is the probability that an r dyad will follow an m dyad. Markov behaviour has u + w < 1.00. For the cyanoacrylate spectra of Figure 1.4(b) the values of u and w are respectively 0.28 and 0.66 for polymer A2 and 0.46 and 0.54 for polymer A5, indicating that both polymerisations are close to Bernoullian. Sample A2, which deviates more from the ideal was made using as initiator sparteine. As this compound is a dinitrogen base, it may enhance the formation of a complex between the oppositely charged initiator and the propagating ends of the chain in a zwitterion. A clear case of Markov behaviour is given below. The statistical index P = 4IS/H2 = (4(mm)(rr)/(mr)2] has been used to characterise the isotactic acrylonitrile polymers prepared within the canal complexes [12]. Two distinct mechanisms were identified from the dependence of this index upon the isotactic content, a much stronger dependence being found for the polymers produced at low temperatures after irradiation than for those produced during irradiation at a moderately low temperature, for which canal coherence might have been upset by the evolution of heat and the irradiation itself. The second aspect of linear polymers from our own field may be considered as a whole, for polysulphones may be obtained by oxidation of polysulphides as well as by the free radical copolymerisation of SO 2 with an olefin. Indeed, this chemical change is beneficial to the spectroscopy, for fine structure develops as a result of oxidation, as may be seen in Figure 1.5, where the shifts, each at 500 MHz, of the methylene carbons of an isotactic polysulphide and the polysulphone prepared from it are displayed in parts (a) and (b) respectively. As discussed elsewhere [2, 5, 8], fine structure may be the consequence of gamma-grawc/ie interactions weighted according to the occupancy of the intervening bond conformational states. In this case the fine structure undoubtedly develops a larger dispersion and becomes more sensitive to the stereochemistry because we have introduced oxygens gamma with respect to each main chain carbon; such oxygens may cause a shift effect as large as — 9.4 ppm, the particular value
depending upon the conformation adopted by the intervening C—S bond [30,42]. Poly(l-olefin sulphone)s have been found to be atactic when made from the monomers by the free radical reaction; when first observed the backbone carbons showed incipient or clear triad fine structure [41,42]. The first carbon of the side chain displays dyad stereochemical sensitivity at low resolution, the upfield half of the signal being assigned to an m dyad when a comparison was made with an isotactic poly(propylene sulphone) made by oxidising an isotactic polysulphide [41]. The poly(but-l-ene sulphone)s prepared by free radical means showed similar spectra of the main chain methine when examined at high field (Figure 1.5(c)), showing clearly mm, mr + rm, and rr triads, as labelled by comparison with the other spectrum, that of the optically active polymer prepared from a polysulphide. The test on the Markov nature finds M = 0.51 (±0.01) and w = 0.480 (±0.005), giving u + w = 0.99 (±0.01), so the free radical polymerisation process was clearly Bernoullian. For the polymer prepared by oxidation of the polysulphide the parameters are w = 0.25 (±0.01) and w = 0.51 (±0.01), giving M + W = 0.76 (±0.02) and indicating the Markov nature of the polymerisation process the polysulphide precursor had experienced. (From the spectrum of the polysulphide itself we were able to obtain only one parameter, P1 = 0.66, a number very close to w/(u + w) = 0.67, as expected.) It may well be that the polysulphide formation was not Bernoullian, for the catalyst used was an optically active zinc-centred species that favoured the R enantiomer of the sulphide, and the monomer itself contained an excess of the S enantiomer [44]. A second feature in the spectrum reflecting the polysulphide formation mechanism is the presence of three minor features near 49.2 ppm in Figure 1.5(b) that we associate with head to head structures. During propagation, the sulphide anion at the end of the chain may occasionally attack the methine carbon site as well as the methylene carbon site in the monomer, and this remains when the polysulphone is prepared. We note that the heterotactic triads signal of Figure 1.5(c) has more than three components, consistent with the mr and the rm heterotactic sequences being distinguishable; as the relative intensities of the four not quite resolved lines for the atactic polymer of Figure 1.5(c) are roughly in the proportion of 1:2:3:2, and the four heterotactic-centred sequences mmrm, mmrr, rrmm and rrmr would be expected to have similar proportions (as Pr = P1n) = 0.5), one of these pentads must be sensitive to an extra chiral centre. Our most recent work in this area has shown that tactic main chains may be obtained in a free radical reaction if the 1-olefin bears a chiral centre of a particular type (K 6r S) at the site next to the olefin group: the carbon NMR spectrum then displays from each atom within or close to the backbone widely spaced pairs of peaks, the relative intensity within each pair being 6:4 or 7:3. This reflects within a residue a preferred relationship of the two chiral centres [45], the one initially present within the olefin and the second created by the addition reaction.
1.4 THE PARTICIPATION OF A CHARGE-TRANSFER COMPLEX IN A FREE RADICAL POLYMERIZATION REACTION A long-standing issue in the formation of alternating copolymers, such as are found when electron-rich and electron-deficient monomers polymerise by free radical means, has been the question of the role of the charge-transfer complex in the polymerisation mechanism. For poly(olefin sulphone) feeds, many experimental techniques have demonstrated that the complex is present, but is the complex incidental or is it the reacting species? One possibility is that each type of radical may react only with the other type of monomer; a second is that the charge-transfer adduct itself is the only reacting species [46]. In Scheme 5 below these two possibilities are shown respectively as the vertical (c + d) and the horizontal (a) propagation reaction paths. The rate-determining step for polymerisation is apparently the reaction of an electron-deficient radical, presumably a sulphonyl radical, with an electron-rich monomer, presumably either an olefin (d) or the olefin part of a charge-transfer complex (a), for substitution to the olefin group enhances the rate. AU the reactions are written as reversible in Scheme 5: there is a wealth of experimental evidence in support of this, for example, the olefins are known to isomerise at temperatures above and below the ceiling temperature for polymer formation, and the ESR spectrum of the radicals present indicates that this may be both C-based and S-based. P-SO2-C-C* SO2
JcSo 2
P-SO/ + C=C - = - P-SO2-C-C-SO* e dC=C
P-SO2-C-C" Scheme 5 The free radical formation of poly(but-2-ene sulphone) through chargetransfer complex reaction (horizontal route) or successive monomer addition (descending route) If the precise alternation in the chain residues is the only criterion, there is no way of distinguishing between the two mechanisms. However, the stereochemistry of the but-2-ene sulphone residues and their relationship to the cis or trans nature of the olefin does provide a guide [43,46]. Broadly speaking, two methyl shifts are encountered: at high temperatures, whichever olefin is used, there is a single shift at « 9 ppm, but at low temperatures, if the trans but not the cis olefin
Figure 1.6 13C NMR spectra at 101 MHz of the methyl groups of s/B three samples of poly(but-2-ene sulphone) recorded in DMSO-J6 at 70 0C. The samples SCH/7, U27 and U23 were prepared at - 95 0C, - 63 0C and - 84 0C respectively, the last from the cis olefin and the first two from the trans olefin. Lowering the temperature has increased the intensity of the signal at 13 ppm from the meso residues obtained from the trans olefin, but the signal from the polymer made from the cis olefin at an intermediate temperature shows a much greater proportion of the racemic residues, with their methyl shift at 9 ppm [46]
is used, there is a new peak at 13ppm; see Figure 1.6 for three examples. The assignment of the order of the methyl carbon shifts to meso or to racemic but-2-ene residues is not straightforward; since a gamma-gauche effect from the oxygen atom of the sulphone group (9.4 ppm) may well be larger than the gamma-gauche effect from a methyl group (6.4 ppm), the shift distinction may be associated with the conformations of the C—S bonds, rather than with that of the C—C bond as we first assumed [42]. We now make the assignment of the meso and racemic structures on the basis of the similarity of the order of the shifts in the polymers to models of known structure. The molecule alpha-2,3-bis(isopropylsulphonyl) butane has the structure shown in Figure 1.7(a), according to X-ray measurements, making it the centrosymmetric meso form [46]. The central unit corresponds exactly to a residue of a poly(but-2-ene sulphone) chain that is flanked by structures corresponding to a little over half the alkane component of the next residue. The carbon shift of the central methyls is at 13.7 ppm, compared with 10.0 ppm for the corresponding shift in the racemic molecule, shift differences that are found in the polymers, too. (The IR spectra show similar correspondences [46]). The fact that at low temperatures the trans olefin converts to polymer with partial retention of the configuration of the two prochiral centres
T/C
Figure 1.7 (a) The model bis(isopropylsulphonyl) butane in the crystal [46], showing its centrosymmetry and meso characteristic of the central portion; (b) plots of meso residue content against temperature of preparation for the series of poly(but-2-ene sulphone)s prepared from cis and trans olefin, curves (i) and (ii) respectively. That there are two distinct curves indicates that the charge-transfer complex is a significant reacting species. The solid symbols record the results from the spectra of Figure 1.6
on the olefin-CT complex and that the cis olefin converts similarly suggests that the reaction does proceed along path a of Scheme 5 at these low temperatures, when large proportions of the charge-transfer complex are present. At the higher temperatures the polymer and the monomer structures are not related, both yielding mainly racemic residues, consistent with alkyl radicals being present long enough during the polymerisation for radical inversions to eliminate the memory of the initial structure. Chain microstructure therefore indicates that the complex is a reacting species at low temperatures. We cannot tell whether the complex exclusively reacts, and the sulphonyl radical partly dissociates (path b), or whether paths a and c are alternatives, a being becoming favoured as the temperature is lowered, to some extent reflecting the greater stability of the charge-transfer complex. The rise in meso content when cis olefin is the precursor probably indicates that path c is used even at low temperatures, and that then the radical intermediate favours less a mode of reaction that yields the racemic type of product.
1.5 THE POLYMERISATION OF DIENES The manner in which dienes become entrained within polymer chains depends upon a number of factors, such as the type of mechanism (free radical, ionic or coordination), the nature of the diene itself, and whether other monomers are involved. If one double bond reacts, a chiral centre is formed and the polymers may be tactic, if 1,4-addition (or 4,1-addition) takes place the main chain incorporates a double bond whose cis or trans nature may be important in determining properties such as the glass transition temperature, and the reaction of a second double bond can cause crosslinks. The case of polychloroprene has been described by Ebdon [47], where proton shifts are sufficient to detect head to tail (2.35 ppm), head to head (2.5 ppm) and tail to tail (2.2 ppm) enchainments of this unsymmetrical monomer [47]. For poly(butadiene)s, sequence triads involving three different types of residue—cis and trans 1,4-residues within the main chain and 1,2-residues involving pendent vinyl groups—may be distinguished even with a 270 MHz spectrometer in the region of the spectrum between 127 and 133 ppm, where are found the resonances of the 1,4-residues (see Table 1.1 and Figure 1.8). The assignments were obtained using a number of polymers of distinctly different but recognisable microstructure. When the spectrum is obtained under conditions that avoid NOE enhancement of signal intensity, and long delays between pulses reduce systematic errors in signal proportions, from this region and that of the pendent vinyl groups (at 114 and 143 ppm) compositions accurate to better than 1% may be claimed [25]. In this study of polybutadiene rubbers, when three different methods were compared, it was found that the microstructures as determined by the Raman and 13 C NMR methods
Table 1.1 Triad sequences within the main chain olefinic region of the carbon-13 NMR spectrum of poly(butadiene)s [25]. Reproduced from [25] with kind permission from Elsevier Science Ltd., The Boulevard, Langford Lane, Kidiington OX5 IGB, UK Carbon Atom Peak No. Triad assignment Shift (ppm) -C=C*I vtv 13L8 2 ctv, ttv 131.4 3 we 130.7 4 ctv, ttv 130.6 5 ccv, tcv 130.2 6 ctc,ctt 130.2 7 vcc, vet 130.1 8 ttc, ttt 130.1 —*C=C— 9 ctv, ttv 129.9 10 ccc, tec 129.7 11 cct, tct 129.5 12 ctv, ttv 129.3 13 vtc 128.5 14 vtt 128.4 15 vtc 128.2 16 vcc 128.1 17 vet 127.9 18 vcv 127.8 *Note: v = vinyl, c =* cis, t = trans.
were in good agreement but that the IR method was much less consistent [25], as peaks were not very distinct and extinction coefficients were too variable. We illustrate the reactions of dienes by our studies on furans as monomers in free radical copolymerisations with acrylonitrile (AN), work undertaken to develop the polymer chemistry of materials that may be obtained from renewable resources. We have found that a variety of structures may be entrained within a polyacrylonitrile chain; to some extent their proportions depend upon the presence and the nature of substituents at the position alpha to the furan ring [48-50]. Only furan, the least aromatic of the heterocycles, seems to behave in this way. The five-membered furan ring remains intact. The differentiation of structures of types I and II was performed on the basis of the shifts of model compounds obtained by reacting furan and methylfuran with the 2-cyanopropyl radicals from decomposing 2,2'-azobis(isobutyronitrile), AIBN. The carbon shifts of the polymer residues were consistent with attack at the alpha or C 2 position of furan and at the C 5 position of methylfuran by the acrylonitrile radical. The furan radical that forms then propagates in the manner of a diene either through the more remote alpha position or through the adjacent beta position. A minor proportion of I residues from methylfuran in which the polymer AN radical had attached to the C 2 were also detected from the appearance of minor shifts at 130 ppm (see Figure 1.9) from the beta carbons,
Figure 1.8 13 C NMR spectrum of an anionically prepared polybutadiene at 25 0 C in CDCl 3 at 60 MHz. The labels correspond to the peak numbers and triad sequences of Table 1.1. In this study [25] extreme care was taken in obtaining quantitative information: avoidance of the nuclear overhauser enhancement was achieved by decoupling only during the signal acquisition; pulse angle 90°, 40000 scans, 33 s pulse delay. Reproduced from [25] with kind permission from Elsevier Science Ltd., The Boulevard, Langford Lane, Kidlington OX5 IGB, UK shifts that reflect the different arrangement in this residue of the methyl and nearest nitrile groups. The appearance at this place of the olefinic shifts is readily rationalised in terms of a beta effect of 3.7 ppm and a gamma effect from the nitrile group of —5.5 ppm. Other peaks were found in both proton and 13C spectra in the region below the shifts from the acrylonitrile residues, and other possible structures were sought,
i
H
in
iv
v
vi
Scheme 6 The structures of five residues derived from furan in acrylonitrile (AN) copoiymers, and the methylfuran radical
Figure 1.9 13C NMR spectra of the low field region of (a) a dimethylfuran copolymer, (b) a methylfuran copolymer, and (c) a furan copolymer. Assignments of the nitrile carbon of the AN residues, of the olefinic carbons of the furan residues and of the bridgehead and other carbons next to an oxygen are indicated but a certain proof of a third type of structure was more elusive. The characteristic feature was a proton shift at « 3.9 ppm [49], a position appropriate to a proton on an ether carbon, and olefinic protons were thought to be lacking. We present a relevant set of reactions in Scheme 7. It was eventually recognised [49] that the addition of an excess of the furan monomer, which promoted II-AN-furan sequences, had the effect of reducing the proportion of the unknown furan residue, presumably by preventing the participation of the II structures in a second reaction (d) to give a structure of type III. Once ~ II-AN-AN' radicals were reduced in proportion by this means, the signals from the II structures became clearly enhanced in the spectrum, as route (a) was then taken. This
Scheme 7 Possible reactions of a II structure in a second manner during the acrylonitrile copolymerisation [49] revealed the origin of the previously obscure third structure. A proof of the entrainment of AN-furan Diels-Alder products was made by observation of the shifts of the residues formed by a direct copolymerisation involving an endo adduct of furan and a mixture of endo and exo adducts: the carbon and the proton spectra together indicated that both adducts can become entrained within an acrylonitrile chain [48] to yield a structure of type IV, with carbon shifts at 80ppm from the bridgehead sites and corresponding proton shifts at about 4.7 ppm. A careful inspection of the region near 130 ppm in the spectrum of each polymer (Figure 1.9) reveals that each carbon of the I residues has two shifts, a feature that we attributed to the influence of the chirality of the nearest —CHCN— chiral centre. No feature that we could associate with the cis or trans junctions to the ring were identified, although for the I residues, if not the II residues, the structural variation seemed possible. Inspection of the spectra at a higher field strength found a further set of peaks whose intensities increased as the furan content rose from « 5 to 25% of the residues. This was attributed to a small sequence effect. In an effort to clarify the sequence fine structure, both of the various furan residues and of the acrylonitrile residue signals un-field, we added Lewis acids in the hope of causing alternation of the residues by enhancing the electron deficiency of the acrylonitrile radical through a coordination to the nitrile group. When the polymerisation was performed in the presence of a mild Lewis acid such
as ZnCl2, it was found instead that, although the yields were enhanced by an order of magnitude, the furan proportion was increased only a little, but the pattern of the predominant II structures became modified considerably [50]. For the 2-methylfuran systems, the shift of the 5-proton was diminished relative to the shifts of the other furan protons. The search for their new position in the spectrum, to provide structural evidence for the effect of the Lewis acid upon the reaction mode, was performed with deuterium NMR spectroscopy, the methylfuran monomer having been deuterated at the single alpha position. In reactions leaving a furan ring from radicals of structure V at the end of chains, the deuteriums were found to have transferred from the furan radical to the Lewis acid-activated monomer (creating D—CH 2 —CHCN ~ , shift at 1.5 ppm) and to acrylonitrile radicals (creating ~CH 2 —CHDCN, 2.2 ppm). This latter group was also identified at 14.3 ppm in the 13 C NMR spectrum, where it was particularly prominent if an independent source of hydrogen atoms, in the form of a chain-transfer agent, had been added [48]. Despite the transfer reaction and the disproportionation promoted by the Lewis acids, processes which would be expected to lower molecular weights, yields of the free radical reaction were greatly enhanced and gels were produced, presumably through a crosslinking second reaction of II residues, and the proton NMR signals consequently became broader [50]. Isotopic enhancement may be also illustrated by Bevington et al.'s exploration of the use of the*3C-enriched free radical initiators l,l'-azobis(phenylethane) and AIBN in preparing butadiene polymers [51] and the use of dimethyl 2,2'azobis(isobutyrate) to initiate the polymerisations of styrene, acrylonitrile, methyl methacrylate and methyl acrylate [52]. The signals from the ends are thus rendered more intense, and become observable in a standard 13 C NMR spectrum, where they display information on the manner in which the initiator radicals have attacked the first monomer to become incorporated at the start of the polymer chain: one can thus compare initial and mean tacticities. In a further use of isotope enrichment, Moad and Willing found that selective 13 C enrichment of one monomer together with carbon-13-proton correlation NMR spectroscopy allowed the separation of tacticity and sequence effects; they used this approach for studying copolymers of butyl methacrylate with methyl methacrylate [53].
1.6 RING-OPENING-METATHESIS POLYMERISATIONS Polymers formed by the ring-opening metathesis polymerisation (ROMP) reaction [54] exhibit a wide variety of microstructures which may be evaluated by specctroscopic techniques. The first ROMP polymers were analysed by IR spectroscopy [55], but that can only determine the absolute stereochemistry of
the double bonds in the polmer, and provides no information on the sequences in which such microstructural variations might occur. This limitation is largely overcome by 13 C NMR spectroscopy, where sensitivity to change in substitution and stereochemistry up to six carbon atoms remote from the particular carbon under observation is regularly seen [54], In the remaining part of this article we deal almost exclusively with polymers formed from the bicyclic olefins norbornene, norbornadiene and their derivatives, but will also discuss some work with oxygen-containing analogues, thus providing a comprehensive range of different microstructural types. These monomers have a substantial ring strain, so they are good candidates for ROMP.
P * polymer chain
Scheme 8 The ROMP reaction of Scheme 8 is catalysed by metallacarbenes [54] that have been formed from a wide variety of transition metal salts, often but not exclusively in the presence of an organometallic co-catalyst in systems similar to the industrially important Ziegler-Natta catalysts. In addition, there are now many examples of metathesis of both cyclic and acyclic olefins using well-defined metal carbene complexes [56]. In the former systems, which are considered here, the metallacarbene catalyst is formed from the various catalyst components and is very active, the concentration of active sites being extremely low but each site having a very high turnover number [57]. As a result, observation of the working catalyst by any spectroscopic or other means is not possible. We view the polymers, with their different microstructural features, as a "tape recording" of events at the catalyst site which may be "read" through the medium of 1 3 C NMR spectroscopy. For highly strained monomers these events are the primary ones up to high conversion. One may, by careful choice of monomer, study the potential of different catalysts to behave in a stereoselective or regioselective manner. Thus, with a symmetrical monomer such as norbornene [58], norbornadiene [59] or their 5,6 [60] or 7-substituted derivatives [61,62] we have obtained polymers with a variety of cis main chain double bond contents and distributions. In a number of the 7-substituted examples, fine structure on certain 13 C NMR resonances is observed which is attributable to tacticity effects. Conversely, one may use the unsymmetrical monomers such as 1-substituted derivatives [63] and delineate the propensity of the different catalysts to regioselectivity, which manifests itself as head-tail bias in the polymer.
In the case of these substituted derivatives, the polymers formed with most catalyst systems exhibit fine structure in the spectra due to each of the possible microstructural variations, leading to very complex spectra. We have made very extensive use of chain transfer to acyclic olefin to obtain lower molecular weights, and consequent line narrowing in the spectra of the polymers, to optimise resolution. Also, certain of the catalysts at our disposal may behave in a very stereospecific and regiospecific manner, allowing one to pinpoint certain lines in more complex spectra. These techniques, combined with the excellent resolving power and sensitivity of modern high field NMR instruments, have allowed complete and unambiguous assignment of most spectra.
1.6.1 STEREOSELECTIVITYINROMP There are two basic types of stereoselectivity observed in the ROMP of cyclic olefins, both of which may be observed in the 13 C NMR spectra of the polymers. The double bonds which form part of the main chain may be either cis or trans, and in the case of the prochiral monomers norbornene, norbornadiene, their symmetrically substituted derivatives and their chiral unsymmetrically substituted derivatives the residues may be enchained in such a way as to yield tactic or, more commonly, atactic polymers [54]. A representation of atactic poly(norbornene) is shown in Scheme 9, where cis and trans double bonds are associated with r or m dyad units respectively.
Scheme 9 Thus polymers with a given cis double bond content may be prepared with an appropriate catalyst, as is shown in Table 1.2. Resonances from the various olefinic and cyclopentane ring carbon atoms are observed and fine structure due to the effect of two or three neighbouring double bonds is resolved, Figure 1.10. One of the earliest observations to be made from these spectra was that the relative line intensities of the various cc, ct, tt and tc (etc.) resonances indicated that the distribution of cis and trans double bonds was non-random, and that there was an increasing tendency towards a blocky cis distribution as the cis double bond content of the polymer increased [58]. An explanation was suggested, based upon chain propagation involving different metallacarbenes which had been distinguished in terms of the stereochemistry of the last-formed double
Table 1.2
Fraction of cis double bonds in ring-opened polymers of norbornene, norbornadiene and derivatives obtained with different catalysts Catalyst
Monomer
RuCl3
MoCl 5 /Bu 4 Sn
OsCl3
WCl6/Me4Sn
ReCl5
Ref.
0.05
-
0.50
0.55
1.00
[54]
0.00
-
0.15
0.55
0.95
[61]
0.10
-
-
0.55
0.95
[60]
0.37
0.90
0.51
0.82
[59]
0.20
0.97
0.42
1.00
-
0.36
0.73
1.00
[66]
0.10
-
0.39
-
1.00
[66]
0.00
0.31
0.10
0.75
1.00
[63]
0.05
0.11
0.30
0.70
1.00
[65]
- [62]
bonds. In essence this theory emphasised the importance of steric effects at the catalyst site. Blocks of cis double bonds are obtained by propagation through a species P c (see Scheme 10) where the last-formed double bond is cis and where the next monomer unit reacts with the metallacarbene while the previously
Figure 1.10 * 3C NMR spectrum of poly(norbornene) with %60% cis, randomly distributed, main chain bonds
Scheme 10 formed cis double bond is still in the coordination sphere of the metal. The steric constraint thus imposed aligns the incoming monomer unit in a cis orientation, leading to the formation of another cis double bond. The kinetically distinct Pt species is believed to be too bulky sterically to be a chain carrier at all, and it relaxes to a species P in which the last-formed double bond has left the coordination sphere of the metal; the monomer has then the opportunity to react in either a cis or a trans orientation, with the trans orientation preferred on steric grounds. This phenomenon is also observed in the case of the stereospecific metathesis of acyclic olefins [68], where, in the pre-equilibrium stage of the reaction, cis products are often formed from cis substrates and trans from trans. Inspection of Table 1.2 shows that the cis content of polymers formed from bidentate chelating olefins is significantly higher than that observed with the mono-olefin analogue. The highly stereospecific and rather unreactive RuCl3 catalyst exhibits extreme behaviour, as it is highly trans-directing with norbornene, and incidentally with many other mono-olefin derivatives, but highly cis directing when using endodicyclopentadiene as monomer [66]. It is significant that the catalytically active residual solution from RuCl3/endo-dicyclopentadiene polymerisation also produces high cis polymers with norbornene derivatives, and that exo-dicyclopentadiene gives the "normal" high trans polymer. The link between steric crowding of the catalyst site and cis stereospecificity is therefore well established, both by ourselves [66] and by others [69].
1.6.2 DISTRIBUTION OF trans DOUBLE BONDS IN HIGH cis POLY(NORBORNENE) The NMR spectra of both the cyclopentane ring and the olefinic carbon atoms in poly(norbornene) are sensitive to the stereochemistry of the neighbouring double bonds and, as seen above, this leads to cc/ct; tt/tc doublets for the cyclopentane ring carbon atoms. There is, however, the possibility of quartet fine structure for both cis and trans olefinic carbon resonances, owing to the inequivalence of the carbon atoms in a given double bond [64], as in Scheme 11. CH=CH
m t/c
uc * crt
Cft
c/c
Scheme 11 In the spectrum of a poly(norbornene) of intermediate cis content, Figure 1.10, this fine structure is well resolved for the cis resonance, but overlapp of the etc and the ttt components occurs in the trans resonance. In high cis polymer two different types of non-random trans double bond distribution have been observed. Figure 1.11 shows the spectra of two polymers, one prepared using ReCl5, Figure 1.1 l(a), and the other using OsCl3, Figure 1.1 l(b) in the presence of benzoquinone, another chelating ligand which imposes a high a s directive effect [7O]. In these high cis polymers one would expect, statistically, that trans double bonds would almost always be flanked by cis double bonds, leading to high tc/tt ratios for the cyclopentane ring carbon atoms and a strong etc signal for the olefinic trans resonance. In fact, inspection of Figure l.ll(a) shows that the reverse is the case for the ReCl5-catalysed polymer; here the various ct and tt lines are of approximately equal intensity, and the centre component of the trans olefinic resonance which arises from isolated trans, etc, or blocks of trans, ttt, has become only a shoulder on the ttc line. This means that trans double bonds tend to occur in pairs in these predominantly cis chains. Mechanistically, this can be seen as a chain error repair process, where the aberrant formation of the first trans double bond is corrected by the formation of a second before resumption of cis double bond formation. An analogous phenomenon has been observed in the largely isotactic polymerisation of certain alpha-olefins [2], where 13 C NMR spectroscopy has shown that the small proportions of syndiotactic (r) junctions that occur are found in pairs, as evidenced by the relatively intense rmmr and mmrr pentad signals. Here the catalyst site, which normally selects the same prochiral face of the monomer in each cycle, occasionally reacts at the other face, leading to an aberrant r junction. Choice of the original prochiral face in the next
catalytic cycle results in the continuous formation of isotactic polymer: this mechanism is marked by the presence of pairs of syndiotactic (r) junctions. Alternatively the catalyst, having chosen a different prochiral face, continues to do so. The result is the formation of a polymer containing isotactic blocks joined by single syndiotactic (r) junctions, i.e. the initial error is propagated, and is visible in the 13 C NMR spectrum as the occurrence of mrmm and mmrm pentads. Here again an analogous situation exists in some ROMP's of norbornene and derivatives, and is seen in the polymerisation of norbornene using the benzoquinonemodified OsCl3 catalyst, Figure 1.1 l(b). In this case, and in contrast to the ReCl5 polymer of Figure 1.1 l(a), the various tt lines are three to four times as intense as the tc lines, with a concomitant increase in the intensity of what must be the ttt component over the ttc and ctt lines in the olefinic trans resonance. This indicates that the small percentage of trans double bonds occur in tn blocks (n > 2). The same phenomenon is observed in polymers formed from 1-methylnorbornene [63], Figure 1.12. At the cis junction in these high cis polymers, monomer addition occurs in a head-tail manner (see below) but the small proportion of trans junctions shows no bias. However, it may be clearly seen that in the polymer formed using the WCl 6 /Me 4 Sn catalyst, Figure 1.12(a), trans double bonds tend to occur in pairs, as evidenced by the low intensity ttt/ctc signals, whereas in the polymers formed from the OsCl3 catalyst, Figure 1.12(b), there is a tendency to form blocks. If there is propagation through metallacarbenes of octahedral symmetry with a vacant alternating ligand position such as described above, these species may be chiral, with the formation of tactic polymer. Furthermore, cis double bond formation will be associated with syndiotactic junctions and trans double bonds with isotactic junctions, as in Scheme 12. If, however, the catalyst site is achiral, or
Scheme 12 chiral but undergoing racemisation faster that propagation, then atactic polymer will result, and r or m dyads may be associated with either cis or trans double bond [67]. Initially (see below) with poly(norbornene) no fine structure was observed, which could be attributed to this tacticity effect, but it was realised that polymerisation using one enantiomeric form of a chiral norbornene derivative (Scheme 13) would translate the tacticity effect into a bias toward head-head (HH) and tail-tail (TT) addition for syndiotactic polymers, and head-tail (HT) addition for isotactic polymers [65].
fa)
ppm
(b)
ppm Figure 1.11 13C NMR spectra of high cis poly(norbornene): (a) 90% cis prepared using ReCl5 catalyst, and (b) 93% cis prepared using a modified OsCl3 catalyst
ROMP
Scheme 13
(a)
(b) 13
Figure 1.12 Olefinic region of the C NMR spectrum of poly(l-methylnorboraene) formed with (a) the WCi 6 /Me 4 Sn catalyst and (b) the OsCl 3 catalyst: (a) Reproduced by permission of Huthig & Wepf Verlag from [63]
This analysis was made possible because the chemical shifts of the various olefinic carbon double bonds in these unsymmetrically substituted norbornene derivatives are very sensitive to whether they are in an HH, TT or HT/TH unit, as can be seen for the case of poly(l-methylnorbornene) [63] in Figure 1.12. It was therefore possible to examine a range of metathesis catalysts for their ability to produce tactic polymers. In fact, a range of tacticities was observed, with extremes in behaviour being represented by the ReCl5 catalyst, which produced an all-ds syndiotactic polymer [65] and the W(mesityl) (CO)3 catalyst, which produced a high trans isotactic polymer [71].
1.6.3 REGIOSELECTIVITY IN R O M P The above method of tacticity determination depends upon there being no regioselectivity, i.e. no bias towards HT or HH/TT addition in the polymerisation of the racemate, and in fact this is the case with 5-substituted norbornene derivatives. Placement of a methyl substituent on the double bond results in complete regioselectivity [72], but much more interesting is the case where an alkyl group is in the bridgehead position, as in poly(l-alkylnorbornene) [63, 73]. These monomers exhibit a strong catalyst- and substitutent-dependent selectivity, which again may be observed in the 13 C NMR spectra of the polymer, Figure 1.13. For example, high trans polymer may be prepared using either RuCl3 or OsCl3 as catalyst, but whereas the RuCl3 catalyst is non-regioselective the OsCl3 catalyst exhibits a strong bias towards the HT addition of monomer (Figure 1.12(a)). This effect may be explained in terms of different polarities of the respective [ M t ] - = C + C ^ pi-bonds as they engage the monomer double bond, Scheme 8, in a [2 + 2] cycloaddition reaction which is the initial step of the ROMP reaction [74,75]. As expected, steric effects are also important, and the more bulky ethyl substituent induces a HT bias in the polymer formed using the RuCl3 catalyst [73] and enhances the HT bias in the OsCl3 case [70][73], Figure 1.13(b). In this context a particularly interesting and unique example of the alternating copolymerisation of enantiomers was demonstrated in the polymerisation of 1methylnorbornene with the ReCl5 catalyst [63,75]. The analysis relied on the fact that the hydrogenated forms of these polymers (but see more recent work, p. 52), unlike their unsaturated precursors, exhibited fine structure due to the presence of ring dyad units of different tacticities. This catalyst gave a poly(l-methylnorbornene) which on 13 C NMR analysis, Figure 1.14, was shown to be all-cis and all HT, in contrast to the OsCl3 catalyst, which produced an all-trans and all HT polymer, Figure 1.13. Both polymers were hydrogenated, and it was found that whereas in the OsCl 3 case one line exhibited doublet fine structure, which must be due to the m/r effects, the ReCl5 polymer gave only the down-field line, indicating that the polymer was tactic. The
Figure 1.13 Olefinic region from the 13C NMR spectrum of all-trans polymer formed from various 1-alkylnorbornenes with different catalyst systems, (a) Reproduced by permission of the Society of Chemical Industry, London, from Br. Polym. J., 1984,16,2; (b) Reproduced by permission of the Society of Chemical Industry, London, from [73]
ppm 13
Figure 1.14 Olefinic region of the C NMR spectrum of poly(l-methylnorbornene) formed using a ReCl5 catalyst; the polymer is all HT all-cis and syndiotactic (compare Figure 1.12 (a) andd (b)). Reproduced by permission of the Society of Chemical Industry, London, from Br. Polym. J., 1984,16, 2
fact that it was syndiotactic was shown by using the OsCl3 catalyst to polymerise optically resolved monomer, which must result in an isotactic all-trans polymer. The 13 C NMR spectrum of the hydrogenated product gave only the up-field line of the original m/r pair, thereby proving the syndiotactic nature of the poly(lmethylnorbornene) prepared using the ReCl5 catalyst. Such a polymer can only form at a catalyst site which alternates in chirality in each catalytic cycle, and thus is required to choose alternate enantiomeric forms of the monomer in successive catalytic cycles. An alternating copolymer of enantiomers was thereby formed. It was therefore highly significant that, in this context, we were unable to form ring-opened polymer from optically resolved monomers with the ReCl5 catalyst. Here again we may draw parallels with Ziegler-Natta polymerisations, Scheme 14. In the syndiotactic polymerisation of propylene [76] the catalyst is
Scheme 14
selecting a different prochiral face of a monomer (which exists in only one molecular form). In the case of the 1-methylnorbornene monomer, Scheme 15, reaction is restricted to one face (exo) of the molecule [61], but two chiral forms are available. In each case the polymer is H-T biased, and the catalyst site alternates in chirality in each catalytic cycle.
Scheme 15
Scheme 16
13
C NMR studies of the ROMP of certain 7-substituted norbornadiene derivatives provided a remarkable example of a substituent-dependent regioselectivity, Scheme 16. 7-methylnorbornadiene [62] and 7-f-butoxynorbornadiene [77] were polymerised using a range of catalysts; whereas the 7-Me derivative behaved in the expected manner with almost exclusive attack at the anti face of the molecule (13C NMR spectra of the polymers are discussed below), catalyst attack occurred with almost equal facility at both syn and anti faces in the 7-r-butoxy derivative. In this reaction it is envisaged that the lone pair of electrons on the 7-oxy substituent interacts with the electrons of the syn double bond, and the normal [2 + 2] cycloaddition, which occurs on anti attack, becomes a facile pseudo [3 + 2] cycloaddition, overcoming the apparent steric crowding at the syn face [62]. 1.6.4 DIRECT OBSERVATION O F TACTICITY 13
C NMR spectra of polymers formed when there is unsymmetric substitution in the norbornene monomer, as shown above, have been very useful in demonstrating the regioselectivity of various catalyst systems. In addition, these substituents are responsible for a decrease in the conformational mobility of the polymer chain, and consequently fine structure which may be due to tacticity is resolved in certain cases. The situation is complicated, however, by the possibility that such splittings may be due to longer range HT effects when HT, HH and TT sequences are present in the polymer chain. Positioning the substituent at C 7 retains the chain stiffening effect without splittings due to a regio effect; the observed fine structure may then be attributed to tacticity effects, especially in high cis or high trans polymers where remote c and t effects do not interfere. These 7-substituted derivatives are also important because much of the above mechanistic interpretation depends upon the assumption that attack on the norbornene molecule occurs at the exo face. The result of ring-opening polymerisation of mixtures of syn- and anft'-7-methylnorbornene [61] shows that this assumption is valid. Thus, only poly(«nr/-7-methylnorbornene) was obtained from the polymerisation of syn/anti mixtures, although a small proportion of syn isomer was incorporated in some cases. With particularly active catalysts the syn isomer could be homopolymerised. More recently, and in relation to the regioselectivity studies discussed above, 7-methylnorbornadiene was prepared and polymerised [62]. The importance of these polymers (for NMR analysis) lies in the excellent resolution of the 13 C NMR spectra which may be achieved and the fact that ring tacticity may be observed directly in addition to cis/trans ratios and distribution. For example, the spectrum of the high trans polymer of anft'-7-methylnorbornene, Figure 1.15(b), which is atactic, showing sensitivity to m/r dyads, may be compared with its tactic high cis analogue, Figure 1.15(a). The syndiotactic nature of this latter polymer is inferred from the known behaviour of the ReCl5 catalyst discussed earlier. Other catalyst systems produce a variety of microstruc-
(a)
ppm
(b)
ppm
Figure 1.15 * 3C NMR spectra of poly(anft'-7-methylnorbornene): (a) syndiotactic all-cis polymer prepared using the ReCl5 catalyst; (b) atactic all-trans polymer prepared using the RuCl5 catalyst. Reproduced by kind permission of Elsevier Science Publishers from [61]
(a)
ppm
(b)
ppm 13
Figure 1.16 C NMR spectra of poly(anfi-7-methylnorbornene): (a) an intermediate cis-tactic polymer prepared using the W(mesit) (CO) 3 /EtAlCI 2 catalyst system, and (b) an atactic polymer of similar cis content prepared using the WCl 6 /Bu 4 Sn catalyst system. Reproduced by kind permission of Elsevier Science Publishers from [61]
ture types, and it is interesting that one can subtly change the behaviour of, for example, a W-based catalyst by changing the oxidation state and ligation. The W(mesityl) (CO)3 complex and the WVI hexachloride catalyst both produce polymers of intermediate and similar cis double bond content, Figure 1.16(a) and (b) respectively, but in the former case cis double bonds are associated solely with r dyads and trans with m, whereas in the latter case cis or trans double bonds may be associated with m or r dyads [61]. In keeping with the general principle that polymerisation of monomers that have a pair of double bonds capable of chelation at the catalyst site leads to the formation of high cis polymer [66], polymers formed from 7-methylnorbornadiene were generally high cis. Resolution of the various microstructural features is also observed in the* 3 C spectra of these polymers, but paradoxically it is in the C 7 , tt line, Figure 1.17 (which shows no fine structure in the 7methylnorbornene case), which is clearly resolved here; exactly the opposite situation holds for the C7, cc line. One can therefore estimate cis content, blockiness and tacticity of the various double bond dyads from this resonance alone, which may be checked for consistency by reference to the fine structure of other resonances in the spectrum.
Figure 1.17 The C 7 resonance in the 13C NMR spectrum of poly(7-methylnorbornadiene) prepared using the WCl6/Me4Sn catalyst system. Reproduced by permission of Huthig & Wepf Verlag from [62]
(a)
ppm
Figure 1.18 125 MHz 13C NMR spectrum of (a) poly(l-methylnorbornene), all cis, all HT, atactic, prepared using a tungsten carbene complex, (b) the same polymer prepared using the ReCl5 catalyst
An important consequence of the foregoing discussion is that it is impossible to predict which resonance will be split by any of the possible microstructural features, and one must therefore be careful not to assume that a polymer is, for example, tactic simply because no fine structure is resolved. Also, spectra of polymers taken on modern high field instruments (125 MHz for 13C) may show up fine structure not resolved on lower field instruments. A most apposite example of this was observed recently in the * 3 C NMR spectroscopy of polymers formed from 1-methylnorbornene using a tungsten alkylidene complex [78]. A spectrum was taken initially at 62.5 MHz and fine structure was not observed. The polymer was high cis, all HT, assumed to be syndiotactic and thought initially to be another example of the alternating copolymerisation of enantiomers described in detail above. However, on obtaining the spectrum at high field (125 MHz, Figure 1.18(a), each line exhibited considerable fine structure, showing that the polymer was in fact only partially syndiotactic [79]. In contrast, it was gratifying to observe that the alternating copolymer of enantiomers formed from this monomer using the ReCl2 catalyst, Figure 1.14, when re-examined at 125 MHz), Figure 1.18(b), had a spectrum almost devoid of fine structure, thereby demonstrating its tactic nature and allowing the assignment of some of the lines in the more complex spectrum of the atactic polymer.
1.7 REFERENCES [1] F.A. Bovey, high resolution carbon-13 studies of polymer structures, in K J . Ivin (Ed.), Structural Studies of Macromolecules by Spectroscopic Methods, John Wiley & Sons, London, 1976. [2] F.A. Bovey, Chain Structure and Conformation of Macromolecules, Academic Press, London, 1982. [3] J.L. Koenig, Chemical Microstructure of Polymer Chains, John Wiley & Sons, Chichester, 1980. [4] J.L. Koenig, Spectroscopy of Polymers, ACS Professional Reference Book, American Chemical Society, Washington, 1992. [5] A.E. Tonelli, NMR Spectroscopy and Polymer Microstructure, VCH Publishers, Berlin, 1989. [6] A.H. Fawcett, Synthetic macromolecules, p. 333 in G. Webb (Ed.), Special Periodical Report on Nuclear Magnetic Resonance, The Royal Society of Chemistry, Cambridge, 1993. [7] F.A. Bovey and J. Tiers, J. Polym. Sci., 1960, 44,173. [8] A.E. Tonelli, Chapter 2, p. 55, in this book. [9] F. Heatley and A. Zambelli, Macromolecules, 1969,2,618. [10] A. Zambelli and A. Segre, J. Polym. ScL, B, 1968, 6,473. [11] N. Ishihara, T. Seimiya, M. Kuramoto and M. Uoi, Macromolecules, 1986,19,2464. [12] M. Minagawa, H. Yamada, K. Yamaguchi and F. Yoshi, Macromolecules, 1992,25, 503. [13] A.M. Aerdts, J.W. de Haan and A.L. German, Macromolecules, 1993, 26, 1965. [14] A.H. Fawcett and W. Ddamda, MakromoL Chem., 1982,183, 2799.
[15] J.K. Becconsall, P.A. Curnuck and M.C Mclvor, Appl. Spectrosc, 1971,4, 307. [16] D.T. Pegg, D.M. Doddrell and M.R. Bendall, J. Chem. Phys., 1982,77, 2745. [17] R.E. Emst, G. Bodenhausen and A. Waokaun, Principles of Nuclear Magnetic Resonance, Clarendon Press, Oxford, 1987. [18] H. Friebolin, Basic One- and Two-Dimensional NMR Spectroscopy, VCH, New York
and Weinheim, 1991. [19] F.C. Schilling, F. A. Bovey, M. D. Bruch and S. A. Kozlowski, Macromolecules, 1985, 18,1418. [20] P.A. Mirau and F.A. Bovey, Macromolecules, 1986,19, 210. [21] JJ. Kotyk, P.A. Berger and E.E. Remsen, Macromolecules, 1990, 23, 5167. [22] G.R. Quinting and R. Cai, Macromolecules, 1994,27,6301. [23] A.G. Ferrige and J.C. Lindon, J. Magn. Reson,, 1978, 31, 337. [24] A.H. Fawcett, S. Fee and L.C. Waring, Polymer, 1983,4,1571. [25] J.A. Frankland, H.G.M. Edwards, A.F. Johnston, LR. Lewis and S. Poshyachinda, Specirochim. Ada, Part A, 1991,47A, 1511.
[26] [27] [28] [29] [30] [31] [32] [33] [34] [35] [36] [37] [38] [39] [40] [41] [42] [43] [44] [45] [46] [47]
D.M. Grant and E.G. Paul, J. Am. Chem. Soc,, 1964,86, 2984. J.C. Randal, J. Polym. ScL, Polym. Phys. Ed., 1973,11, 275. J.C. Randal (Ed.), NMR and Macromolecules, ACS Symp. Ser., No. 247,1984, 256. J.C. Randal, CJ. Ruff and M. Keltermans, Reel Trav. Chim. Pays-Bos, 1991,110,543. A.H. Fawcett, KJ. Ivin and C. Stewart, Org. Magn. Reson., 1978, 11, 360, and references cited therein. A. Kaji, Y. Akitomo and M. Murano, J. Polym. Set, Part A: Polym. Chem., 1991,29, 1987. Q. Zhu, F. Horii and R. Kitamaru, J. Polym. ScL, Part A: Polym. Chem., 1990, 28, 2741. A.H. Fawcett, M. Hania, K.-W. Lo and A. Patty, J. Polym. ScL, Part A: Polym. Chem., 1994,32, 815. A.H. Fawcett and M. Hania, unpublished results. F. Heatley, Y.Z. Luo, J.F. Ding, R.H. Mobbs and C. Booth, Macromolecules, 1989, 21, 2713. F. Heatley, G.E. Yu, M.D. Draper and C. Booth, Eur. Polym. J., 1991, 27,471. F. Ciardelli, O. Pierone and A. Fissi, Chapter 14, p. 347 of this book. A.H. Fawcett, J. Guthrie, M.S. Otterbum and D.Y.S. Szeto, J. Polym. ScL, Polym. Lett., 1988,26,459. A.H. Fawcett, D.Y.S. Szeto and D. Pepper, in preparation. A. Zambelli, P. Locatelli, G. Bajo and F.A. Bovey, Macromolecules, 1975,8,687. R. Mani and CM. Burns, Macromolecules, 1991, 24, 5476. A.H. Fawcett, F. Heatley, KJ. Ivin, CD. Stewart and P. Watt, Macromolecules, 1977,10, 765. R.H. Cole, P.W. Winsor, A.H. Fawcett and S. Fee, Macromolecules, 1987, 20,157. N. Spasky and P. Sigwalt, Bull. Soc. Chim. Fr., 1967,4617. A.H. Fawcett and R.K. Malcolm, Polym. Int., 1994,35,41. S.A. Chambers, A.H. Fawcett, J.F. Malone and S. Fee, Macromolecules, 1990, 23, 2757. J.R. Ebdon, The characterization of diene polymers by high resolution proton magnetic resonance, in K. J. Ivin (Ed.), Structural Studies of Macromolecules by
Spectroscopic Methods, John Wiley & Sons, London, 1976, p. 241. [48] C-W. Chau, A.H. Fawcett, J.N. Mulemwa and C-E. Tan, Polymer, 1992, 193, 257. [49] A.H. Fawcett, J.N. Mulemwa and C-E. Tan, Polym. Commun., 1984,25, 300.
[50] C-W. Chau, A.H. Fawcett, J.N. Mulemwa, L.-W. Poom, A. Surgenor and C-E. Tan, Makromol. Chem., 1992,193, 257.
[51] J.C Bevington, D.A. Cywar, T.N. Huckerby, R.A. Lyons, E. Senogles and D. A. Tirrell, Eur. Polym. J., 1991,27, 603. [52] J.C. Bevington, R.A. Lyons and E. Senogles, Eur. Polym. J., 1992, 28,283. [53] G. Moad and R.I. Willing, Polym. J., 1991,23,1401. [54] KJ. Ivin, Olefin Metathesis, Academic Press, London, 1983. [55] W.L. Truett, D.R. Johnson, LM. Robinson and B. A. Montague, J. Am. Chem. Soc, 1960,82, 2337. [56] J.H. Oskam and R.R. Schrock, J. Am. Chem. Soc,1993,115,11831. [57] KJ. Ivin, B.S.R. Reddy and JJ. Rooney, J. Chem. Soc, Chem. Commun., 1981,1062. [58] KJ. Ivin, D.T. Laverty and JJ. Rooney, Makromol. Chem., 1977,178,1545. [59] B. Bell, J.G. Hamilton, O.N.D. Mackay and JJ. Rooney, J. MoI. CataL, 1992,77,61. [60] R.M.E. Greene, KJ. Ivin, G.M. McCann and JJ. Rooney, Makromol. Chem., 1987, 185,1993. [61] J.G. Hamilton, KJ. Ivin and JJ. Rooney, J. MoI. CataL, 1985,28, 255. [62] J.G. Hamilton, JJ. Rooney and D.G. Snowden, Makromol. Chem., 1993,194, 2907. [63] J.G. Hamilton, KJ. Ivin, G.M. McCann and JJ. Rooney, Makromol. Chem., 1985, 186,1477. [64] R.M.E. Greene, J.G. Hamilton, KJ. Ivin and JJ. Rooney, Makromol. Chem., 1986, 187, 619. [65] H.T. Ho, KJ. Ivin and JJ. Rooney, J. MoI. CataL, 1982,15, 245. [66] J.G. Hamilton, KJ. Ivin and JJ. Rooney, J. MoI. CataL, 1986,36,115. [67] KJ. Ivin, D.T. Laverty, J.H. O'Donnell and JJ. Rooney, Makromol. Chem., 1979, 180,1989. [68] J.G. Hamilton, KJ. Ivin, G.M. McCann and JJ. Rooney, J. Chem. Soc, Chem. Commun., 1984, 1379. [69] D.L. Barnes, N.W. Eilerts, J.A. Heppert, W.H. Huang and M.D. Morton, Polyhedron, 1994,13,1267. [70] J.G. Hamilton and JJ. Rooney, ubpublished results. [71] G.I. Devine, H.T. Ho, KJ. Ivin, M.A. Mohammed and JJ. Rooney, J. Chem. Soc, Chem. Commun., 1982, 1229.
[72] TJ. Katz, SJ. Lee and M.A. Shippey, J. MoI. CataL, 1980,8,219. [73] J.G. Hamilton, KJ. Ivin and JJ. Rooney, Br. Polym. J., 1988, 20,91. [74] H.T. Ho, B.S.R. Reddy and JJ. Rooney, J. Chem. Soc. Faraday Trans. 1, 1982, 78, 3307. [75] J. G. Hamilton, K. J. Ivin, J. J. Rooney and L. C. Waring, J. Chem. Soc, Chem. Commun., 1983, 159. [76] J. Boor, Ziegler Natta Catalysts and Polymerization, Academic Press, New York, 1979. [77] J.G. Hamilton and JJ. Rooney, J. Chem. Soc, Chem. Commun., 1992, 370. [78] J.-L. Couturier, C. Paillet, M. Leconte, J.-M. Basset and K. Weiss, Angew. Chem. Int. Ed. EngL, 1992,31, 628. [79] J.-M. Basset, J.G. Hamilton, M. Leconte and JJ. Rooney, ubpublished results.
2
CONFORMATIONITHE
CONNECTION BETWEEN THE NMR SPECTRA AND THE MICROSTRUCTURES OF POLYMERS A. E. TONELLI Fiber + Polymer Science Program, College of Textiles, North Carolina State University, PO Box 8301, Raleigh, NC 27695-8301, USA
2.1 INTRODUCTION The resonance or Larmor frequency of a spin-1/2 nucleus is highly sensitive to the local molecular environment in which it resides. When placed in a strong, static magnetic field H 0 of several tesla, the cloud of electrons about the nucleus produces orbital currents resulting in the creation of small local magnetic fields, which are proportional to H 0 , but are opposite in direction. These local induced magnetic fields effectively screen or shield the nucleus from H 0 and result in the nucleus experiencing a net local magnetic field Hloc = H 0 (1 — a), where a is the screening constant, a is highly sensitive to chemical structure, i.e., the numbers and types of atoms and groups of atoms attached to or near the observed nucleus. It is the dependence of a upon molecular structure that lies at the heart of NMR's utility as a probe of molecular structure. Any structural feature that alters the electronic environment around a nucleus will affect its screening constant o and lead to an alteration in its resonance frequency or chemical shift 8. Consequently, to predict the chemical shift of, say, a 13 C nucleus in a particular molecular environment, the electronic wave function of the molecular system in the presence of the strong applied field H 0 must be known. For this reason it has been extremely difficult to make a priori predictions of the resonance frequencies or chemical shifts of spin-1/2 nuclei [1-4]. If, for example, we wish to calculate the relative chemical shifts of the 13 C nuclei in methane and methyl fluoride, we must be able to determine accurately the electronic wave functions of both molecules in the presence of Ho; Polymer Spectroscopy. Edited by Allan H. Fawcett © 1996 John Wiley & Sons Ltd
To date it has not been possible to make accurate predictions of the chemical shifts observed for spin-1/2 nuclei, even when applying the most sophisticated ab initio quantum mechanical methods. Instead, the empirically observed effects of substituents and local conformation have been used to correlate chemical shifts (usually 13C) with the microstructures of molecules, including polymers [5].
2.2 SUBSTITUENT EFFECTS ON 13C CHEMICAL SHIFTS Substituent effect rules useful in predicting the 13C chemical shifts observed in the 13 C NMR spectra of paraffinic hydrocarbons have been derived [6-9]. 13 C chemical shifts are ordered in terms of the effects produced by substituents attached to the observed carbon at the a, /?, and y positions. Some of the data used to establish these rules are reproduced in Tables 2.1-2.3, where it is apparent that each carbon substituent added a and/or j? to the observed carbon C° deshields it by ^ 9 ppm. On the other hand, each carbon y-substituent results in shielding of % 2 ppm of the observed carbon. Using these substituent rules makes it possible to assign the 13 C NMR spectra of paraffinic hydrocarbons, including their highly branched members. Table 2.1 a-substituent effect on ^13C [10]
and neighboring bond rotations (see Figure 2.5(a)), which render Px^ Pg_. The values of Pt and P9_ approach each other as the asymmetric center is further removed from the terminal isopropyl group, leading to a reduction in the expected nonequivalence of the isopropyl methyl carbons. This expectation is borne out in Table 2.5, where it is both observed and predicted that the magnetic nonequialence of isopropyl methyl carbons vanishes once they are separated by more than four carbons from the asymmetric center. It is apparent from this example that the microstructural sensitivity of 13 C NMR chemical shifts can have a conformational origin. conformation -* H loc -+(513C The shielding of 13 C nuclei by y-substituents in a gauche arrangement (ygauche effect) enables us to both complete and simplify the conformational connection between the microstructures and NMR spectra of polymers. y-gauche effect
microstructure
c l 3
-,
• p p m Figure 2.13 Observed and calculated [54] 19 F NMR spectra of PVF 2 : (a) measured at 84.6MHz; (b) measured at 188.2 MHz; (c) calculated. Vertical expansion in (a) is x 8, in (b) x 40.
from the main H-T fluorine resonance at 91.9 ppm (relative to CFCl3) and are attributed to the fluorine nuclei belonging to H-H: T-T inverted units [55,56]. We may write expressions for the relative 1 9 FNMR chemical shifts SF of the H-T and H-H: T-T fluorines in terms of their y-gauche effects (y FF and yFC) and the bond rotation probabilities (P) which determine the frequencies of y-gauche interactions: 5JT = (I+P t )y F ,c SF = (1 + 0.5 Pt,d + 0.5 Pt>e)yF,c + (1.5 - 0.5 Pt,c)yF,F, S¥ = (1 + 0.5 Pue + 0.5 Puf)yFtC + (1.5 - 0.5 P J y F i F , A
i>i t,t(-20°,20°) t,g+(-20°,100°) g-,t(-100°,20°)
He-Ht> 189 3.74 3.74 0.0010(0.0027)"
He-He, Ho 2.63 3.68 0.0016' (0.0016)*
Ht-Ht, Ho 3.68 2.63 0.0016(0.0020)*
H e -H t 220 2.59 2.59 0.0063fl (0.0030)*
a
r~£ averaged over all three (^1, ^ 2 ) conformations. *Same as above, except 0 , , ^ 2 = 0, ± 120° in the ^g* states (Heffner et al. [62]).
ties also listed there, the entries in the next-to-last row of Table 2.11 are obtained. These values should be proportional to the strengths of the intermethylene proton-proton cross peaks seen in Figure 2.14, and this is indeed the case. The agreement between the predicted and the observed pattern of NOESY cross peaks for the co-hetero triad of 1:1 alternating S-MM copolymer confirms the validity of the Koinuma et al. [67] conformational model. It is particularly noteworthy that this agreement requires the assumption of «20° displacements from the perfectly staggered rotational states as predicted for the backbone bonds in polystyrene by Yoon et al. [63] (see the Newman projections below). As an example, in the t, t conformation (see Figure 2.15), 0, # 2 = — 20°, 20° because this produces relief from steric interactions of the phenyl ring and the methyl methacrylate C^ as seen in the following Newman projections:
If perfectly staggered states t(0°), g ± (+120°) are assigned in the calculation of intermethylene proton-proton distances, then the results in the bottom row of Table 2.11 are obtained, i.e., all interactions (2Y Propagation P;+M^P; + 1 Termination
The instantaneous rate of polymerization and the net rate of formation of radicals are given by the following equations -d[M]/df = fcp[F][M] d[P]/dr = 2fc d /[I]-2fc f [P-] 2 where [M], [P'] and [I] are the concentrations of monomer, propagating radicals and initiator, respectively, / is the initiator efficiency and kd is the rate of decomposition of the initiator. The values of fcp and kt can be obtained directly from these equations using the experimentally determined values for [M] and [P - ], provided that / remains constant. We have shown that a suitable manipulation of the second equation enables the values of / and kt to be derived for incremental increases in conversion. Good agreement is obtained with current theories of free radical polymerization for the polymerization of methyl methacrylate at 60 0C [13].
10.3.1.7 Crosslinking Methacrylate Monomers
A major objective of the current research programme is to extend the treatment of polymerization kinetics based on direct measurements of monomer and radical concentrations to crosslinking systems. Conventional methods for measurement of monomer concentrations are not suitable, as they require soluble polymer. We have been able to apply our procedure for utilizing the near-infrared spectrum of the C = C bond in methyl methacrylate to systems containing ethylene glycol dimethacrylate (EGDMA) [14]. Figure 10.6 shows the variation of the concentration of C = C bonds during the polymerization of a MMA-EGDMA mixture containing 36% of EGDMA. The initial rate of polymerization is much higher than for MMA, and this can be attributed to the absence of a pre-gel region. However, the plateau region of the conversion is lower. This results from the crosslinking reaction, with the radicals and C = C bonds immobilized in the network.
% Conversion
Time / min
[R*]x10- 6 /moldnrr 3
Figure 10.6 Dependence of C = C concentration on polymerization time for (a) MMA and (b) a MMA-EGDMA mixture (36% EGDMA): polymerization temperature 600C; initiator 0.05 M AIBN
Time / min
Figure 10.7 Dependence of radical concentration [R#] on polymerization time for (a) MMA and (b) a MMA-EGDMA mixture (36% EGDMA): polymerization temperature 600C; initiator 0.05 M AIBN. Note that the concentration scales differ by a factor of 40 The radical concentration in MMA-EGDMA mixtures might be expected to be higher than in MMA owing to the retardation of the termination reaction by the network. In Figure 10.7 the absence of a pre-gel region is indicated by the increase in radical concentration from the beginning of the polymerization. The
most significant difference between the MMA-EGDMA mixture and MMA is the radical concentration in the plateau region. It is approximately 40 times greater in the mixture, and is almost millimolar. Kinetic analysis of the propagation and termination rate constants in the polymerization of MMA-EGDMA mixtures is more difficult than for MMA. An understanding of the polymerization depends on knowledge of the individual concentrations of C = C bonds that are (1) in monomer molecules and (2) attached to polymer molecules. This information may be obtainable for NMR spectra utilizing differences in the relaxation times of the two types of C=C environments. However, it is likely that the polymerization is heterogeneous with a non-spatially random distribution of crosslinks. 10.3.2 POLYMER DEGRADATION BY HIGH-ENERGY RADIATION The effects of high-energy radiation, principally y-rays and electron beams, on polymers have been studied extensively for many years. The main interest has been in the changes in material properties, such as strength and elongation. These changes in properties have been related to changes in molecular weight of the polymer molecules, either by main-chain scission or by chain crosslinking, frequently with the formation of an insoluble gel fraction. The applications of radiation effects on polymers have been two-fold: (1) the use of polymer materials in radiation environments, such as nuclear reactors, and more recently in space, (2) modification of the properties of polymer materials by reduction in molecular weight or crosslinking, especially in the microelectronics industry as electron beam resists, and perhaps in the future as X-ray resists. Fundamental understanding of the mechanism of degradation of polymers by high-energy radiation has been based mainly on structural changes observed in the polymers, and to a much smaller extent on measurements of small molecule products. ESR has been used since 1960 to observe radicals produced in irradiated polymers, and hence to provide evidence for intermediate species in the radiolysis. However, recent improvements in the stability and sensitivity of ESR spectrometers and in computer manipulation of the spectra have enhanced the use of this technique. The capabilities of the ESR technique for providing fundamental information about the mechanism of radiation degradation of polymers are shown in observations on gamma-irradiated poly(methyl methacrylate), polystyrene and their random copolymers. 10.3.2.1 Poly(methyl methacrylate)
The ESR spectrum of poly(methyl methacrylate) at 300K, shown in Figure 10.8(a), is well known. This characteristic 13 line (9 + 5) alternating spectrum
Figure 10.8 ESR spectra of poly(methyl methacrylate) after y-irradiation in vacuum: radiation dose 1 kGy; radiation temperature (a) 300 K, (b) 77 K
has been the subject of much debate, but it is now generally accepted to be due to the methacrylate propagating radical with two conformations. The ESR spectrum after irradiation at 77 K, shown in Figure 10.8(b), is quite different from the spectrum after irradiation at 300K. It is evidently due to a number of radicals; the propagating radical is not a significant component at this temperature, and must be formed by subsequent reactions of the radicals produced at 77 K.
Analysis of spectra A variety of techniques can be used to analyse for the component radicals in an ESR spectrum. They include: (1) dose saturation—spectra are obtained after irradiation to a series of radiation doses. The yield of trapped radicals does not increase linearly with dose above certain doses which are characteristic of particular radicals. In particular, radical ions show 'dose-saturation' at low doses;
(2) microwave power saturation—the observation of an ESR spectrum depends on the relaxation of the radicals (which are excited into the higher energy level by the microwave radiation) back to the lower energy level in accordance with the requirements of the Boltzmann distribution. Some radicals, and particularly radical ions, have a slow relaxation and hence they will not be observed at high microwave powers; (3) Photobleaching—radical ions can be distinguished from neutral radicals by irradiation with visible light above a critical wavelength, which is usually «500nm. The radical ions are bleached and disappear, whereas the neutral radicals are unaffected. The efficiency of this technique does depend on the interaction of the light with the radicals and hence requires a transparent or finely powdered sample; (4) Fourier transform masking—the ESR spectrum can be converted to its Fourier transform in the frequency domain. Lines in the original spectrum with different line-widths can be separated by masking of different parts of the spectrum and then conversion back into the original domain; (5) accumulation of spectra—the signal to noise ratio must be high to enable separation of different radicals in a spectrum, especially if some of the radicals are present in small proportion of the total spectrum. Accumulation of the spectra, possible with high stability of the magnetic field, enables the signal to noise ratio to be enhanced. The effect of spectral accumulation is illustrated in Figure 10.9 for poly(a-methylstyrene);
Figure 10.9 ESR spectrum of poly(a-methylstyrene) after y-irradiation in vacuum at 300 K (dose 6 kGy): (a) one scan of 200 s; (b) 150 scans
(6) thermal annealing—when a number of different types of radicals are trapped in a polymer during irradiation at a particular temperature, they will react in different ways at different temperatures on subsequent heating. The process of radical disappearance is known as thermal annealing, and can be used to distinguish different radicals present at a lower temperature. The greatest number of radicals will be produced by irradiation at the lowest possible temperature. Usually, liquid nitrogen is used to enable irradiation at 77 K for this reason, and the procedure is known as cryogenic trapping; (7) subtraction techniques—recording of ESR spectra by computer enables a variety of computational procedures to be used to identify and quantify the component radicals and their reactions. In particular, subtraction of spectra obtained after progressive stages of warming (thermal annealing after cryogenic trapping) will frequently show a triplet or other spectrum characteristic of a particular radical which has disappeared. The effectiveness of this procedure is enhanced if the sample is cooled back to the same reference temperature to record the spectrum after each warming step; (8) simulation—confirmation of the presence of different types of radicals and estimates of their proportions, and hence of their concentrations, can be obtained by simulation of the ESR spectrum. This procedure requires values for the parameters of the spectrum, Le. g value, number of lines, relative intensities of the lines, hyperfine splittings, line-widths, line shape (Gaussian or Lorentzian or a mixture). Simulated spectra can be computed for a wide variety of values for the different parameters, the simulated ESR spectrum being matched to the experimentally observed spectrum. We have utilized all of these techniques to analyse the ESR spectrum of poly(methyl methacrylate) at 77 K after y-irradiation. The progressive disappearance of different types of radicals, and the formation of the chain scission radical (which is the same radical as the propagating radical), eventually as the only species, during thermal annealing after cryogenic trapping, are shown in Figure 10.10. We have identified seven different radical species A-G, including the polymer radical anion G, in the ESR spectrum of poly(methyl methacrylate) at 77 K after y-irradiation in vacuum (the spectrum shown in Figure 10.8(b)), as follows: CH3
I
I
I
1
.
CH3
1 I
CH3- -CHO -COOCH3 - C H 2 - C -C—CH-C—CH2-CCOOCH^ I ' COOCH2 A B C D E F The progressive disappearance of these radicals, based on the spectra shown in Figure 10.10, is shown in Figure 10.11. The five regions shown in Figure 10.11 correspond to the disappearance of different radicals as follows: stage (1) A, B and
C; stage (2) C and D; stage (3) E; stage (4) propagating radical (F) is the only species present and is stable; (5) F. The mechanism of the degradation of poly(methyl methacrylate) by y-radiation can be deduced on the basis of the disappearance of radicals shown in Figure 10.11. This mechanism (Scheme 1) is consistent with the formation of molecular products, as previously reported.
^ C H
2
CH 3 I - C ^ C=O O
CH 3 O I Il - - C H 2 C - C H 2 - + - C - O — C H 3 + OTHERS #CH 3 -CHO
(LjJ3 CH 3 I -CH2C-CH2-
-CO-O-CH2
SCISSION
CH 3 CH 3 I I • -CH2-C+ CH2=C-CH2C=O O I CH 3
-CO-O-CH3
CO + CO 2 + CH 4 + CH 3 OH
Scheme 1 Mechanism of degradation of poly(methyl methacrylate) by y-radiation deduced from ESR studies of radical intermediates
10.3.2.2 Polystyrene The ESR spectrum of polystyrene after y-irradiation in vacuum at 77 K is shown in Figure 10.12(a). The spectrum is quite different from that of poly(methyl methacrylate). It can be assigned to three species: (1) the oc-carbon radical, (2) the cyclohexadienyl radical, and (3) a radical anion. The proportions of cyclo-
a-carbon
cyclohexadienyl
Figure 10.10 ESR spectra of poly(methyl methacrylate) after y-irradiation at 77 K and progressive wanning to 300 K. All spectra (except that at 77 K) were recorded on cooling back to 140K after 10 min at the specified temperature hexadienyl radicals and of radical anions are strongly dose-dependent, which provides a method for their assignment. The two neutral radicals are consistent with crosslinking being the major effect of radiation on polystyrene, in contrast to main-chain scission in poly(methyl methacrylate). The ESR spectrum after irradiation at 300K, shown in Figure 10.12(b), is similar to the spectrum at 77 K except that the centre line is reduced, owing to the absence of the radical anion, and the large outer peaks of the 'triplet' show greater resolution into subsidiary peaks. 10.3.2.3 Random Copolymers of Methyl Methacrylate and Styrene The effect of high-energy radiation on random copolymers of styrene and methyl methacrylate provides an excellent system for testing hypotheses for intra-
Btfrel
T / K
Figure 10.11 Decrease in radical concentration in poly(methyl methacrylate) after 1 kGy of y-irradiation at 77 K on progressive warming to 360K. The numbers refer to stages of radical reactions during wanning molecular and inter-molecular interactions of energy transfer and radical reactions. The ESR spectra of a series of copolymers of styrene and methyl methacrylate across the composition range between the two homopolymers are shown in Figure 10.13 after irradiation at 300K. The spectra show a progressive change between the spectra of the homopolymers, but it is apparent, e.g., considering the copolymers containing 20% and 50% of styrene, that the proportions of'styrene' radicals in the spectra are greater than the proportions in the compositions of the copolymers. Thus, there is a preference for the formation of styrene radicals. This effect has one component occurring during irradiation at 77 K (attributed to energy transfer) and another component occurring during warming to 300 K (or occurring during irradiation at 300K), which we have attributed to radical transfer reactions. This preference for the formation of styrene radicals is a manifestation of a protective effect by styrene units on the degradation of methacrylate units in the copolymer. The protective effect is also shown by the variation in the yield of radicals, G(R"), with the composition of the copolymer. Figure 10.14 shows how the value of G(R*) in the copolymers is always much less than the value which would be obtained from the additivity of the electron densities of the two monomer units. The protective effect is even greater at 300 K than at 77 K, which is consistent with the additional mechanism of protection which occurs above 77 K. 10.3.2.4 ESR and the Mechanism of Radiolysis
The number of different types of radicals observed in the ESR spectra of irradiated polymers is always greater after irradiation at 77 K than at 300 K. The
Figure 10.12 ESR spectra of polystyrene after y-irradiation in vacuum. Radiation dose 10OkGy; radiation temperature: (a) 77 K, (b) 300K
Scheme 2 ESR procedure of cryogenic trapping and thermal annealing to provide an understanding of reactions which occur rapidly during the irradiation of polymers at
0%STY
8% STY
20% STY
50% STY
100% STY
Figure 10.13 ESR spectra of random copolymers of styrene and methyl methacrylate after y-irradiation in vacuum at 300K. Radiation dose 3kGy. The compositions of the copolymers are specified in mol% styrene
G(R) G(R-)
% STYRENE
Figure 10.14 Protective effect against degradation by y-radiation provided by styrene units in random copolymers of styrene and methyl methacrylate, shown by the radical yields G(R#) derived from the ESR spectra, (a) Experimental values for y-irradiation at 77 K; (b) experimental values for y-irradiation at 300 K. The lines correspond to the G(R*) values for the copolymers calculated from the G(R') values for poly(methyl methacrylate) and polystyrene based on the additivity of electron densities
ESR spectra are usually similar after irradiation at 300K or irradiation at 77 K and warming to 300 K, although the concentrations of radicals may be different. A model for the mechanism of the radiolysis can then be deduced from the radicals which are observed at 77 K and the reactions which they undergo on warming. The procedure is outlined in Scheme 2.
10.4 CONCLUSIONS ESR provides a powerful technique for developing a fundamental understanding of the mechanism and kinetics of free radical polymerization and of the mechanism of degradation of polymers by high-energy radiation. The assignment of ESR spectra to component radicals and the measurement of the concentrations of these radicals require a variety of experimental and computational procedures, which have been greatly enhanced by improvements in spectrometer performance and computer capabilities.
10.5 ACKNOWLEDGEMENTS The authors are grateful to the Australian Research Council and the Australian Institute of Nuclear Science and Engineering for supporting this research, and to the Australian Nuclear Science and Technology Organization for the provision of irradiation facilities.
10.6 REFERENCES [1] P.B. Ayscough, Electron Spin Resonance in Chemistry, Methuen, London, 1967. [2] D.J.T. Hill, J.H. O'Donnell and PJ. Pomery, in Electron Spin Resonance, Royal Society of Chemistry Specialist Periodical Reports, Vol. i3A, Cambridge, 1992, p. 202. [3] O.F. Olaj, I. Bitai and F. Hinkelman, Makromol. Chem., 1987,188,1689. [4] T.P. Davis, K.F. O'Driscoll, M.C. Piton and M.A. Winnik, Macromolecules, 1989, 22, 2785. [5] S.K. Soh and D.C. Sundberg, J. Polym. ScL, Polym. Chem. Ed., 1982,20,1345. [6] MJ. Ballard, R.G. Gilbert, D.H. Napper, PJ. Pomery, P.W. O'Sullivan and J.H. O'Donnell, Macromolecules, 1986,19,1303. [7] G.T. Russell, D.H. Napper and R.G. Gilbert, Macromolecules, 1988, 21, 2141. [8] R.W. Garrett, DJ.T. Hill, J.H. O'Donnell, PJ. Pomery and CL. Winzor, Polym. Bull, 1989,22,611. [9] M. Dole (Ed.), The Radiation Chemistry of Macromolecules, Academic Press, New York, 1972. [10] R.W. Garrett, DJ.T. Hill, TT. Le, J.H. O'Donnell and PJ. Pomery, Radiat. Phys. Chem., 1992,39,215.
[11] DJ.T. Hill, S.Y. Ho, J.H. O'Donnell and PJ. Pomery, Radiat. Phys. Chem., 1990,36, 467. [12] T.G. Carswell, DJ.T. Hill, D.S. Hunter, PJ. Pomery, J.H. O'Donnell and CL. Winzor, Eur. Polym. J., 1990, 26, 541. [13] T.G. Carswell, DJ.T. Hill, D.I. Londero, J.H. O'Donnell, PJ. Pomery and CL. Winzor, Polymer, 1992,33,137. [14] T.G. Carswell, DJ.T. Hill, R. Kellman, D.I. Londero, J.H. O'Donnell, PJ. Pomery and CL. Winzor, Makromol. Chem., Macromol. Symp., 1991,51,183.
11 DYNAMICS OF BULK POLYMERS AND POLYMERIZING SYSTEMS AS STUDIED USING DIELECTRIC RELAXATION SPECTROSCOPY G. WILLIAMS, C. DUCH, J. FOURNIER and J. R. HAYDEN Department of Chemistry, University College of Swansea, Singleton Park, Swansea SA2 SPP, UK
11.1 INTRODUCTION
Dielectric relaxation spectroscopy (DRS), with its wide frequency range 10~6 to 1011 Hz, has been used for over fifty years as a leading method for studying the reorientational motions of molecules in the liquid, amorphous solid, crystalline and liquid-crystalline states [1-6]. Most of these studies involved point-by-point measurements of permittivity ef(co) and loss factor e"(a>) at chosen frequencies using different apparatus for each frequency range, e.g. transient current recorders, LCR impedance meters, microwave transmission lines and cavity resonators. Such difficult and tedious procedures hindered the progress of DRS in comparison with that made by other methods such as NMR, ESR, dynamic quasi-elastic light scattering in the time and frequency domains, quasielastic neutron scattering and time-resolved fluorescence depolarization (for accounts of such techniques applied to polymer science see ref. [7]). However, during the past eight years or so modern DRS equipment has appeared in the form of automatic-measuring LCR meters, transient equipment and time-domain reflectometry for microwave frequencies, which together with computer control and modern data-processing methods now provide techniques for the fast, accurate determination of permittivity and loss over the range 10 " 6 1010Hz. In addition to allowing conventional DRS studies of polymers to be made more conveniently, the new techniques allow studies to be undertaken that Polymer Spectroscopy. Edited by Allan H. Fawcett © 1996 John Wiley & Sons Ltd
were not practical hitherto, e.g. (i) for reasons of experimental time and (ii) for systems that change with time where manual point-by-point measurements are inappropriate. As a result, broad-band DRS now provides a powerful method for studying new problems in polymer science and takes its place alongside the other methods for studying polymer dynamics mentioned above [3, 8-10]. The present account summarizes briefly selected aspects of earlier DRS studies of polymers and of recent development, especially those concerning short- and long-range motions of chains and systems undergoing polymerization.
11.2 AMORPHOUS POLYMERS: PHENOMENOLOGICAL AND MOLECULAR ASPECTS The phenomenological theory of the dielectric relaxation behaviour of linear systems is well-established [1-5]. The fundamental relationship joining the frequency-dependent complex permittivity e(a>) measured at frequency / = o)/2n and the transient step-response function <j>(t) is the Fourier transform relationship
where e((o) = e'(co) — ie"{a>), e0 and S00 are the limiting low and high frequency permittivities and 3 indicates a one-sided Fourier transform; i = -y/—1. Thus measurements of e(a)) give information on (t) and vice versa through the inversion relationships [11] that follow from Equation (1). For a polymer material exhibiting multiple relaxation regions, multiple peaks will be observed in e"((o) and corresponding multiple decays will occur for (f>(t). For amorphous solid polymers, multiple relaxations have been observed and analysed in great detail [3, 12-17]. For T< Tr where Tg is the apparent glass transition temperature, a single broad /? process is observed. For T>Tg the OL process emerges from low frequencies, so that in a limited range both a and /? relaxations are observed in plots of e" vs. log/. As temperature is further increased, the a and fi processes tend to coalesce to form at high temperatures a single <xfi process, which is a continuation of the a process to higher frequencies, only now all of the relaxation strength is contained within the single process. This is the pattern of behaviour exhibited by all amorphous polymers, including the acrylates, methacrylates, halogen polymers, oxide polymers and polyesters, as we have described and discussed [12-17], including the effects of temperature and applied pressure [18-20]. Such behaviour is well-represented by the relaxation function [16-17]
№ = a(t)LAa + Afi0(tn where Aa + Afi=l
(2)
and <j>a(t) and
l
7
'
where /x,(0 is the dipole moment of group i along the chain at time t. The terms (/X1(O)^(O)) express the equilibrium angular correlations between dipoles i and j along a chain, and the magnitude of such terms decreases rapidly in magnitude for \i—j\ increasing [12, 34]. The terms are autocorrelation functions for the motions of dipole i, and are cross-correlation terms between dipoles i and j . For a bulk polymer or for a polymer in solution, it is normally assumed that the contributions to O(f) are dominated by intra-chain terms and that inter-molecular contributions are negligible. We may rewrite Equation (7) for the case of chains containing equivalent dipole groups as
W-W+frW
(8)
where atJ = / and , „, . , M Xii{t)= Xi t)=
' + WO)-^m
, Qa w (9a b)
'
Equations (8) and (9) give a clear physical insight into the molecular quantities that determine the dielectric properties of flexible chains in solution and in the bulk amorphous state. The autocorrelation functions XH(t) are equal for all i and dominate (t). The cross-correlation terms make a contribution weighted by the equilibrium factors a^ that are determined by average chain conformation. It has been reasoned [34, 37] that X{j(t)« A11-(O for amorphous polymers, so in this approximation fl) still await adequate descriptions using molecular theory, and this is a continuing challenge not only for the DRS of polymers but also for related relaxation and scattering phenomena in such systems. It may transpire that analytical models will not be successful, and that progress in understanding will come from simulations using molecular dynamics or Monte Carlo methods. In an attempt to deduce the form of dielectric a and P relaxations in amorphous polymers, Rosato and Williams [41] evaluated a multi-site barrier model which developed the early models of Bueche to the dynamical situation. Their theory gave (i) a cluster of 'fast' modes for the P process and (ii) a single mode at low frequencies for the a process. Although two relaxation regions are predicted, the low frequency process is not in accord with the experimental result, which gives a broad asymmetrical process of KWW type with j8«0.5. Jernigan [42] considered the model of conformational tran-
sitions for a flexible polymer chain involving a master equation in time of the form ^=TpW
(11)
where p(f) is a generalized probability of obtaining the different conformations at time t(f(t) is a vector of elementary probabilities) and T is a transition matrix that expresses the transition probabilities between conformational states. T involves the local energy barriers and energy differences between conformational states. The dielectric properties were calculated as , where P(t) is the dipole moment of a whole chain at time t. Jernigan deduced the dielectric properties of oc,co dibromide chains and found that was given by a weighted sum of exponential decay terms plus a constant value. The latter quantity has a value that is dependent on the choice of reference coordinates, and this is a basic problem with this theory. Jernigan [42] multiplied by a correlation function ov(t) for motions of the chosen reference coordinates, thus giving a decay to zero for the total correlation function, but this is artificial. Beevers and Williams [43] showed how changed when the reference coordinates were changed, demonstrating the inadequacy of this approach. The origin of the problem is clear: Equation (11) is a scalar equation but measured properties such as dielectric permittivity, Kerr constant, nuclear magnetization and fluorescence emission are related to time-correlation functions for the motions of molecular axes—which are vectorial or tensorial quantities. Although the Jernigan approach is inapplicable to the motions of chains in the bulk amorphous state or in solution, it would be applicable where the reference coordinates are well-defined, e.g. for a chain tethered to a surface.
11.3 CRYSTALLINEPOLYMERS Numerous account of the dielectric properties of partially crystalline polymers are available [3,12,14,17,44,45]. Two classes of partially crystalline polymers are important, those of high crystallinity, such as polyethylene, i-polypropylene and polyoxymethylene, and those having only a medium degree of crystallinity, such as the nylons and polyethylene terephthalate (up to « 50% crystallinity). Multiple relaxations are observed, e.g. lightly oxidized and lightly chlorinated polyethylenes have, in descending order of temperature, ac, /?a and yc relaxations. These have been documented by Ashcraft and Boyd [46] and others [3,4,5]. The <xc process in polyethylenes was first explained by Frohlich [47] using a chaintwist-assisted rotational model in an alkane crystal. Subsequently Hoffman et al. [44] and Williams et al. [48] extended the theoretical model and applied it successfully to polyethylenes and alkanes of different chain lengths. Further development of the chain-twist-assisted rotation and model was made by Mans-
field and Boyd [49], who carried out a computer simulation for a realistic model of a chain moving in the crystal. In all cases it is predicted that the average relaxation time for the ac process increases linearly with chain length for short chains, and that a plateau level is reached for long chains when chaintwisting becomes an essential part of the chain rotation mechanism. The /?a absorption in polyethylenes is generally accepted as being due to large-scale motions in the disordered phase [44,45,46], while the yc process is thought to be due to local motions in the amorphous phase [46] or to local motions in both amorphous and crystalline phases [44]. While many dielectric studies have been made of oxidized and chlorinated polyethylenes, we note that pure polyethylene would not give any dipole relaxation owing the low polarity of the methylene group. For polymers of medium degree of crystallinity, again motions in both amorphous and crystalline phases are observed [3,12,14,17, 23]. Polyethylene terephthalate (PET) is an interesting case, as samples can be obtained in the amorphous state by quenching from the melt or in the partially crystalline state by melt crystallization or quench annealing. Since partially crystalline samples are entirely composed of spherulites, it follows that the amorphous regions (up to 50% of polymer) are contained within the spherulites. Thus this is an 'abnormal amorphous phase', whose relaxation behaviour would be expected to be qualitatively different from that for a wholly amorphous polymer. This has been demonstrated to be the case from the dielectric measurements of Ishida (see [3,45] and subsequently of Tidy and Williams (see data reported in [12]). The amorphous PET exhibits a well-defined a dielectric relaxation, but the partially crystalline sample exhibits a broad a' relaxation whose frequency location is removed to lower frequencies when compared with that for the oc relaxation. Tidy and Williams followed the evolution of the a and a' relaxations in time as an amorphous material was annealed, leading to crystallization, above its T%. As the normal a process disappeared the a' process emerged, and grew as crystallization proceeded. This demonstrates that the 'amorphous' regions within the spherulites suffer a range of constraints imposed by the crystalline regions, giving a slower, broader a process than that for a normal amorphous phase. Thus real time dielectric studies are able to give information on the dynamics of the amorphous regions within spherulites that cannot be readily obtained through NMR and dynamic mechanical relaxation studies. For accounts of DRS studies of other crystalline polymers, including polyoxymethylene, polyvinylidene difluoride, polyvinyl fluoride and the nylons, the reader is referred to the text by McCrum et al. [3], the reviews [12-14,17,23,44, 45] and references therein. In all cases multiple dielectric relaxations are observed, arising from motions within crystals, on crystal surfaces and in the constrained amorphous regions within crystals. These processes are also observed in NMR and mechanical relaxation studies of such polymers.
11.4 LIQUID CRYSTALLINE (LC) POLYMERS Liquid-crystal-forming (mesogenic) groups may be incorporated into main chain, side chain or main chain and side chain, giving MCLC, SCLC and MCSCLC polymers respectively [50]. MCLC polymers show promise as high modulus, high melting thermoplastics, whereas SCLC polymers show promise as electroactive and electrooptical materials for optical data storage and non-linear optics [51]. For MCLC polymer the long stiff chains have only slight reorientational freedom in the LC or 'glassy' LC states, as has been shown from DRS studies [52,53]. Araki et al. [53] studied the following MCLC polymer where m is 2 or 3. For m = 3 a well-defined dielectric a process was observed having an apparent activation energy of 290 kJ mol ~ *. This material could not be aligned in directing electric fields [53].
Dielectric studies of SCLC polymers are more numerous (see [14], [54-60] and references therein). The dielectric behaviour of unaligned SCLC polymers gives little information on the underlying motions since the observed loss curves correspond to a superposition of several components. Alignment may be achieved using directing electric (E) or magnetic (B) fields or by surface forces.The alignment process in directing E fields is a dielectric phenomenon [58] and depends on the dielectric anisotropy Ae{a)) at the frequency / = a>/2n at which the E field is applied. Homeotropic (n\\Z) and planar ( n i Z ) alignments may be obtained by choice of the frequency of the directing E field. Here n is the LC director axis and Z is the laboratory axis defined as the normal to the parallel plates that confine the LC material. The two-frequency-addressing principle that leads to homeotropic (H) and planar (P) alignments for LC polymers has been reviewed [58]. Studies have been made of LCSC polymers of the following generic structures
where m denotes a spacer group; m typically lies in the range 2 < m < 12. R1 is H (for acrylates) or CH 3 (for methacrylates) and R2 is typically an alkylcyanobiphenyl group or an aromatic ester group, as follows
For such materials, which may be smectic or nematic liquid crystals, the dielectric properties of the LC phase are anisotropic. For a uniaxial LC phase, the dielectric tensor is diagonal such that
e((o) = diag [E1(O)), E1(G)), E1(O))]
where, for a material for which Ae(co) is positive at low frequencies, we find that S11(O)) and E1(O)) are measured for H-aligned and P-aligned samples respectively [58]. The permittivity E'(CO) and loss factor E"(O)) change markedly when a SCLC polymer is aligned in directing E fields or B fields [54-60]. As one example, Figure 11.1 shows plots of our recent results [61] for a carbon chain polymer having m = 2 and an alkyl cyanobiphenyl mesogenic head group in the side chain. The plot shows dielectric loss G/co = E"C0, where G is the equivalent parallel conductance of the sample and C 0 is its geometrical electrode capacitance, as a function of log(//Hz) and temperature for an unaligned sample (Figure 1 l.l(a)) and for the same sample that was aligned homeotropically using a low frequency E field (30Hz, 50 V across a 70 urn thick sample) (Figure ll.l(b)). For the unaligned sample one broad loss peak is observed, which moves rapidly to higher freqencies with increasing temperature. Only a slight change in property is observed when the material transforms from the LC state to the isotropic liquid at 89 0 C. Figure 1 l.l(b) shows data for the H-aligned sample. The loss peak in the LC state is nearly twice the height of that for the unaligned sample and much narrower, being only slightly broader than that for a single relaxation time process. As the clearing temperature Tc = 89 0 C is approached in the LC state there is a marked fall in the peak height to the level of that for the isotropic liquid. A part of the fall is due to the decrease in local order parameter S(T) as Tc is approached, and the remainder is due to the onset of the biphasic region, which in this case is restricted to « 2 0 C. These data serve to illustrate the anisotropic nature of molecular motions in LCSC and show (compare Figures 11. l(a) and (b)) that it is necessary to align samples macroscopically in order to reveal this property. DRS provides a particularly useful means of monitoring the nature and extent of macroscopic alignment in SCLC samples that have been subjected to E fields, B fields, surface forces or are aligning/disaligning after electrical and/or thermal treatments. As we have shown [56], the complex permittivity of a uniaxial sample of intermediate alignment is given, to a good approximation, by the linearaddition relationship E{O)) = (1 4- 2S d ) £|) M/3 + 2(1 - S6)E1(O))P
(12)
Here, S6 is a macroscopic director order parameter Sd = O c O S 2 ^ 2 - l > / 2
(13)
where 6nZ is the angle between a local director n and the laboratory Z axis (Z is
(GZo))ZpF
UNSUBTRACTED DATA FOR UNALIGNED LCP95
(GZ(O)/pF
UNSUBTRACTED DATA FOR HOMEOTROPIC LCP95
Figure 11.1 Plots of G/co = e"C0 as a function of log frequency/Hz and temperature for (a) unaligned and (b) homeotropically aligned SCLC polymer. Note the marked change in loss on melting the H-aligned material (Tc« 89 0C) and the lack of change on melting the unaligned material [61]
normal to the plane of the parallel electrodes, as described above). Thus Sd = 1,0, - 0 . 5 for H-aligned, unaligned and planarly aligned samples respectively. Application of Equation (12) using both its real part e'(ca) and/or its imaginary part s"(co) allows Sd to be determined for a sample of intermediate alignment if e\(co), s'^G)), e'±((o)9 and e'[(a>) are known. Two crossover frequencies occur at /', say, when s[((o) = ei(co), and at /", say when ej[(co) = el(cw). (Insertion of these conditions in Equation (12) show that e'((o) is independent of Sd for s'^co) = e'L(a>) and s"(co) is independent of Sd for ej,'(co) = £^(co)). The accuracy o the method for determining Sd can be checked via the consistency of Sd values determined at different frequencies through the spectral range, and this has been shown to be very successful in practice for siloxane polymers [54, 56, 57, 62]. Thus DRS provides a direct unambiguous means of determining the extent of macroscopic order, through Sd, in SCLC samples. We note that optical microscopy and infrared and Raman spectroscopy may not be used easily to monitor alignment in SCLC samples owing to the scattering of light by LC materials, but NMR provides a further method. Furthermore, DRS may be used to monitor the kinetics of alignment of SCLC polymers, as we have described [62, 63]. In our studies of a chiral nematic LC polymer, the changes of loss spectra with time as a sample realigned from P to H alignment in the presence of a steady d.c. E field were monitored, and were fitted using a continuum theory first described by Martins et al. [64] and further developed by Esnault et al. [65]. An important consequence of this theory is that it predicts that Sd reaches a plateau determined by the balance between dielectric forces (involving Ae £ 2 ) and elastic forces (involving elastic constants of the LC phase). It has been shown [58] that the ease of alignment in SCLC polymers is strongly dependent on chemical structure and the thermal/electrical treatments given to samples. In most cases it is difficult to align SCLC polymers in the LC state using directing E fields [56-58,66], so cooling from the melt with an a.c. E field of chosen frequency and amplitude may provide an alternative route— although dielectric breakdown is then a problem because E fields of 100 V/50 ^m are required, typically, in order to achieve full H of P alignment. An 'electrical cleaning' method may be used to reduce the extrinsic conduction of melt samples and hence to allow the sample to sustain higher aligning E fields in the melt before breakdown occurs (see [58] and references therein for a review). In addition to providing a method for determining the alignment of SCLC samples, DRS data also give information on the anisotropic reorientational dynamics of the dipolar mesogenic groups in a LC polymer. As we have shown [57,67], the generalization of the earlier theories [68,69] of dielectric relaxation of low molar mass liquid crystals can be achieved in the following way. The field-free orientation distribution function /°(Q 0 ) a f l d the field-perturbed orientation distribution function fE(Cl0) of mesogenic groups may be written as
expansions involving the Wigner rotation matrix elements DQ 0 as follows QO / 9 J
- L i X
-
AQ 0 ) = A Z - J V pJooDoo("o) j=0\
™
(14)
/
AOo) = *(l+^+-)AQo)
(15)
where A and B are normalization constants, D 0 0 are order parameters and D 00 (Q 0 ) describes the orientations of mesogenic dipolar groups (each of dipole moment fi) in Euler space with respect to the laboratory frame. When the dipolar units reorientate in the LC potential, the conditional probability of finding the dipole group in the orientation around Q at time t given that it was around the orientation Q0 at t = O is given formally by the further expansion
f(0,t/Qo,0) = S I Z DUO 0 )DL(O)GLW
and scattering angle 0 can be calculated from the dimensionless angular gaing (which is approximately the ratio of the intensity of the scattered light to the incident
Potariser
Laser
Sample Analyser
Detector Plane
Figure 12.1 Schematic of small angle light scattering experiment: scattering angle = 0; the azimuthal angle <j> is measured from the plane of polarisation of the incident light light intensity). G^ = ( I A V ) I S 1 - S 2 I 2 sin 2 20 GVv = (4AV)IS 1 Sm 2 + S2COs2 \2 and k = 2nlk (Vv, vertically polarised incident light, vertically polarised scattered light). The Rayleigh-Gans-Debye approximations are the most easily handled expressions for S1 and S2. Isotropic sphere 2/fcV 5 1 = — — Ox— l)(sinu —MCOSM)
5 2 = S1COsO V = wm/ns with nm and ns being the refractive index of the matrix and the sphere respectively.
Anisotropic sphere 2ik3r3 51 =
3
{3(/x— l)(sinw —MCOSW) + A / * [ u c o s K - 4 s i n u + 3Si(u)]}
2ifc3r3 52 =-^~3-{3(/I- I)(sinu-Mcosw)cos0- A^(I + cos2(0/2))(wcosw-4sinwSi(u))} where jx = (nr + 2nt)/3nm, Afi = (nr — nt)/nm, nT is the radial refractive index, nt the tangential refractive index, and Si(u) is the sine integral of u. For both cases r is the radius of the sphere and u = An/X r sin(Q/2), with A being the wavelength of light in the scattering polymer film. Figure 12.2 shows the form of the scattering for both isotropic and anisotropic spheres and Hv scattering. Note that both show a maximum scattering disposed in lobes at azimuthal angles of n/4. Figure 12.3 shows the intensity variation with u along one such lobe; again both have the same qualitative features, i.e. a maximum at a defined value of u. For
Figure 12.2 (Continued)
Figure 12.2 Contour plots of Hv scattered light intensity from (a) optically anisotropic spheres (b) optically isotropic spheres; x = r sin 2)TtP = 0, and they define the locus of the spinodal curve. This curve is the limit of stability of the mixture, i.e. within the curve the mixture is unstable to any fluctuation and demixing (spinodal decomposition) takes place spontaneously. Between the coexistence curve and the spinodal curve there is a metastable region wherein large fluctuations are necessary to initiate demixing, usually via a nucleation and growth process (Figure 12.6). Both curves meet at the critical temperature where (d2AG/d2)Tp = (d3AG/d3)Tp = 0. If a compatible blend is quenched into the spinodal region, phase separation takes place and the kinetics of the demixing are describable by the linearised Cahn-Hilliard theory of spinodal decomposition, which gives the time dependence of the composition variation as [22] (d/dt)TtP = M(d2Ald2)T%pV24> - 2 M X V 4 0 where M is the mobility of the polymer and KV2<j> is the free energy density
Temperature (K)
binodal spinodal
Figure 12.6 Schematic phase diagram for polymer-polymer mixtures
gradient due to composition gradients. The solution to this equation is a Fourier series describing the compositional fluctuations in the system, i.e. the local compositional deviations from the average value, and these fluctuations are the source of the scattered light intensity. Since light scattering is described in Fourier space terms, the solution to the Cahn-Hilliard equation is also needed in Fourier space, Le. in terms of a wave vector, where the wave vector is (In/X) and X is the concentration fluctuation wavelength. The intensity of light scattered from the phase-separating mixture is proportional to the square of the fluctuation amplitudes and is given by: / ( a 0 = /(Q^ = 0)exp[2R(Q)r] where Q is the scattering vector = Ann sin(0)/Ao, with n the refractive index of the sample, 20 the scattering angle and X0 the wavelength of light in vacuo. The term R(Q) is known as the amplification factor and R(Q) = - M(d2A/d2)TtPQ2 - 2MKQ* In the phase-separating system, there will be a most probable composition
10- 3 Q(Cm- 1 )
Figure 12.7 Scattered light intensity (Vv conditions) as a function of angle for different times for a phase-separating mixture of polystyrene and polyvinyl methyl ether. Times after start of phase separation (seconds) A 2 +20 D40 O60 V 10 x 30 O 50 • 70
10ln(I(Q max )
Time (S)
Figure 12.8 Exponential dependence of scattered light intensity for a phase separating mixture of polystyrene and poly vinyl methyl ether at Qmmx fluctuation wavelength which will grow preferentially as phase separation proceeds. This leads to a maximum in the observed scattered intensity at a finite value of Q. The position of this intensity maximum does not alter as in the early stages of phase separation but increases in intensity as phase separation proceeds. At late stages in the phase separation, there is a coalescence of particles via Ostwald ripening and the maximum will shift to lower Q values. During the early stages, at a fixed value of Q, the scattered light intensity from a spinodally decomposing system should increase exponentially with time, and from this relationship the amplification factor can be obtained. A set of light scattering data for a demixing polystyrene/polyvinyl methyl ether (PVME) mixture collected at discrete time intervals is shown in Figure 12.7 [23]; the dependence of the scattered intensity on time at the Q value (Qmax) where the maximum intensity is seen is shown in Figure 12.8. From values of R(Qn^x) the effective diffusion coefficient De, can be obtained, as Dt = 2R(QmAX)/Qliax. At the spinodal curve Dt = 0, and thus if Dc is obtained for a series of composition and over a range of temperatures, the spinodal curve can be obtained. Figure 12.9 shows values of Dc as a function of temperature obtained for the mixture of polystyrene and PVME referred to earlier, and the spinodal curve predicted from these data is given in Figure 12.10. Light scattering investigations of other demixing polymers have been reported elsewhere [24, 25] and recently a very sophisticated instrument for such studies has been described [26].
1O10C-D9)Cm2S'1
PS(2)/PVME
Temperature (K) Figure 12,9 Effective diffusion coefficient as a function of temperature
B
PS(2)/PVME
TEMPERATURE (K)
cloud point curve
WEIGHT FRACTION PS
Figure 12.10 Spinodal curve (•) predicted from temperature dependence of Dc for polystyrene/polyvinyl methyl ether mixtures
123 QUASI-ELASTIC LIGHT SCATTERING (QELS) 12.3.1 DILUTE POLYMER SOLUTIONS Light scattering by polymers in solution is not a perfectly elastic process, small amounts of energy being transferred between molecules and photons. This energy transfer leads to a broadening of the frequency of the scattered light relative to the incident light, and the intensity variation of the scattered light over a frequency range from — oo to + oo is the spectral density or power spectrum, which is given by I((o) = 1/2« I °° < E*{t)E{t + T) > exp iojTdt where is the electric field autocorrelation function gt(t). In quasi-elastic light scattering (QELS) what is actually obtained as the output from the photomultiplier tube is the unnormalised intensity autocorrelation function G2(t\ and G2(t) = A + [Bg 1 (O] 2 (homodyne) where A is a constant background intensity to which the correlation function decays after a suitably long delay time f, and B is a constant close to unity. If we have a single species in the solution, e.g. a monodisperse polymer, and there are only concentration gradient relaxation processes, then ^1(O = exp(-Ff) and F l is the relaxation time of the diffusive process of the polymer down the concentration gradients; F = DQ2 with Q = (4nn/Xo)sin(0/2) and D is the translational diffusion coefficient. For polymer solutions, D is concentration dependent D = D 0 (l + fcDc) where D 0 is the infinite dilution value of D and c is the concentration of polymer. The term kD is composed of thermodynamic and factional parameters for the polymer in the particular solvent conditions investigated. Polymers are not often monodisperse, and each different relaxation time will make a contribution to the observed average F. A popular method of obtaining the diffusion coefficient is to use the cumulants approach outlined by Koppel [27] and the algorithm of Pusey et al. [28] In Q1(Z) = - T11 + (F2/2!)r2 - (F3/3!)r3 + • • • Generally only the first two cumulants can be extracted from the correlation functions with any confidence, and TJQ2 = D29 the z-average diffusion coefficient. About 12 years ago, Burchard et al. [29] showed that r JQ2 = D(I+
CR2Q2)
Hq 2 XiO 8 (Cm 2 S 1 )
Cj 2 XiO- 10 ^kC(Cm 2 )
Figure 12.11 Dynamic Zimm plot for polystyrene in toluene. Reproduced with permission of the American Chemical Society from ref. [29] where R9 is the radius of gyration of the polymer molecule and C is a parameter related to the molecular architecture and the thermodynamic environment. Incorporating the concentration dependence of D, TJQ2 = D0(I + kDc)(l + CRlQ2) Thus, as c->0 and Q->0, TJQ2 = D 0 and D 0 , kD and C can be obtained from a 'dynamic' Zimm plot (Figure 12.11). The slope of the line dependent on Q2 alone is CR2, whereas the slope of the line dependent on c only is DokD. Thus method has not been widely used; however, it has been applied to naturally occurring polymers to extract C and thus to enable something to be said about their structure. We noted earlier that each relaxation time will contribute to T and hence influence the shape of the correlation function. Consequently, all the information on polymer polydispersity is contained within the intensity correlation function because D is proportional to (molecular weight)"0. The extraction of the molecular weight distribution from the correlation function is an 'ill posed problem', as there are an infinite number of solutions to the Laplace inversion of the data that is required to obtain the distribution. Several attempts have been made at developing suitable computational methods to derive a distribution from a correlation function. Perhaps the most widely known and used is the constrained regularisation programme CONTIN [30,31]. In many cases the programme works well, but care has to be taken in choosing the right range of D to explore for a solution, and the original data must be of high quality, as 'noisy' data can lead to artefacts in the analysis. A comparison of CONTIN with maximum entropy methods has recently been published [32].
Relative Contribution
Diffusion Coefficient (cm 2 s'x)
x1
°
Figure 12.12 Distribution in diffusion coefficients for an aromatic terpolyester in a mixed solvent of trifluoroacetic acid and dichloromethane obtained by CONTIN analysis of quasi-elastic light scattering data Obtaining molecular weight distributions by this means has two benefits. Firstly, with a high power laser light source on the correlator and with fast data links to a work station, a full molecular weight distribution can be obtained in «2min. The second benefit is when only ferocious solvents are available, ones which would destroy size-exclusion chromatography (SEC) column packings; quasi-elastic light scattering then becomes a highly suitable method to obtain a molecular weight distribution. An example of this is the aromatic terpolyester prepared from hydroxybenzoic acid, isophthalic acid and hydroquinone [33], which is soluble in a mixture of trifluoroacetic acid and methylene chloride. The low refractive index of the solvents and the high refractive index of the polymer make the solutions extremely strong scatterers of light and ideal for CONTIN analysis, even with only a modest laser. An example of the distribution in diffusion coefficients (and hence molecular weight) is shown in Figure 12.12.
12.3.2 GELS A cross-linked polymer swollen by a solvent constitutes a gel, and if swollen sufficiently the concentration of polymer in the gel is that of a semi-dilute
solution, i.e. it is between c* and c** as defined by de Gennes. The gel has continual local fluctuations in the degree of swelling (equivalent to polymer concentration) which lead to variations in the local osmotic pressure. The analysis of the intensity correlation function obtained from the scattering of light by these fluctuations produces a co-operative diffusion coefficient. The first QELS experiments on gels and the theoretical analysis of the data were reported over 20 years ago by Tanaka et al. [34]. They showed that at a delay time of zero (i.e. extrapolating the correlation functiion to t = 0), the scattered light intensity above the background was equal to the osmotic moldulus Mos (= Kos + 4Gos/3 where Kos is the bulk osmotic modulus and Gos is the shear osmotic modulus), also known as the longitudinal modulus. The co-operative diffusion coefficient is given by DC = (KOS + 4GOS/3)(1 -p)/f where cf)p is the volume fraction of polymer in the gel and / is the total friction of the polymer against the solvent per unit volume / = CeNAc/m where c is the polymer concentration in gml" 1 , m is the monomer molecular weight, and £c is the monomeric friction coefficient at concentration c. Since the first report there have been many papers published on light scattering from polymer gels, the work of Geissler and Hecht on polyacrylamide gels [35-39] being noteworthy. Measurements [40, 41] obtained on radiation cross-linked polystyrene gels subsequently swollen in cyclohexane at different temperatures exemplify the type of results obtained. A typical correlation function is shown (Figure 12.13) in which the ordinate axis was calibrated directly in terms of osmotic modulus using data obtained by Scholte [42] from ultracentrifugation analysis of polystyrene solutions. Scaling relationships can be used to interpret the dependence of Mos
and Dc o n p. The dependence of Dc on the volume fraction of the polymer in the gel varied markedly with the temperature (Figure 12.14), whereas the osmotic modulus for these same gels could be fitted by the same scaling relationship Mos = 4.7 x 1 0 6 ^ 6 N m - 2 Scaling laws predict that the exponent of 0 p for Mos should vary from 2.25 in good solvents to 3 in theta solvent conditions; for the concentration dependence of diffusion coefficients the same exponents are 0.75 and 1 respectively. At 308 K an exponent of 1.17 was observed, which within the experimental error agreed with predictions. However, at 333 K, the exponent was 0.46, much lower than theory predicts. This observation and the high exponent observed for Mos were attributed to the presence of dangling chains in the network, since the correlation functions were observed to become more non-exponential as the temperature
Intensity (a.u.)
T = 308K Solvent C6H12
Baseline
Time (jus) Figure 12.13 Intensity autocorrelation function obtained for a randomly cross-linked network of polystyrene swollen in cyclohexane at 308 K was increased. Increased non-exponential behaviour has been identified with the overlapping of molecules and appears to be possible only when there are many loose dangling chains.
12.3.3 SEMI-DILUTE S O L U T I O N S A N D TRAPPED CHAINS The broad outlines of reptation theory are well known, and the detailed theory is available elsewhere [43,44]. Essentially, a polymer molecule in a melt is confined to a tube which is defined by the surrounding molecules, and can only move along the tube axis. The time dependence of the various dynamic modes of the molecule in the tube has been discussed by Doi and Edwards [45]. Additionally, de Gennes [46] has set out equations which relate the translational diffusion coefficient of a probe polymer to its molecular weight (Mp), the entanglement molecular weight of the matrix (MJ and the molecular weight between cross-links (AfJ. Three regimes are predicted: 1. Free draining (A/p < Afc, Afp > AfJ, D = D0M; K
DJm2S'1)
Figure 12.14 Co-operative diffusion coefficient as a function of volume fraction of polymer in cyclohexane swollen polystyrene networks; (o) 308 K, (o) 318 K, (•) 333 K 2. Simple reptation (M p > Me, M c > Mc), D = D0M tM; 2. 3. 'Strangulation' regime (Me > Mc, M p > Mc), Dt = D0M0M;
2
.
Attempts have been made at observing these regimes using semi-dilute solutions of a matrix polymer with a chemically identical probe of a different molecular weight incorporated in the solution. The conclusion of these experiments was that the reptation theory was inappropriate for such semi-dilute solutions [47,48]. A possible explanation for the failure of reptation theory may be in the recent analysis of Wang [49-51]. He shows that the quasi-elastic light scattering from a semi-dilute solution has contributions from both concentration fluctuations and density (pressure) fluctuations, and consequently the long time viscoelastic relaxation spectrum, usually observed by dynamic mechanical means, will also contribute to the autocorrelation function. The extent to which both contributions are seen depends on the frequency distribution of the stress relaxation modulus and a coupling parameter j8 (proportional to the partial
log[D t <M x >/M x ]
log M Figure 12.15 Diffusion coefficient of polystyrene tracer in polyvinyl methyl ether gels as a function of tracer molecular weight. Diffusion coefficients normalised by ratio of molecular weight between crosslinks of gels. Reprinted with permission from [52]. Copyright 1992 American Chemical Society
specific volume of the polymer minus the partial specific volume of the solvent). Very recently, QELS investigation of reptation predictions has been made using randomly cross-linked networks containing chemically distinct trapped chains. Rotstein and Lodge [52] prepared polyvinyl methyl ether gels containing trapped polystyrene chains, and obtain tracer diffusion coefficients for the toluene-swollen gels. Values of M c were calculated from swelling data, and 4 x 10³ ^ Mc ^ 14 x 103. Figure 12.15 shows the diffusion coefficient data normalised by the ratio of the M c values for the three networks involved. There appears to be little or no influence of Mc even when M p » Me; furthermore, the probe molecular weight dependence of D (DocM~2S) is much stronger than predicted by reptation theory. Pajevik et al. [53] prepared randomly cross-linked polymethyl meth'acrylate gels containing polystyrene probe molecules. Their results are shown in Figure 12.16. When M p < Mc («80000) then D scales as Mp ° 6; above this molecular weight the influence of M p is marked and D scales as M~ l'*±°-29 i.e. almost exactly in agreement with reptation theories, CONTIN or an equivalent program was used in both investigations, and the isorefractivity of toluene with polyvinyl methyl ether and polymethyl methacrylate aids the
D*/D0
Mp
Figure 12.16 Ratio of polystyrene tracer diffusion coefficient (D1) in toluene swollen PMMA gel to diffusion coefficient of polystyrene in dilute toluene solution (•); (A) values for PS tracer in PMMA solutions. Reproduced with permission from the American Chemical Society from Ref. [53] process of extracting the probe diffusion coefficient. However, about 14 years [54] ago it was noted that, when polystyrene was dissolved in a semi-dilute benzene solution of polymethyl methacrylate, the value of D decreased as the polymethyl methacrylate concentration increased, i.e. rather similar to the molecular weight dependence seen by Pajevik et al, and this may be due to polymer-polymer interactions. To overcome these possible complications, polystyrene networks with trapped polystyrene molecules have been prepared [55] and are currently being investigated.
12.3.4 SURFACE QUASI-ELASTIC LIGHT SCATTERING (SQELS) A liquid surface is continually roughened by thermal excitations, which give rise to the hydrodynamic modes known as capillary waves. The r.m.s. amplitudes of the waves are small ( « 2A) but they are efficient light scatterers. The displacement of the liquid surface from its equilibrium position by a wave propagating in the x direction is: C(x,r) = C 0 exp(/ex-ho)0 where Q is the surface wavenumber or the scattering vector parallel to the liquid surface. The wave frequency o is a complex quantity given by a>0 + iT, where co0 is the capillary wave frequency and F is the decay rate of the waves. A dispersion equation relates co and Q, and for pure liquids the controlling factors (for fixed Q)
are the kinematic viscosity and the surface tension [56]. For most instruments the accessible range of Q is 100-2000Cm"1 and hence the wavelengths probed are « 600-30 /mi. If a polymer film is spread on the surface of the liquid, additional hydrodynamic modes modify the dispersion equation. Only the transverse modes (capillary waves) scatter light, but there is coupling with the longitudinal or dilational modes, and hence in principle some information is obtainable on both modes from the power spectrum of the scattered light. The parameters obtainable are the surface tension y and the dilational modulus e; both of these are viscoelastic properties, as energy dissipation takes place in the relaxation processes, and thus y = y0 + icoy' e = 6 0 + icoe'
where y0 and £0 are the static surface tension and dilational modulus I — I, \ A aA J y' is the transverse shear viscosity and e' is the in-plane dilational viscosity. Although direct measurement of the frequency broadening of the scattered light by the capillary waves has been used, the frequency shifts are rather small, and a more direct means of observing the frequency of the capillary waves is to use heterodyne quasi-elastic light scattering [57,58]. The experimental arrangement to collect such data is shown in Figure 12.17; the diffracted beams produced
Laser
rough
PM Tube
Figure 12.17 Schematic diagram of surface quasi-elastic light scattering apparatus. Ll, L2 = lenses, T = transmission grating, F = neutral density filter, Ml, M2, M3, M4 = mirrors
Normalised correlation function
Time (us)
Figure 12.18 Heterodyne correlation function for syndiotactic polymethyl methacrylate spread on water at a surface concentration of 1.7mgm~2 by the transmission grating act as the reference beam of zero frequency shift, and this beats with the scattered light at the photocathode to produce the typical correlation function shown in Figure 12.18. From these data the capillary wave frequency co and the decay constant F can be obtained. By assuming that y and e! are zero, y0 and e0 can be obtained from these values by solving the dispersion equation. Extracting the viscous moduli requires a non-linear least squares fit of the Fourier transform of the power spectrum equation to the data. A computational method for this process has been developed by Earnshaw et al. [59] and exhaustively justified [60]. Wider aspects of light scattering from liquid surfaces are discussed in the book edited by Langevin [61]. To date much of the work published on SQELS from spread polymers has emanated from Yu and colleagues [62-65], but assumed that the viscous moduli are zero. We have reported [66] a limited study of spread polymethyl methacrylates and polyethylene oxide. Figure 12.19 shows the variation in surface tension, shear viscosity and dilational modulus obtained from SQELS data as a function of surface concentration. The viscoelastic moduli both show maximum values at finite values of the surface concentration. As the capillary waves generate oscillatory stress and strain, these are related via the complex dynamic modulus of the surface a* =y*[G'(co) +iG"(co)]
Surface tension (mN nrr1) Shear viscosity (mN s rrr1)
Surface concentration (mg nrr2)
Surface concentration (mg m*2) Figure 12.19
(Continued)
Dilational modulus (mN nrr1)
Surface concentration (mg nrr2)
Figure 12.19 Derived parameters from surface quasi-elastic light scattering as a function of concentration of polymethyl methacrylate spread on water: (a) surface tension; (b) surface shear viscosity; (c) dilational modulus
where <x* is stress, y* is strain, G'(co) is the storage modulus (surface tension) and G"(a>) is the loss modulus (a>yf). Using volume fraction composition data obtained from neutron reflectometry on the spread polymer films, it is evident that the surface film loss modulus is linearly dependent on the volume fraction of polymer in the film. If we presume that the relaxation process in the surface film is described by a Maxwell model, then G'(co) = Ge + GCO2T2/(1 + CO2T2)
where Ge is the elastic modulus at co = O, i.e. the static surface tension. Further, if there is only one relaxation process in the spread film, then T = A7c/co2y' where An is the difference in the surface tensions measured by SQELS and from static (Wilhelmy) plate methods. The dependence of relaxation time on the volume fraction of the polymer shows an exponential increase, Figure 12.20. To obtain further insight into the relaxation mechanism requires the frequency dependence (i.e. different Q values) of the transverse shear viscosity to be known.
Relaxation time (s)
SYN PMMA SQELS DATA
VoI fraction of polymer
Figure 12.20 Relaxation time for spread polymethyl methacrylate as a function of volume fraction of polymer in the spread film
12.4 CONCLUSIONS An overview of some of the areas where light scattering has made contributions to polymer science has been given. The emphasis has been on dynamics, either by using light to follow a process (crystallisation or phase separation) or using dynamic light scattering per se. A broad range of polymer types and situations has been covered and the discussion has by no means been exhaustive. Evidently, despite its maturity as a laboratory technique, light scattering is still capable of providing much information on polymer systems. Furthermore, the development of newer applications such as surface quasi-elastic light scattering will enable investigations of surface gelation and surface ordering in polymer solutions, areas which have yet to be investigated.
12.5 REFERENCES [1] M.B. Huglin (Ed.), Light Scattering from Dilute Polymer Solutions, Academic Press, London, 1972. [2] P. Kratochvil, Classical Light Scattering from Polymer Solutions, Elsevier, Amsterdam, 1987.
[3] [4] [5] [6] [7] [8] [9] [10] [11] [12] [13] [14] [15] [16] [17] [18] [19] [20] [21] [22] [23] [24] [25] [26] [27] [28] [29] [30] [31] [32] [33] [34] [35] [36] [37] [38] [39] [40] [41] [42] [43] [44]
H. Yamakawa, Modern Theory of Polymer Solutions, Harper, New York, 1971. GC. Berry, J. Polym. ScL, Polym. Symp., 1978,65,143. W.R. Krigbaum and G. Brelsford, Macromolecules, 1988, 21, 2502. Z. Tuzar, P. Kratochvil and D. Strakova, Eur. Polym. J., 1970,6,1113. BJ. Berne and R. Pecora, Dynamic Light Scattering, Wiley, New York, 1976. K.S. Schmitz, An Introduction to Dynamic Light Scattering by Macromolecules, Academic Press, San Diego, 1990. R.S. Stein and JJ. Keane, J. Polym. ScL, 1955,17, 21. R.S. Stein and M.B. Rhodes, J. Appl. Phys., 1960, 31,1873. R.S. Stein, P. Erhardt, JJ. van Aartsen, S. Clough and M. Rhodes, J. Polym. Sci. C, 1965,13,1. RJ. Samuels, J. Polym. Sci. C, 1965,13, 37. G.E. Wissler and B. Crist, J. Polym. Sci., Polym. Phys. Ed., 1985, 23, 2395. M. Ree, T. Kyu and R.S. Stein, J. Polym. ScL, Polym. Phys., 1987, 25,105. J.V.Champion,A.KilleyandG.H.Meeten,J.Polym.ScL,Polym.Phys.Ed., 1985,23, 1467. G.H. Meeten and P. Navard, J. Polym. ScL, Polym. Phys., 1989, 27, 2023. M. Desbordes, G.H. Meeten and P. Navard, J. Polym. ScL, Polym. Phys., 1989, 27, 2037. P.H. Richardson and R.W. Richards, unpublished work. WT. Culberson and M.R. Tant, J. Appl. Polym. ScL, 1993,47, 395. P.H. Richardson, ubpublished results. J.C. Schultz, Polymer Materials Science, Prentice-Hall, New Jersey, 1974. J.W. Cahn and J.E. Hilliard, J. Chem. Phys., 1958,28, 258. J.G. Connell, Ph.D. Thesis, University of Strathclyde, 1989. H.L. Snyder and P. Meakin, Macromolecules, 1983,16, 757. T. Hashimoto, M. Itakura and N. Shimidzu, J. Chem. Phys., 1986,85,6773. A. Cumming, P. Wiltzius, F.S. Bates and J.H. Rosedale, Phys. Rev. A, 1992, 45, 885. D.E. Koppel, J. Chem. Phys., 1972,57,4814. P.N. Pusey, D.E. Koppel, D.W. Schaefer, R.D. Camerini Otero and S.H. Koenig, Biochemistry, 1974,13, 952. W. Burchard, M. Schmidt and W.H. Stockmayer, Macromolecules, 1980,13,1265. S.W. Provencher, Comput. Phys. Commun., 1982,27, 213. S.W. Provencher, in E.O. Schulz-DuBois (Ed.), Photon Correlation Techniques in Fluid Mechanics, Springer, Berlin, 1983. S.W. Provencher, in S.E. Harding, D.B. Sattele and V.A. Bloomfield (Eds.), Laser Light Scattering in Biochemistry, Royal Society of Chemistry, Cambridge, 1992. A.D.W. McLenaghan, Ph.D. Thesis, University of Strathclyde, 1990. T. Tanaka, L.O. Hocker and G.B. Benedek, J. Chem. Phys., 1973,59, 5151. E. Gleissler and A.M. Hecht, J. Phys. (Paris) Lett., 1979,40, L173. A.M. Hecht and E. Geissler, J. Phys. (Paris), 1978, 39, 631. A.M. Hecht, E. Geissler and A. Chosson, Polymer, 1981,22, 877. E. Geissler and A.M. Hecht, J. Chem. Phys., 1982, 77,1548. EJ. Amis, P.A. Janney, J.D. Fery and H. Yu, Macromolecules, 1983,16,441. N.S. Davidson, Ph.D. Thesis, University of Strathclyde, 1984. N.S. Davidson, R.W. Richards and E. Geissler, Polymer, 1985, 26,1643. T.G. Scholte, J. Polym. ScL A2, 1970,8, 841. W.W. Merrill and M. Tirrell, in G.R. Freeman (Ed.), Kinetics of Nonhomogeneous Processes, Wiley, New York, 1987. T.P. Lodge, N.A. Rotstein and S. Prager, Adv. Chem. Phys., 1990,79,1.
[45] M. Doi and S.F. Edwards, The Theory of Polymer Dynamics, Oxford University Press, Oxford, 1986. [46] P.G. de Gennes, Macromolecules, 1986,19,1245. [47] W. Brown and P. Zhou, Macromolecules, 1989, 22, 3508. [48] T. Nicolai, W. Brown, S. Hvidt and K. Heller, Macromolecules, 1990,23, 5088. [49] CH. Wang, J. Chem. Phys., 1991,95, 3788. [50] CH. Wang, Macromolecules, 1992, 25, 1524. [51] CH. Wang and X.Q. Zhang, Macromolecules, 1993,26, 707. [52] N.A. Rotstein and T.P. Lodge, Macromolecules, 1992, 25,1316. [53] S. Pajevic, R. Bansil and C Konak, Macromolecules, 1993, 26, 305. [54] AJ. Hyde, J. Hadgraft and R.W. Richards, J. Chem. Soc. Faraday Trans II, 1979,75, 1495. [55] D.A. Davison, University of Durham, work in progress. [56] J.C Earnshaw and R.C McGivera, J. Phys. D, 1987,20, 82. [57] S. Hard and R.D. Neuman, J. Colloid Interface ScL, 1981,83, 315. [58] J.C. Earnshaw, in CA. Croxton (Ed.), Fluid Interfacial Phenomena, Wiley, New York, 1986. [59] J.C Earnshaw, R.C McGivern, A.C McLaughlin and P. J. Winch, Langmuir, 1990, 649. [60] J.C. Earnshaw and R.C. McGivern, J. Colloid Interface ScL, 1988,123, 36. [61] D. Langevin (Ed.), Light Scattering by Liquid Surfaces and Complementary Techniques, Dekker, Basel, 1992. [62] M. Kawaguchi, M. Sano, Y.-L. Chen, G. Zografi and H. Yu, Macromolecules, 1986, 19, 2606. [63] M. Kawaguchi, B.B. Sauer and H. Yu, Macromolecules, 1989, 22,1735. [64] B.B. Sauer, M. Kawaguchi and H. Yu, Macromolecules, 1987, 20, 2732. [65] K.-H. Yoo and H. Yu, Macromolecules, 1989, 22,1989. [66] J.A. Henderson, R.W. Richards, J. Penfold and R.K. Thomas, Macromolecules, 1993, 26,65.
13 NEUTRONSCATTERING FROM POLYMERS A. R. RENNIE Polymers and Colloids Group, Cavendish Laboratory, University of Cambridge, Madingley Road, Cambridge, CB3 OHE, UK
13.1 INTRODUCTION In the space of a few pages it would be impossible to provide a full description of the different investigations of polymers that can be made, or even have already been made, using neutron techniques. The intention is rather to provide an introduction to the methods. Those readers who may wish to exploit the special advantages of neutrons will be able to assess the feasibility of experiments and find some guide to the recent literature. The description of published work will necessarily be selective and will try to reflect some of the wide range of studies that are now in progress. There are several reviews of both the technique of neutron scattering and its application to the study of polymers. Although both provide little information about work on polymers, readers interested in a thorough description of the theory of neutron scattering should refer to the books by Lovesey [1] and Squires [2]. Reviews and books concerning neutron studies of polymers can be divided into those that are concerned with the technique [e.g. 3-5] and those that describe results, often in particular areas of the topic such as copolymers [6], networks [7], polymer motion [8-11], semi-crystalline polymers [12], polymer colloids [13] and biopolymers [14].
13.2 THE PRINCIPLES OF NEUTRON SCATTERING The scattering of neutrons can be treated formally as an inversion problem: the scattered intensity from a plane incident beam of wavelength A into a solid angle dQ, in the energy range d£, at a scattering angle 6 can be expressed as the Fourier transform in space and time of the pair correlation function of scattering length density. In this respect the theory of neutron scattering is identical to that of weak scattering of any other form of radiation. The advantages of neutron scattering Polymer Spectroscopy. Edited by Allan H. Fawcett © 19% John Wiley & Sons Ltd
arise from the magnitudes of the quantities mentioned above and their interrelationships. For example, the large mass of the neutron when compared with electrons or photons is important in providing good coupling between molecular motion and the energy of the scattered beam. In the next few paragraphs some of the formalism associated with the description of scattering will be presented. Further details of the principles of scattering and the properties of neutrons will be found in books on atomic physics such as that by Born [15]. Many people will not be concerned with such fundamentals of the theory, and the interpretation of many experimental results can be adequately performed using the simple relationships that derive from appropriate integrations of the wave equations. Some of these are described in the next section. It is first useful to recall that the neutrons can be considered as either particles or waves; the connection between the two descriptions is provided by the de Broglie relationships: E = hv p = hk/2n
(1) (2)
where E is the energy, p is the momentum (product of mass and velocity v), v is the frequency and k is the wave vector of the neutron. The magnitude of the wave vector is given by |k| = 2n/h where X is the wavelength. A schematic diagram of a general scattering experiment is shown in Figure 13.1. We can distinguish two general cases. First, the situation in which the energy and wavelength of the scattered neutron are equal to those of the incident beam. This is known as elastic scattering, and gives the simple result that the momentum transfer | Ql is (An/X) sin (0/2). More generally, there will be some energy transfer between the neutron and the sample. The experiment is then said to involve inelastic scattering or, if the energy transfer is small and corresponds only to a broadening of the incident wavelength distribution, quasi-elastic scattering. Advantages of neutrons over other types of radiation for studies of polymers arise both from the relationship of energy to wavelength and from the mechanism of scattering by nuclei. The calculation of scattering patterns is based on the summation of amplitudes or intensities scattered from all components. The intensity I of a wave described in the usual notation of complex variables is given by I = AA*
(3)
where A is the amplitude and the star represents a complex conjugate. The addition of wave amplitudes from different scattering centres must take account of the phase of each wave if the incident beam is a coherent wave front. Coherence in the context of neutrons will be discussed further below. The amplitude A scattered by a single nucleus at a position r from an incident plane wave of amplitude A0 is given by:
A = Aobc-^/\r\
(4)
Sample
Detector
Sample
Figure 13.1 (a) Schematic diagram of a scattering experiment; (b) the wave vectors that describe the scattering process. Q is the difference between the incident and scattered wave vectors
This is known as the Born approximation for scattering from weak potentials. It is seen that the scattered wave is spherically symmetric and decreases in intensity as l/|r| 2 , which is the usual inverse square law. For a distribution of scattering lengths described by a density p(r) the resulting amplitude is
A = A0^tp(r)e-^/\rndr3
(5)
and thus the scattered intensity / is / = AA* = Al f [p(r)e- fQr p(r')e^7|r| 2 ]d(r - r')3
(6)
The quantity p{r)p{r') is the spatial correlation function of the scattering length density, and the integral with e" lQ(r " r) is equivalent to a Fourier transform. It would be out of place to develop this formalism at great length. The results for elastic scattering are well described by Hukins [16].
It is possible to include the angular frequency co or energy E of the neutrons and the time variation of the scattering length density in Equation (4) to device related results for inelastic or quasi-elastic scattering. A more formal treatment would first treat this general case and then simplify the results for elastic scattering. These will not be derived but it is sufficient to quote the result:
dL/dodQ = I/Al
= I Mr,t)e-i(Qr+cor)p(^tV(Qr'+