Manual on Elastic-Plastic Fracture: Laboratory Test Procedures James A. Joyce
ASTM Manual Series; MNL 27 ASTM Publicat...
430 downloads
1444 Views
10MB Size
Report
This content was uploaded by our users and we assume good faith they have the permission to share this book. If you own the copyright to this book and it is wrongfully on our website, we offer a simple DMCA procedure to remove your content from our site. Start by pressing the button below!
Report copyright / DMCA form
Manual on Elastic-Plastic Fracture: Laboratory Test Procedures James A. Joyce
ASTM Manual Series; MNL 27 ASTM Publication Code Number (PCN): 28-027096-30
iSlb
100 Barr Harbor Drive, West Conshohocken, PA 19428-2959
Library of Congress Cataloging-in-Publication Data Joyce, J. A. (James Albert) , 1945Manual on elastic-plastic fracture : laboratory test procedure / James A. Joyce. (ASTM manual series ; MNL 27) "ASTM publication code number (PCN): 28-027096-30." Includes bibliographical references and index. ISBN 0-8031-2069-9 1. Fracture mechanics—Handbooks, manuals, etc. 2. Elasticity—Handbooks, manuals, etc. 3. Plasticity—Handbooks, manuals, etc. 4. Materials—^Testing—Handbooks, manuals, etc. I. Title. II. Series, technical publication ; 1278. TA409.J69 1996 620.V126—dc20 96-17228 CIP
Copyright « 1996 AMERICAN SOCIETY FOR TESTING AND MATERIALS. All rights reserved. This material may not be reproduced or copied, in whole or in part, in any printed, mechanical, electronic, film, or other distribution and storage media, without the written consent of the publisher.
Photocopy Rights Authorization to photocopy items for internal, personal, or educational classroom use, or the internal, personal, or educational classroom use of specific clients, is granted by the American Society for Testing and Materials (ASTM) provided that the appropriate fee is paid to the Copyright Clearance Center, 222 Rosewood Drive, Danvers, MA 01923, Tel: 508-750-8400 online: http://www.copyright.com/.
NOTE: This manual does not purport to address (all of) the safety problems associated with its use. It is the responsibility of the user of this manual to establish appropriate safety and health practices and determine the applicability of regulatory limitations prior to use. Printed in Scranton, PA May 1996
Foreword Manual on Elastic-Plastic Fracture: Laboratory Test Procedures, was approved by ASTM Committee E-8 on Fatigue and Fracture. This is Manual 27 in ASTM's manual series. The author, James A. Joyce, is employed at the U.S. Naval Academy, Mechanical Engineering Department, Annapolis, MD. THIS PUBLICATION.
HI
Contents chapter 1: Introduction
1
Chapter 2: Overview of Elastic-Plastic Fracture
2
Chapter 3: Analysis 3.1 /-integral and 8 Equations 3.2 Limits of Applicability 3.3 Compliance Equations
4 4 6 7
Chapter 4: Apparatus 4.1 Fixtures 4.2 Transducers and Electronics 4.3 Recording Equipment
9 11 16
Chapter 5: Specimen Preparation 5.1 Specimen Machining 5.2 Precracking
17 18
Chapter 6: Basic Test Procedure 6.1 Running the Test 6.2 Measuring the Crack 6.3 Analysis for J^^ Using Basic Test Data 6.4 The Multi-specimen Method 6.5 Evaluation of JQ 6.6 Analysis for J^ or 7„ Using Basic Test Data 6.7 Analysis for 8,, 8„, or 8^ Using the Basic Test Data 6.8 Summary of the Basic Method
22 23 23 23 24 27 28 28
Chapter 7: Advanced Test Procedure 7.1 Running the Test 7.2 Analysis of Advanced Test Data Chapter 8: Qualification of the Test Results 8.1 Qualification of the Data 8.2 Apparatus Requirements 8.3 Transducer Requirements 8.4 Specimen Preparation Requirements 8.5 Test Procedure Requirements 8.6 Additional Requirements 8.7 Summary 8.8 Qualifying the J-R Curve 8.9 Qualifying 7i^
9
17
22
30 30 32 35 35 35 35 35 36 36 36 37 37
vi CONTENTS 8.10 Qualifying 7^ 8.11 Qualifying 8^ and 8„
37 38
Chapter 9: Future Developments in Elastic-Plastic Fracture Testing
39
References
41
Appendix A: Software Listings Al Unloading Compliance Data Acquisition Program A2 Initialization Fit Program Appendix B: ASTM Fracture Test Standards Standard E 1737 Standard E 1290 Index
45 48 56 65 67 91 101
MNL27-EB/May 1996
Introduction T H I S MANUAL IS INTENDED TO provide a background for de-
veloping elastic-plastic fracture toughness data in accordance with ASTM Test Method for J-Integral Characterization of Fracture Toughness (E 1737) and ASTM Test Method for Crack-Tip Opening Displacement (CTOD) Fracture Toughness Measurement (E 1290). These standards provide the requirements for obtaining /-integral and CTOD quantities from laboratory tests; hovi?ever, they provide little information on why certain requirements are imposed and how to carry out various aspects of the tests. This manual provides specific guidance and instruction on equipment, apparatus, test fixtures, transducers, test setup, test procedure, and analysis of the data. Although nothing compares with hands on training as offered by the ASTM Technical and Professional Training Course on ElasticPlastic Fracture,' this manual attempts to provide the next best thing through the use of test examples, example calculations, photographs of test apparatus and fracture samples, as well as expert advice and reference to papers in the literature describing various test techniques. The sections that follow are organized sequentially as one would proceed in developing a laboratory capability to accomplish these fracture mechanics tests. Fixtures and apparatus are described first, then electronics, transducers, and recording equipment. Then an example test is set u p , run, and analyzed according to the elastic-plastic fracture toughness standards, i.e., E 1737 and E 1290. The data are then qualified according to these standards. The terminology used throughout this manual is that of E 1737 and E 1290, and the reader is referred to these two standards, included here in Appendix B, for definitions of the terminology. Two different types of tests are described, the basic test procedure leading to a single measurement quantity, i.e. the 7-integral at the onset of cleavage fracture, and the advanced
'ASTM Technical and Professional Training, held at ASTM's previous address: 1916 Race Street, Philadelphia, PA.
Copyright" 1996 b y A S T M International
or resistance curve procedure that requires a n unloading compliance or electric potential apparatus to estimate the crack extension at several locations on t h e load displacement record. The basic procedure requires a relatively simple apparatus and a test procedure similar to that required for a standard tension test, while the advanced procedure requires a more sophisticated arrangement to obtain the estimates of crack length, as well as crack extension from which the fracture toughness resistance curve (J-R curve) can be developed. The apparatus is then described in detail for both procedures, including a discussion of the test machine and the displacement transducer requirements. Considerable time is spent on specimen and test fixture preparation. Specimen precracking is then discussed at length because this is a n important aspect of fracture toughness testing often difficult and frustrating to the new practitioner The test procedures are described, including the test setup, running the test, recording the data, crack length marking, and post test crack length measurements. Finally, and certainly the most important part, there is a discussion of the data analysis. Examples are presented showing the evaluation of all fracture toughness quantities presently included in ASTM standards E 1737 and E 1290. All examples are taken from tests described fully in this manual. Sample software listings written in Microsoft QuickBASIC are included to do these analyses and to check the standard requirements as far as possible. Examples are presented demonstrating qualification of the measured toughness quantities in accordance with applicable ASTM test standard procedure requirements. The final section presents a "heads up" on what the new developments are likely to be in elastic-plastic fracture testing since the ASTM standards are continually being changed, extended, and improved. I would like to acknowledge the assistance of J. D. Landes, Edwin Hackett, Rick Link, and T. L. Anderson, who aided in the development of the original course notes on which this manual is based or helped to edit its final form.
www.astm.0r2
MNL27-EB/May 1996
Overview of Elastic-Plastic Fracture ELASTIC-PLASTIC FRACTURE MECHANICS ( E P F M ) has
devel-
oped from linear elastic fracture mechanics (LEFM) and attempts to eliminate the highly restrictive limits of that discipline so that a scientific method can be applied to structural applications for which low-strength, hightoughness materials are used. Early work by Wells (1961) was directed toward structural steels that were too tough to be characterized by LEFM. He proposed that the crack tip opening displacement (CTOD) of a blunted crack was a characteristic of the material's toughness and that it could be used as a crack-tip-characterizing parameter for materials for which LEFM was not valid. A more complete discussion of the analytical background of the CTOD method can be found in Anderson (1991). Standard methods of CTOD testing were developed in Britain (Wells 1961), a n d improvement has continued, leading to the recent British Standard BS 5762 (1979) and ASTM standards E 1290-89 and E 129093. The 7-integral was first proposed by Rice (1968) as a pathindependent integral for measuring the intensity of the stress and strain field ahead of cracks and notches. The form of the crack-opening mode, deformation plasticity, and crack tip stress and strain fields were developed by different approaches by Hutchinson (1968) and Rice and Rosengren (1968), and the/-integral was the natural measure for quantifying the intensity of the dominant term. In this way, the /-integral is to a nonlinear elastic crack exactly what the stress intensity is to an elastic crack tip, and elastic-plastic fracture mechanics had a parallel to the widely understood linear elastic case. Experimental work was done by Begley and Landes (1972) and Landes and Begley (1972) to measure / experimentally for standard laboratory test geometries. Early results showed that the /-integral could relate the conditions for crack initiation from one geometry to another, and a dramatic interest in /-integral fracture mechanics developed. A good discussion of the technical aspects of this development is presented in Anderson (1991). A major step in the development of a practical experimental test method for the /-integral was the development by Rice et al. (1973) of a simple relationship between / and the specimen load displacement record for the deeply notched bend bar geometry, namely that:
/ =
vhere
Copyright" 1996 b y A S T M International
2 /J Pdb Bb
HYPC-8 HYPC-6 HYPC-5 HYPC-4 HYPC-2
60
40
1 20
/? 1.0
15
HVPC-1
20
26
COD mm.
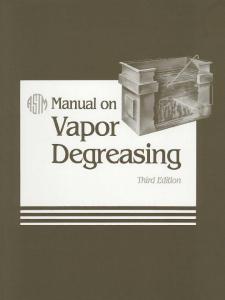
FIG. 1—Multi-specimen load displacement records for an HY80 steel. W B b a / Pdb
= specimen width^, = the specimen thickness, = (W - a) is the uncracked ligament, = the crack length, and = the area under the load versus load fine displacement record for the specimen or work done on the specimen.
With this equation, / could be evaluated for three-point bend specimens at any point on the load displacement record if the crack length, a, and hence the remaining ligament, b, was known. The first practical method for laboratory evaluation of the /-integral near the onset of crack initiation, called Jj^, was presented by Landes and Begley (1974). This method, called the multi-specimen method, used several identical specimens precracked to the same crack length and tested to different points on what should be similar load displacement curves, as shown for a structural steel in Fig. 1. From each specimen, a single data pair was obtained with the /-integral obtained at the end of test for each specimen from Eq 1, while the crack extension was obtained by heat tinting or otherwise marking the extent of the crack extension, then breaking open the specimen using a low temperature to cause cleavage or fatigue cycling as applicable for the material, a n d finally measuring the average crack exten-
(1) ^The terminology used in this manual corresponds to that of the ASTM standards E 1290 and E 1737. These documents can be found at the back of this manual, and the reader is directed there for clear definitions of the terminology used.
www.astm.org
OVERVIEW sion using an optical traveling stage microscope. The results from a series of specimens is shown in Fig. 2. The 7-integral at crack initiation, /j^, was evaluated from the intersection of a linear best fit line and an initial blunting line as shown in Fig. 2. This method became the basis for the first ASTM Ji^ standard, E 813-81 (ASTM Test Method f o r / ^ , a Measure of Fracture Toughness). Quantifying the elastic-plastic fracture toughness at crack initiation was not satisfactory for many applications, especially those in the nuclear industry where some degree of crack extension was acceptable as long as it occurred in a stable manner and its extent could be conservatively predicted. A crack growth resistance curve methodology was developed directly from the 7-resistance (J-R curve) used in ASTM E 813-81 to evaluate Z^.
400
300
i
200
too
Crack Extension mm FIG. 2—«/,c obtained from J-R data for HY80 steel using E 813-81.
OF ELASTIC-PLASTIC
FRACTURE
3
Important applications also existed, especially in nuclear reactor surveillance, where six or so identical specimens were not available for the evaluation of a single Jj^ data point. For both of these reasons, single specimen methods were developed, first the unloading compliance method and then the electric potential method, to obtain a full J-R curve from a single specimen test—an JR curve with enough definition to evaluate material variability, and for stability analyses, the resistance curve slope. The first unloading compliance method was presented by Andrews et al. (1976) using a complex system of laboratorybuilt apparatus. A computer-enhanced, interactive system was developed by Joyce and Gudas (1979) that used a digital system to develop the J-R curve using what was at that time an exotic system, but one that has since become the laboratory standard for state-of-the-art fracture testing. This method became the basis for the first ASTM J-R curve standard, ASTM Test Method for Determining J-R Curves (E 1152-87), and was incorporated as well into an updated version of E 813, E 813-87. More recent work has continued to improve these two basic standards. A major step was the recent combination of the two standards into the combined /j^, J-R curve standard E 1737. This standard also allows for the evaluation of/integral values at the onset of fracture instability. For this purpose, two new quantities, J^ and 7„, have been introduced representing the onset of fracture instability without and with significant ductile crack extension, respectively. Additionally, one is now allowed to use the measured Jj^ from a test that terminates unstably if approximately 1 m m of stable crack extension is present. Also, the J-R curve is acceptable up to the onset of instability if it meets the standard's requirements. Also new in the E 1737 standard is an Annex describing an electric potential procedure, and a new specimen—the disk-shaped DC(T) specimen—is included.
MNL27-EB/May 1996
Analysis 3.1 /-INTEGRAL AND S EQUATIONS
Api = Area A under the load versus load point displacement as shown in Fig. 3.
W H I L E THE PRINCIPAL OBJECTIVE of this manual is to describe
For the compact specimen (C(T)) and the disk compact specimen (DC(T)), at a point corresponding to y„ P, on the specimen load versus load line displacement record:
experimental aspects of elastic-plastic fracture testing, it is still necessary to define the quantities that we are measuring by presenting the ASTM standard equations that are currently used. The 7-integral of Rice (1968) is defined in terms of a path integral not easily measured experimentally. For simple bend-type specimens, however, a straightforward analysis has been developed to relate J to the area under the load versus load point displacement record. Two different equations are used to evaluate / in ASTM fracture standards, the first applicable when the amount of crack extension is small, while the second includes a correction for crack extension. The multi-specimen 7 equation of ASTM E 1737 is:
(7) where: K
m^wy^ fiaJW)
(2 + aJW)[0.886 + 4M{aJW) - 13.32(a„/W)^ -h \4.72(ajwy
(1 -
where
and for the DC(T) specimen:
For the single edge-notched bend specimen (SE(B)) at a point corresponding to V, and P, on the specimen load versus load line displacement record. K\\
- 5.6(a„/IV)-']
ajwy^ (9)
J^i = elastic component of / , and J pi = plastic component of / .
7 =
(8)
for the C(T) specimen
(2)
J = J.i + /„,
fiaJW)
fiaJW)
(2 + a„/W)[0.76 -i- 4.8(a„/W) \l.58{aJWY + 11.43(fl^/W)^ 4.08(aJWT]
(1 -
ajwy (10)
- v^) + J„i
(3)
The plastic component of / is given by:
where: "'
PS
K =
fiaJW)
(4)
fiaJW)
(5)
and J
=
^
(6)
where flo = the crack length, W = specimen width, B = the specimen thickness, Bjv = the net specimen thickness measured between the side groove roots, b^ = {W — a„) is the uncracked ligament at the start of the test.
Total Load-Line Displacement, v FIG. 3—Definition of the plastic area for J calculation.
4 Copyright
1996 b y A S l M International
(11)
where TI = 2 -I- 0.522 b^/W. The r] factor has been introduced by Sumpter and Turner (1976) and Paris et al. (1980) as a
with: 3(aJwy"[L99 - (aJWXl aJW)l2.15 - 3.93{aJW) + 2.7{ajwy]] 2(1 + 2 aJW)(l ajwy^
B.b„
www.astm.org
ANALYSIS convenient terminology for the factor relating the /-integral to the area under the specimen load versus load line displacement relationship. For the case of the deeply cracked bend specimen of Eq 6, TI = 2 and the same form as that of Eq 11 could be used. Various T| factors have been introduced for other fracture specimen geometries (Joyce et al. 1992) and even for the evaluation of CTOD (Kirk and Dodds 1992). The quantities a^ and b^ used in all of the above expressions are the initial values obtained from a nine-point average measurement of the fatigue precrack length after completion of the test. These J equations do not include a correction for crack growth, depending only on the crack length a^ at the beginning of test as measured optically after the test. This simple relationship should only be used to obtain /j^ since the J-R curve resulting from this analysis will be elevated and nonconservative due to the lack of a crack growth correction term. The 7-integral quantities of Eq 6 and Eq 11 are deformation plasticity quantities giving the /-integral for a specific crack length as if the specimen was loaded from the start of the test with that crack length. If crack extension occurs, the measured load displacement record must be corrected if the measured data are to be used to obtain a correct /-integral corresponding to the crack length that exists at a particular point of interest on the load displacement record. A comparison is made in Fig. 4 of load displacement records for a particular specimen, the upper one being the experimentally measured result for the real test in which the specimen is undergoing crack extension. At a point like that labeled "A" on Fig. 4, the crack length has grown to magnitude a,, which is different than the initial crack length a^. The deformation plasticity /-integral at this point would correctly be evaluated from the load displacement curve of a specimen that started with the crack length a, and for which the crack did not grow as the specimen was loaded to Point A, a load displacement curve that would have the appearance of the lower curve on Fig. 4. The lower curve is, of
5
course, not available, but work by Ernst (1981) has shown how to correct the measured data to obtain an accurate estimate of the /-integral as if this lower curve were known. The more accurate methodology for evaluating / , as used in the advanced test procedure of E 1737, is: J = Je,+ J„
(12)
where /^, = elastic component of / , and /p, = plastic component of / . The elastic component of / can be calculated at each point Vj, Pj, from the LEFM stress intensity as:
{K,,m - v^)
(13)
where K for the SE(B) specimen is given by: ^(0 =
PS _iBBi,y'^W"\
fiai/W)
(14)
and K for the C(T) and DC(T) specimens is given by: ^(0
P^ _iBB^Wy'\
fiai/W)
(15)
with fiUj/W) a function of specimen type, given by: SE(B) specimen: 3(a,./W)"2[1.99 - (a,./W)(l - a,/H')[2.15 - 3.93(a,/W) + 2.7{a,/wy]] 2(1 + 2 a,/W)(l - a^/wy
f{a,/W)
(16)
C(T) specimen [(2 + a,/W)[0.886 + 4.64(a,/W) - 13.32(a,/W)^ + I4.72ia,/Wy - 5.6ia,/Wy]] (1 af/wy (17) DC(T) specimen:
fiaJW) =
[(2 + a,/W)[0.76 + 4.8(a,./W) - 11.58(a,./W)2 + 11.43(a,./W)^ - 4.08(a,7W)^]] (1 - a,/Wy'^
Load-Displacement Curve with Crack Extension
(18) The subscript on a, is present to emphasize that the crack length is changing here, and that the most recent value is used at each instant. The plastic component of / can be calculated at each point y„ Pf from the incremental equation: • ^ ( / - i ) ^pifi)
•'pld)
U,~n+ \u
^p/(i-
5^
Load-Displacement Curve without Cracii Extension
1-7,,-.
•*(/-!)
h(19)
where for the SE(B): Tl„_,) = 2.0, and Load Une Displacement FIG. A—Comparison of load displacement curves with and without crack extension.
7o-„ = 1.0, and for the C(T)and DC(T)specimens:
6 MANUAL ON ELASTIC-PLASTIC FRACTURE %-
= 2.0 + 0.522 ba-JW,
and
7(,_„= 1.0 + 0 . 7 6 V i / W ' . The separation of / into elastic and plastic parts was introduced in the 1987 versions of ASTM E 813 and ASTM E 1152 basically to improve the accuracy and consistency o f / when near LEFM conditions applied. The analysis of E 81381 used the total area under the load versus load line displacement curve and a plastic T) factor, which can be considerably different than the correct elastic TI factor. This result could be considerably in error when the elastic component of J was large compared to the plastic component. Instead of using elastic and plastic areas, and the corresponding elastic and plastic ti factors, it was decided to obtain the elastic component from the stress intensity and only the plastic component from the TI factor method. This separation also improved the comparability of the results of E 813-87 and those of ASTM Test Method for Plane-Strain Fracture Toughness of Metallic Materials (E 399) for the linear elastic case. Justification for use of the /-integral in the presence of crack growth has been provided by Hutchinson and Paris (1979), who showed that / remained applicable as long as a region of proportional plastic deformation surrounds the crack tip and dominates any small region of nonproportional straining at the crack tip. Justification for the use of the J-integral when the overall load capacity of the specimen is falling is based on finite element results (Shih et al. 1979; Dodds et al. 1994) that show that the stress a n d strain fields in front of the crack are not diminishing and the falling overall load is resulting from reductions in the size of the remaining uncracked ligament. In the ASTM crack tip opening displacement (CTOD) standard, E 1290, the CTOD is estimated from crack opening displacement (COD) measurements at the specimen surface (SE(B)) or load line (C(T)). The CTOD is separated into two components and calculated from: (20)
8 = 8,, + 8p,
J., _ 2(TY
K' 2<J YE
'
YP
6(a„/W)"^[1.99 - (aJW)(l - a„/W)[2.15 - 3.93(a„/W) + 2.7(a„/W)^]]
- ajwy
^ '
and for the C(T) specimen with: (2 + a„/W)[0.886 + 4.64(a„/W) - 13.32(a„/W)^ + 14.72(a„/W)^ - 5.6(a„/W)^] y= (1 aJWf"E E' = (1 - v^)
(27)
r„ = 0.4(1 + a)
where for the SE(B) specimen a = 0.1 and r^, = 0.44, and for the C(T) specimen: a = 2-^liaJKf
+ aJK
+ 1/2] - 2{aJK
+ 1/2)
(28)
giving Tp between 0.46 and 0.47 for 0.45 < aJW ^ 0.55.
3.2 LIMITS OF APPLICABILITY The magnitudes of fracture toughness that can be measured by fracture mechanics tests are limited by the sizes of the test specimens available. Tougher, lower-strength materials require larger specimens for the results to be acceptable. Other requirements are present to assure that the data are of acceptable quality, the specimen precracking adequate, and that a distinctly measurable point is present. The qualification requirements are covered in detail in Section 8, and examples are provided. Generally, a test is run on a standard specimen and, if a sudden instability does not occur, a tentative /-integral value near the onset of ductile crack growth, /Q, is evaluated. For / Q to be qualified as a /j^ according to E 1737, the following requirements are established: \.B,b„>
25JQ/(TY-
(25)
and for the SE(B) specimen:
2(1 + 2aJW)il
in which V^ is the plastic component of the crack mouth opening displacement at the measurement point. The r^ coefficient depends slightly on the crack length and specimen type and is given by:
2. Measured ductile crack extension at JQ^ is less than 0.2
(22)
BVW
(26)
(24)
(21)
with:
K=
r^jW - a)V, 8„/ —
2. dJ/da evaluated at AGQ is less than cry. The first condition requires that the specimen is large enough that the /-integral controls the stress and strain fields in an annular region surrounding the crack tip. This requirement was proposed by Paris (1972) and is basically a requirement that the CTOD is small in comparison with all specimen dimensions. This requirement has been a part of the /-integral fracture standards from the beginning. The second condition requires that a distinct change in slope occurs between the initial blunting behavior and the subsequent J-R curve a n d is only violated for high-toughness materials like austenitic stainless steels. A serious shortcoming of /j^ is that it is evaluated from the intersection of two curves with similar slopes, resulting in large measurement variability in higher-toughness materials. If fracture instability occurs, a / at fracture instability, /Q^, is measured and can be qualified as / , if it meets the following conditions:
where the 8,, is calculated from: 8.,=
The plastic component is obtained from an analysis that assumes a rotation point near the center of the ligament, defined by r^,, as shown in Fig. 5. A simple similar triangles analysis can now be used to obtain the plastic component of the CTOD as:
1 . 5 , «„, b„ > 200 + JQ^IMOY
mm.
JQJOY.
ANALYSIS
7
FIG. 5—Schematic for CTOD evaluation from COD. 3. K^ax during the final 0.64 m m of precracking shall be less than 0.6 ( / Q ^ ) " 1 The first condition requires that the specimen be large enough so that small-scale yielding conditions (SSY) exist at the crack tip (Anderson and Dodds 1991). If this condition is violated, extensive plasticity develops at the crack tip, constraint is lost, and the /-integral at fracture instability becomes very dependent on the specimen in-plane dimensions. The second condition disallows extensive ductile crack extension before instability, which can raise or lower the crack tip constraint. This requirement was added for conservatism, and methods to correct for the effects of ductile crack extension before instability are presently the subject of intensive research (Dodds and Tang 1993; Dodds et al. 1994). M is the slope of the construction line used to evaluate Jj^. The usual value for M is 2.0. The ASTM E 1737 standard allows a higher value to be used based on six or more measured / versus Aa data pairs in the early part of the J-R curve. A value of M greater than 2 leads to a lower value of Jj^ and is generally used only for some austenitic stainless steels. The final condition assures that the precracking load did not interfere with the result of the test, a requirement adapted from a similar requirement in E 399. A J^ value that meets these requirements would be expected to exhibit a weak dependence on specimen thickness, i.e., crack length, since the volume of material subjected to intense stresses depends on crack length. This dependence is discussed more fully in Wallin (1989). The part of the measured 7-i? curve qualified by E 1737 is restricted to the region established by: 1. The smaller oiJ^^^ = b^dyl'^^ or J^^^ = Bay/20. 2- Aa„,, = 0.1 b,. The first of these requirements is a slightly less stringent version of the Jj^ requirement, which is intended to assure that the specimen is large enough for / to control the stress and strain fields surrounding the crack tip. The second requirement restricts the extent of ductile crack extension allowed. The original requirement on crack extension was Aa^^^ = 0.06 b^, resulting from finite element work by Shih et al. (1979). More recent work by Newman et al. (1985) has been used to extend this requirement to OAb^ in E 1152-87. Work by Joyce and Hackett (1991b), based on experimental measurements, supports extending this limit to 0.25fo„, arguing that it is the finite element analyses, not the
J-R curve, that is failing in the previously cited work. ASTM E 1737 at present suggests taking data to crack extensions in excess of 0. lb„, but does not yet accept data beyond this limit as "valid." The CTOD standard, E 1290, requires that the laboratory test be done on section thicknesses at least as large as the thickness of interest in the structural application. If this is so, and standard test samples are used, there are no size requirements like those of E 1737. If instability occurs before the maximum load is reached, a 8Q can be measured that is called 8^ if less than 0.2 m m of ductile crack extension has occurred and 8„ if more than 0.2 m m of ductile crack extension has occurred. If maximum load is reached without instability, a 8„ is measured and reported. Transfer of the results to applications with larger section sizes is disallowed.
3.3 COMPLIANCE EQUATIONS Unloading compliance techniques are used to obtain estimates of the crack length from accurate and precise measurements of the specimen compliance made from periodic unloadings during the fracture test. Crack lengths are determined based on the measured specimen compliance. Relationships between the measured compliance and the specimen crack length are therefore very important and are provided in E 1737. For SE(B) specimens, where the span-to-width ratio is 4 with crack mouth opening displacements measured at the notched edge, the crack length is: a,/W = [0.999748 - 3.9504 U^ + 2.9821 Ul 3.21408 Ul + 51.51564 Ut - 113.031 f/=]
(29)
where: 1
U=^ S/4
(30) + 1
and: B=B where
{B - B^y B
(31)
8 MANUAL ON ELASTIC-PLASTIC FRACTURE C, = specimen crack mouth opening elastic compliance (AV^/AP), on an unloading/reloading sequence, AP = increment of load, and /^V^ = increment of crack mouth opening displacement measured at the specimen surface.
e
T H*
j_ih
For C(T)and DC(T) specimens, the crack length is given by:
0
af/W = [1.000196 - 4.06319 (/, + 11.242 Ul - 106.043 Ul + 464.335 U^ - 650.677 U^]
(32)
and a,/W = [0.998193 - 3.88087 [/, + 0.187106 Ul + 20.3714 Ul - 45.2125 Ui + 44.527 [/=]
(33)
respectively, where: [/. =
1 [5,£'CJ"2 + 1
TAN-^ (D/R)
(34)
Q, = rotation-corrected specimen crack opening compliance on an unloading/reloading sequence, given in E 1737 as:
c
C, -
sme -- cos6
~D . „
(35)
- cos6 FIG. 6—Elastic compliance correction for specimen rotation.
These compliance equations are obtained using elastic, small displacement finite element analysis (Hudak and Saxena 1978). For high-toughness materials, the specimen geometry can change during the test and a rotation correction is necessary to accurately predict crack length from compliance for these materials. E 1737 requires the use of this correction for all C(T) and DC(T) specimens since in the limit of small specimen half rotation, Q, = C,. For the C(T) and DC(T) specimens, this correction is obtained using the geometry shown in Fig. 6, giving: C, = measured specimen elastic compliance (at the load line), H' = initial half span of the load points (center of pin holes), R = radius of rotation of the crack centerline, (W + a)/ 2, where a is the updated crack length, D = one half of the initial distance between the displacement measurement points, 6 = angle of rotation of a rigid body element about the unbroken midsection line, or 9 = sm-'[(dJ2 + D)/(D^ + R^Y"-] - tan \DIR), and d„ = total measured load-line displacement. For cases where an elastic compliance is not measured but is needed to separate the area under the load versus displacement record into elastic and plastic parts, the required compliance can be calculated from alW using the following formulas. For the SE(B) specimen load line compliance:
1 'Lu
E'BAW
-
a,,
[1.193 - 1.98(a,/lV)
+ 4.478(a,/W)2 - 4.443(a,/W)3 -t- 1.739(a,./W)''] (36) For the SE(B) specimen crack opening displacement compliance. Cr
6S E'WB^
a \W
0.76 - 2.28(a,/W)
+ 3.87(a,./W)2 - 2.04(fl,/W)3 +
(1 -
0.66 a,/W)\
(37)
For the C(T) specimen, with the crack opening displacement measured at the load line,
^' = A i ^ j ^'•'''' ^ 12.219(a../W) - 20.065(a,/W)2 - 0.9925(a,/W)3 + 20.609(a,/W)'' - 9.9314(a,/lV)5] (38) For the DC(T), with the crack opening displacement measured at the load line. C, =
'
1
E'BSl - (a,/W)Y - 4.88iai/wy
[1.62 -h 17.80(a,/W)
+ 1.27(a,./W)3]
(39)
MNL27-EB/May 1996
Apparatus 4.1 FIXTURES FIXTURES FOR LOADING STANDARD fracture toughness speci-
mens are described carefully in all ASTM fracture standards. Requirements are also included for the alignment of the specimen in or on the loading fixtures for proper testing. For bend testing, the standard fixture is identical for E 1737 and E 1290 and is shown in Fig. 7. The critical dimensions in this case are the parallelism of the roller surfaces, base, and loading ram, the initial span, and the size of the rollers used. All of these requirements are addressed in Fig. 7. The requirement that the material of the fixture and rollers be steel with a Rockwell hardness in excess of 40 RC is essential to avoid plastic indentation of the loading surfaces or rollers so that the rollers move freely during the course of the test. Low-stiffness springs or rubber bands should be used to assure that the support rollers are initially against the inner stops so that the proper bend span is present. Fine alignment marks on the specimen and rollers can be very useful in the alignment of the specimen and to center the roller, as shown in Fig. 8. If the center of the loading roller is located in the plane of the crack, the moment in the crack plane will be very close to the proper value, that is, M = PS/4, even if the crack plane is not centered exactly between the support rollers. This occurs because the closer support then carries a greater share of the applied load and the error in applied moment is proportional to the square of the error in the misalignment. For example, a 1% error in alignment results in a 0.01% error in FIG. 8—SE(B) fixtures with rollers aligned for test. TEST SPECIMEN
= : Bb6 ^ 3
.6 PIN DIA
h '
1.1 PIN DIA.
DISPLACEMENfV 63/ GAGE TEST FIXTURE
{t
fc -Wlminl-
Wlminl
BOSSES FOR SPRINGS OR RUBBER BANDS
PMLIM! AND AM!(I%) < AMIN! + 2.5 THEN J% = J% + 1 JX!(J%) = JM!(1%) AX!(J%) = AM!(1%) END IF NEXT 1% PRINT #2, PRINT • CALL THE INITIALIZATION FIT SUBROUTINE RDAT% = J% CALL JFIT ASHFT! = XN!(1) PRINT #2, PRINT #2, USING "5. ###.## & ### "; " ASHFT! = "; ASHFT!; ' USING "; RDAT%; " POINTS" PRINT USING "& ###.## i, ### "; " ASHFT! = "; ASHFT!; " USING "; RDAT%; " POINTS" ' NOW GET JQ!, DELAMIN, AND DELALIM DELAMIN! = -100 DELALIM! = 500 CALL JQCALC
THIS ENDS THE INITIALIZATION FIT CHECK FOR DATA EXCLUDED BY DELAMIN, DELALIM, OR JLIMIT RESTRICTIONS J% = 1 FOR 1% = 1 TO NUMDAT% IF AM!(1%) - ASHFT! < DELAMIN! THEN GOTO 300 IF AM!(1%) - ASHFT! > DELALIM! THEN GOTO 300 IF JM!(1%) > JLIMIT! THEN GOTO 300 IF AM!(I%) - ASHFT! < JM!(I%) / (SLOPEM! » SFLOW!) + .15 THEN GOTO 300 IF AM!(I%) - ASHFT! > JM!{I%) / (SLOPEM! * SFLOW!) + 1.5 THEN GOTO 300 J% = J% + 1 300 NEXT 1% IF J% = NFIT% + 1 THEN 320 PRINT #2, "DATA FOUND THAT MUST BE EXCLUDED - RE-SOLVE FOR JQ" CALL JQCALC 320 : ' CHECK ASHFT! AGAINST AMEAS! - INITIAL CRACK LENGTH ACCURACY FI% = 0 IF (ABS(ASHFT! - AZMEAS!)) > .01 * Wl! THEN PRINT PRINT #2, PRINT "DATA SET FAILS CRACK LENGTH ACCURACY REQUIREMENT "
APPENDIX A: SOFTWARE LISTINGS PRINT #2, "DATA SET FAILS CRACK LENGTH ACCURACY REQUIREMENT " PRINT #2, USING "& ###.## £. ###.»#"^ " AZMEAS = "; AZMEAS • ; " ASHFT! = "; ASHFT! PRINT USING "f, ###.## S ###.##"; " AZMEAS! = "; AZMEAS!; " ASHFT! = "; ASHFT! FI% = 1 END IF ' CHECK QUALITY OF INITIALIZATION FIT IF REIT! < .96 OR RDAT% < 8 THEN PRINT -INITIALIZATION FIT FAILED STANDARD REQUIREMENTS " PRINT USING "& #.### S ##.",• " CORRELATION = -; REIT!; " RDAT = "; RDAT% PRINT #2, "INITIALIZATION FIT FAILED STANDARD REQUIREMENTS " PRINT #2, USING "& #.### & »#."; " CORRELATION = "; REIT!; " RDAT = ': RDAT% FI% = 1 END IF ' CHECK £1737 Jic QUALIFICATION REQUIREMENTS FJ% = 0 IF NFIT% > 4 THEN GOTO COUNTOK PRINT -DATA COUNT IN INCLUSION REGION IS NOT ADEQUATE, N = "; NFIT% PRINT #2, "DATA COUNT IN INCLUSION REGION IS NOT ADEQUATE, N = "; NFIT% FJ% = I COUNTOK; ' CHECK JQ FIT POWER COEFFICIENT IF MQ# < 1! THEN GOTO POWEROK PRINT USING "St #.##»-; "C2 COEFFICIENT IS UNACCEPTABLE - C2 = -; MQ# PRINT #2, USING "& #.»##-; -C2 COEFFICIENT IS UNACCEPTABLE - C2 = -; MQ# FJ% = 1 POWEROK: ' CHECK SLOPE REQUIREMENT JTEST! = MQ» * BQ# * AQ# (MQ# - I) IF JTEST! < SFLOW! THEN GOTO SLOPEOK PRINT -DATA FIT FAILS SLOPE REQUIREMENT " PRINT #2, "DATA FIT FAILS SLOPE REQUIREMENT " FJ% = I SLOPEOK: • CHECK DATA CLUSTERING REQUIREMENT FOR 1% = I TO NFIT% IF (AZ!(I%) - AQ#) > (DELALIM! - AQ#) / 3 THEN GOTO CLUSTOK NEXT 1% PRINT AZ!(1) - AQt, (DELALIM! - AQ#) / 3 PRINT "DATA FAILS - NO DATA IN REGION B " PRINT #2, "DATA FAILS - NO DATA IN REGION B " FJ% = 1 CLUSTOK: ' CHECK EARLY DATA COUNT REQUIREMENT J% = 0 FOR 1% ^ 1 TO NUMDAT% IF JM!(I%) < .4 * JQ! THEN GOTO 700 IF AM(I%) - ASHFT! > AQ# THEN GOTO 700 J% = J% + 1 700 NEXT 1% IF J% > 3 THEN GOTO ECOUNTOK FJ% = 1 PRINT "DATA SET FAILS EARLY DATA COUNT REQUIREMENT - COUNT = " ; J% PRINT #2, "DATA SET FAILS EARLY DATA COUNT REQUIREMENT - COUNT = "; J% ECOUNTOK: ' CHECK SPECIMEN SIZE REQUIREMENTS REQSIZE! = 25 * JQ! / SFLOW! IF (WI! - AZMEAS!) > REQSIZE! AND BI! > REQSIZE! THEN GOTO SIZEOK PRINT USING "5, ###.##"; "SPECIMEN FAILS SIZE REQUIREMENTS, 25*JQ/SFLOW = "; REQSIZE! PRINT #2, USING "& ###.##"; "SPECIMEN FAILS SIZE REQUIREMENTS, 25*JQ/SFLOW = "; REQSIZE! FJ% = I SIZEOK: IF FJ% > 0 THEN GOTO JRTEST PRINT PRINT #2, PRINT "DATA SET PASSES ALL Jic QUALIFICATION REQUIREMENTS " PRINT #2, "DATA SET PASSES ALL Jic QUALIFICATION REQUIREMENTS " PRINT PRINT #2, PRINT #2, USING "& #»»#.#"; " Jic = "; JQ! ; " k J / m 2" PRINT USING "&####.#"; " Jic = "; JQ!; " k J / m 2" JRTEST: ' CHECK J-R CURVE QUALIFICATION REQUIREMENTS FR% = 0
59
60 MANUAL ON ELASTIC-PLASTIC FRACTURE CHECK NUMBER OF J-R CURVE DATA J% = FOR I
= 1 TO NUMDAT% IF AM!(1%) - ASHFT! < AMIN! - ASHFT! THEN GOTO 800 IF AM!(I%) - ASHFT! > DELALIM! THEN GOTO 800 IF JM!(1%) > JLIMIT! THEN GOTO 800 J% = J% + 1 AC!(J%) = AM!(I%) - ASHFT!
800 NEXT 1% IF J% > 10 THEN GOTO NUMDATOK PRINT -J-R CURVE DATA COUNT INADEQUATE - COUNT = "; J% PRINT #2, "J-R CURVE DATA COUNT INADEQUATE - COUNT = "; J% FR% = 1 NUMDATOK: ' CHECK SECANT LINE REQUIREMENT DELASEC! = ((3 * BQ#) / (4 * SFLOW!)) (1 / (1 - MQ#)) JB% = 0 JA% = 0 FOR 1% ^ 1 TO J% IF AC!(I%) < DELASEC! THEN JB% = JB% + 1 ELSE JA% = JA% + 1 END IF NEXT 1% IF JA% < 2 OR JB% < 8 THEN PRINT "J-R CURVE DATA FAILS SECANT SPACING REQUIREMENT " PRINT #2, "J-R CURVE DATA FAILS SECANT SPACING REQUIREMENT FR% = 1 END IF
PRINT PRINT PRINT PRINT PRINT PRINT PRINT PRINT PRINT PRINT PRINT
#2, USING "& ##» #2, USING "St
##";
"THE FINAL ESTIMATED CRACK LENGTH IS: "; AM!(NUMDAT%); " n •f; "THE FINAL ESTIMATED CRACK LENGTH IS: "; AM!(NUMDAT%) ;
#2, USING "& ##.##": -THE ESTIMATED FINAL CRACK EXTENSION IS: USING "S ##.##"; "THE MEASURED FINAL CRACK EXTENSION IS: #2, USING #2, USING
##";
,- AM! (NUMDAT%) - ASHFT!; AFMEAS! - AZMEAS!; " mm"
"THE ESTIMATED FINAL CRACK EXTENSION IS: ; AM!(NUMDAT%) - ASHFT!; "THE MEASURED FINAL CRACK EXTENSION IS: " AFMEAS! - AZMEAS! ; " miT
PRINT #2, FDIFF! = ((AFMEAS! - AZMEAS!) - (AM!(NUMDAT %) - ASHFT!)) / (AFMEAS! - AZMEAS!) * 100 PRINT USING "& ##.#"; "THE PERCENT ERROR IN THE FINAL CRACK EXTENSION PREDICTION IS: "; FDIFF!; " PRINT #2, USING "& ##.#": "THE PERCENT ERROR IN THE FINAL CRACK EXTENSION PREDICTION IS: "; FDIFF! IF ABS(FDIFF!) > 15 THEN PRINT -THIS FINAL CRACK EXTENSION ACCURACY IS NOT SATISFACTORY!! " PRINT #2, "THIS FINAL CRACK EXTENSION ACCURACY IS NOT SATISFACTORY!! " FR% = 1 END IF TEST J-R CURVE FLAG IF FR% = 0 AND FI% = 0 THEN GOTO JROK PRINT -THE J-R CURVE HAS NOT PASSED ALL REQUIREMENTS "
PRINT PRINT PRINT PRINT PRINT PRINT PRINT PRINT
#2, "THIS J-R CURVE PASSES ALL J-R CURVE QUALIFICATION REQUIREMENTS"FOR THE REGION ENCLOSED BY JLIMIT AND DELALIM." #2, "THIS J-R CURVE PASSES ALL J-R CURVE QUALIFICATION REQUIREMENT #2, " FOR THE REGION ENCLOSED BY:" #2, USING "S ####.# "; " JLIMIT = "; JLIMIT!; - It J / m 2" #2, USING "& ##.###"; " DELALIM = "; DELALIM!; " mm"
' PRINT OUT A MODIFIED * . JRI FILE WITH CHANGES ONLY IN THE DEL A ET$ = DT$ + ".JRI" OPEN ET$ FOR OUTPUT AS #1 OPEN DTN$ FOR INPUT AS #7 1% = 1 DO UNTIL E0F(7) FOR K% = 1 TO 15 INPUT #7, XY!(K%) NEXT K% ' PRINT OUT IN *.JRA FORMAT (15 COLUMNS) PRINT # 1, XY ! (1) ; " " ; XY ! (2 ) ; " " ; XY ! (3 ) ; " " ; XY! ( 4 XY!(5); ) ; " "; " "; XY!(6); XY!(10); ' -; XY!(11); " "; XY!(12); " "; XY!(12) - ASHFT!; " "; XY!(14); " • XY!(15)
APPENDIX A: SOFTWARE LISTINGS
SHUT THINGS DOWN CLOSE #1, #7 PRINT #2, Page$ END
SUB GAUSS • INPUT DATA IS IN AN! (3, 4) - OUTPUT IS XN!(3) ' SUBROUTINE IN BASIC TO DO A GAUSS ELIMINATION SOLUTION ' SET NOW FOR 3X3 MATRIX ' OUTPUT IS A VECTOR XN N% = 3 M% = N% + 1 L% = N% - 1 ' START REDUCTION TO TRIANGULAR FORM FOR K% = 1 TO L% Kl% = K% + 1 JJ% = K% EG! = ABS(AN! (K%, K%) ) ' REM START OF SEARCH FOR LARGEST PIVOT ELEMENT FOR 1% = Kl% TO N% AB! = ABS(AN! (1%, K%) ) IF BG! > AB! THEN BGI = AB! : JJ% = 1% NEXT 1% IF JJ% = K% GOTO REDUCE ' INTERCHANGES ROWS TO GET MAX PIVOT ELEMENT FOR J% = K% TO M% TE! = AN!(JJ%. J%) AN!(JJ%, J%) = AN!(K%, J%) AN!(K%, J%) = TE! NEXT J% ' DETERMINES REDUCED ELEMENTS OF TRIANGULAR SET REDUCE: FOR 1% = Kl% TO N% Q! = AN! (1%, K%) / AN! (K%, K%) FOR J% = Kl% TO M% AN!(I%, J%) = AN!(I%, J%) - Q! * AN!(K%, J%) NEXT J% NEXT 1% FOR 1% = Kl% TO N% AN!(1%, K%) = 0 ! NEXT 1% NEXT K% ' BACK SUBSTITUTION FOR THE SOLUTIONS XN!(N%) = AN! (N%, M%) / AN!(N%, N%) FOR NN% - 1 TO L% SU! = 0! 1% = N% - NN% 11% = 1% + 1 FOR J% = 11% TO N% SU! = SU! + AN!(I%, J%) * XN!(J%) NEXT J% XN!(I%) = (AN!(I%, M%) - SU!) / AN!(I%, 1%) NEXT NN% END SUB
SUBROUTINE TO SET UP FUNCTION FOR AO EVALUATION USES EQUATION aA Q \ + J / (2*SIGF) + B J " 2 + C J " 3 , USES EQUATION a Q a„(j + J / (2*SIGF) INPUT IS RDAT% PAIRS OF a AND J IN VECTOR ARRAYS AM! AND JM! 1 TO 3 FOR
J% = 1 TO
EXT
J%
A N ! {I
NEXT 1% JSUM! = 0 ' DO SUMMATIONS FOR LEAST SQUARES AN! (1, 1) = RDAT% FOR 1% = I TO RDAT% AN AN AN
J S U M ! = J S U M ! + JX (1%) (1, 2) = A N (1, 2) + JX (1%) (2, 2) = A N (2, 2) + JX (I*) (1, 3) = AN (1, 3) + JX (1%)
AN
(2, 3) ^ A N (2, 3) + J X (1%) (3, 3) ^ A N (3, 3) + JX (1%) (1, 4) = A N (1, 4) + AX (1%)
AN
(2, 4) = AN
AN AN
2 4 3 5 6
(2, 4) + A X (1%) * JX (1%)
+BJ'-2+CJ'-3
61
62 MANUAL ON ELASTIC-PLASTIC FRACTURE AN!(3, 4) = AN!(3, 4) + AX!(I%l • JX!(1%)
3
NEXT 1% AN!(1, 4) = AN!(1, AN!(2, 4) =AN!(2, AN!(3, 4) =AN!(3, AN!(2, 1) = AN!(1, 2) AN!(3, 1) = AN!(1, 3) AN!(3, 2) = AN!(2. 3) ' NOW SOLVE THESE EQUATIONS CALL GAUSS
4) - JSUM! / (2 * SFLOW!) 4) -AN!(1, 3) / (2 * SFLOW!) 4) -AN!(2, 2) / (2 * SFLOW!)
USING GAUSS ELIMINATION FOR XN!
PRINT 'COEFFICIENTS OF INITIALIZATION ARRAY ARE: PRINT XN!(I), XN!(2), XN!(3) PRINT #2, "COEFFICIENTS OF INITIALIZATION ARRAY ARE: " PRINT #2, XN!(1), XN!(2), XN!(3) ' CHECK THE FIT FOR 1% = 1 TO RDAT% F F : ( I % ) = XN!(1) + JX! (1%) / (2 • SFLOW!) + XN! (2) * JX!(I%) NEXT 1% ' CALCULATION OF THE CORRELATION OF THE FIT YM! = 0! FOR 1% = I TO RDAT% YM! ^ YM! + AX!(1%) / RDAT% NEXT 1% SY2! = 0! SYX2! = 0! FOR 1% = 1 TO RDAT% SY2! = SY2! + (AX!(I%) - YM!) 2 / (RDAT% - 1) SYX2! = SYX2! + (AX!(I%) - FF!(I%)) 2 / (RDAT% - 2) NEXT 1% RFIT! = SQR(I! - SYX2! / SY2! ) PRINT USING -& #.###"; "CORRELATION OF FIT = " ; RFIT! PRINT #2, USING "& #.###"; "CORRELATION OF FIT = "; RFIT! END SUB
2 + XN!(3) * JX!(I%)
««*«...»»»»»•,»»»»»»,.... SUBROUTINES *••••»•••«••*•****•••**»***»•** SUB JQCALC SUBROUTINE TO GET JQ ESSENTIALLY USING E813-1987 VERSION PARAMETER DEFINITION FIT EQUATION J = CI (DEL A ) " C2 IF NUMDAT% < 4 THEN PRINT "TOO FEW DATA FOUND - FIX AND RE-RUN" STOP END IF ' OBTAIN THE REDUCED DATA SET FOR Jic CALCULATION J% = 1 FOR 1% = 1 TO NUMDAT% IF AM!(1%) - ASHFT! < DELAMIN! THEN GOTO 8801 IF AM!(I%) - ASHFT! > DELALIM! THEN GOTO 8801 IF JM!(1%) > JLIMIT! THEN GOTO 8801 IF AM! (1%) - ASHFT! < JM!(I%) / (SLOPEM! * SFLOW!) + .15 THEN GOTO 8801 IF AM! (1%) - ASHFT! > JM!(I%) / (SLOPEM! * SFLOW!) + 1.5 THEN GOTO 8801 JZ!(J%) = JM!(1%) AZ!(J%) = AM!(I%) - ASHFT! 'NOW DELTA A'S J% = J% + 1 8801 : NEXT 1% NFIT% = J% - 1 IF NFIT% < 2 THEN PRINT "TO LITTLE DATA TO CALCULATE A SLOPE - JQCALC" STOP END IF FOR 1% = 1 TO NFIT% X!(1%) = LOG(AZ!(1%)) Y!(1%) = LOG(JZ!(1%)) NEXT 1% CALL SLOPE BQ# = EXP(BQ#) ' CALCULATE THE JIc VALUE USING A SIMPLE ITERATIVE TECHNIQUE " AL9# = .5 ' INITIAL GUESSES JL9! = 200 ITERATEl: FL8! = -BQ# * AL9# MQ# + SLOPEM! * SFLOW! * (AL9# - .2) FL9! = -BQ# * MQ# * AL9# (MQ# - 1) + SLOPEM! * SFLOW! AQ# = AL9# - FL8 ! / FL9 ! JQ! = BQ# * AQ# HQ# IF ABS((JQ! - JL9!) / JQ! ) < .01 THEN GOTO GOTJIC
APPENDIX A: SOFTWARE LISTINGS AL9# = AQ# JL9! = JQ! GOTO ITERATEl GOTJIC: ' LOOP TO GET DEL A MIN (NEWTON RAPHSON)
LOOPDELA: DELAX] = AQ# ENTERl: FLN! = -BQ# * DELAX! MQ# + (SFLOWl • SLOPEM!) * (DELAX! - .15) FLO! = -MQ# » BQ# * DELAX! (MQ# - 1) + (SFLOW! * SLOPEM!) DELAMIN! = DELAX! - FLN! / FLD! IF (DELAMIN! - DELAX!) / DELAMIN! < .01 THEN GOTO LOOPIEND DELAX! ^ DELAMIN! GOTO ENTERl LOOPIEND: ' LOOP TO GET DEL A LIM (NEWTON RAPHSON) DELMXX! = 2! ENTER2: FLN! = -BQ# • DELMXX! MQ# + (SFLOW! * SLOPEM!) * (DELMXX! FLD! = -MQ# * BQ# * DELMXX! (MQ# - 1) + (SFLOW! * SLOPEM!) DELALIM! = DELMXX! - FLN! / FLD! IF (DELALIM! - DELMXX!) / DELALIM! < .01 THEN GOTO L00P2END DELMXX! = DELALIM! GOTO ENTER2
OUTPUT RESULTS PRINT NFIT%, " DATA SETS WERE FOUND IN THE EXCLUSION REGION " PRINT #2, PRINT PRINT " THE FIT COEFFICIENTS ARE: " PRINT #2, " THE FIT COEFFICIENTS ARE: " PRINT PRINT #2, PRINT USING "S #.###-; - POWER COEFFICIENT (C2) = •; MQ# PRINT #2, USING "5, #.###"; " POWER COEFFICIENT (C2) = "; MQ» PRINT USING •& ####.#-; " AMPLITUDE COEFFICIENT (CD = "; BQ# PRINT #2, USING "S ####.#"; " AMPLITUDE COEFFICIENT (CD = "; BQ# PRINT USING "& #.####"; " FIT COEFFICIENT ( R) = ": RQ# PRINT #2, USING "5, #.####": ' FIT COEFFICIENT ( R) = "; RQ# PRINT PRINT #2, PRINT USING "& ####.#-; " JQ = -; JQ! ; " k J / m 2" PRINT #2, USING "S ####.#"; " JQ = ": JQ! ; " It J / in 2" PRINT USING -5, #.#(t#": • CRACK EXTENSION AT JQ = "; I \Q#; " mm" PRINT #2, USING "S #.###"; " CRACK EXTENSION AT JQ = "; AQ#; " PRINT USING "St ### ,# #": " DEL A MIN = "; DELAMIN!; - mm" PRINT USING -& ### .##": - DEL A LIM = -; DELALIM!; " mm" PRINT #2, USING "S ###.##"; " DEL A MIN = "; DELAMIN!! ; " mim" PRINT #2, USING "& ##».##"; " DEL A LIM = "; DELALIM! ; " mm" PRINT PRINT #2, F9% = 0
SUB SLOPE SUBROUTINE TO CALCULATE LEAST SQUARES BEST FIT STRAIGHT LINE DIM Bl#(3, 3 ) , Xl#(3) Xl#(l) = 1 FOR 1% = 1 TO 3 FOR J% = 1 TO 3 B1#(I%, J%) = 0 NEXT J% NEXT 1% FOR K% = 1 TO NFIT% Xl#(2) = X!(K%) Xl#(3) = Y!(K%) FOR 1% = 1 TO 3 FOR J% = 1% TO 3 B1#(I%, J%) = B H (1%, J%) + X1#(I%) * X1#(J%) NEXT J% NEXT 1% NEXT K% Ql# = (Bl#(l, 1) * Bl#(2, 2) - Bl#(l, 2) 2) / (Bl#(l, 1) • (Bl#(l, 11 - 11 ) Q2# = (Bl»(l, 1) * Bl#(3, 3) - Bl#(l, 31 2) / (Bl#(l, 1) * (Bl#(l, D - 11 1 MQ# = (Bl#(l, 1) * Bl#(2, 3) - B H (1,. 2) • Bl#(1, 3)) / (Bl#(l, D • Bl#(2, 21 BQ# = (Bl#(l, 3) - MQ# * Bl#(l, 2)) / Bl#(l, 11 RQ# = MQ# * SQR(Q1# / Q2#) SUB
63
Appendix B: ASTM Fracture Test Standards E 1737 and E 1290
MNL27-EB/May 1996
Designation: E 1737 - 96
Standard Test Method for J-integral Characterization of Fracture Toughness** This standaid is issued under the fixed designation E 1737; the number immediately following the designation indicates the year of oiigiDal adoption or, in the case of revision, the year of lastrevision.A number in parentheses indicates the year of last reapproval. A supeiscript epsilon (c) indicates an editorial change since the lastrevisionor reapproval.
priate safety and health practices and determine the applica1. Scope bility of regulatory limitations prior to use. 1.1 This test method covers the determination of fracture toughness as characterized by the /-integral. Three toughness 2. Referenced Documents properties are identified which vary with the amount of crack extension present at test termination: (a) instability without 2.1 ASTM Standards: significant prior crack extension (Jc); {b) onset of stable crack E 4 Practices for Load Verification of Testing Machines^ extension (Jj^; (c) stable crack growth resistance curve E 399 Test Method for Plane-Strain Fracture Toughness (J-R)? A fourth quantity (7J not currently interpretable as a of Metallic Materials^ toughness property may be measured at fracture instability E 616 Terminology Relating to Fracture Testing^ following stable crack extension. The method applies specif3. Terminology ically to geometries that contain notches and flaws that are sharpened with fatigue cracks. The recommended specimens 3.1 Terminology E 616 is applicable to this test method. are generally bend-type specimens that contain deep initial 3.2 Definitions: cracks. The loading rate is slow and environmentally assisted 3.2.1 effective thickness Bg[L]—for compliance-based cracking is assumed to be negligible. crack extension measurements B^ = B — (B - Bj^)^/B. 1.1.1 The recommended specimens are the pin-loaded 3.2.2 effective yield strength, (7y[FL~^]—an assumed compact (C(T)), the single, edge bend (SE(B)), and the pinvalue of uniaxial yield strength that represents the influfence loaded disk-shaped compact (DC(T}) specimen. All speciof plastic yielding upon fracture test parameters. mens have in-plane dimensions of constant proportionality NOTE 1—a is calculated as the average of the 0.2 % offset yield for all sizes. strength ays, and the ultiniate tensile strength a^s, for example: 1.1.2 Specimen dimensions are functions of the ratio of 'YS + a^ /-integral to the material effective yield strength, thus the specimen design details must be based on known or estiNOTE 2—In estimating ay, the influence of testing conditions, such mates mechanical properties. as loading rate and temperature, should be considered. 1.1.3 The objective of this test method is to set forth a method and to specify Umitations for testing prescribed 3.2.3 estimated crack extension, Aa[L]—an increase in bend-type specimens that will result in /-integral fracture estimated crack size (Aa = a — a^). toughness values of materials that will be geometry insensi3.2.4 estimated crack size a[L]—^the distance from a tive. reference plane to the observed crack front developed from measurements of elastic compliance or other methods. The 1.1.4 The single specimen elastic compUance method is reference plane depends on the specimen form, and it is detailed herein, but other techniques for measuring crack normally taken to be either the boundary, or a plane length are permissible if they equal or exceed the accuracy containing either the load line or the centerline of a specimen requirements of this test method. For example, a dc electric or plate. The reference plane is defined prior to specimen potential method is described in Annex A5. deformation. 1.1.5 A multiple specimen technique for Jj^ measurement 3.2.5 Jc, J[FL~^]—a value of / (the crack extension requiring five or more identically prepared specimens tested resistance under conditions of crack-tip plane strain) at to different crack extensions and displacements is presented fracture instability prior to the onset of significant stable in Annex A4. crack extension. 1.2 The values stated in SI units are to be regarded as the 3.2.6 //£, /[FL~']—a value of / (the crack extension standard. The values given in parentheses are for informaresistance under conditions of crack tip plane strain) near the tion only. 1.3 This standard does not purport to address all of the onset of stable crack extension as specified in this test safety concerns, if any, associated with its use. It is the method. responsibility of the user of this standard to establish appro- 3.2.7 / ^ J[FL~^]—a value of / measured at fracture instability after the onset of significant stable crack extension. It may be size dependent and a function of test ' This test method is under the jurisdiction of ASTM Committee E-8 on specimen geometry. Fatigue and Fracture and is the direct responsibility of Subcommittee E08.08 on 3.2.8 J-integral, J[FL~^]—a mathematical expression, a Elastic-Plastic Fracture Mechanics Technology. Current edition approved March 10, 1996. Published May 1996. ^Information on /{-curve round-robin data is available from ASTM as a research report Request RR: E24-1011.
^ArmuaJ Book ofASTM Standards, Vol 03.01.
67 Copyright
1996 b y A S I M International
www.astm.org
E1737 thickness which is equivalent to length of crack front. 4.3 For Jic determination, the / versus crack growth behavior is approximated with a best fit power law relationship. A construction Une is drawn, approximating crack tip stretch effects. The construction line is calculated from materialflowproperties or determined experimentally. Draw an offset line parallel to the construction line but offset by DISCUSSION—In this test method, the J-R curve is a plot of the 0.2 mm. The intersection of this hne and the power law fit far-field /-integral versus physical crack extension (Aa^) or estimated defines //„ provided the requirements of this test method are crack extension (Aa). It is recognized that the far-field value o f / m a y not satisfied. represent the stress-strain field local to a growing crack. 4.4 For J-R curve determination, this test method de3.2.10 net thickness, Bff[L\—distance between the roots scribes a single specimen technique. The J-R curve consists of the side grooves in side-grooved specimens. of a plot of / versus crack extension, in the region of 3.2.11 original crack size, OgiL]—the physical crack size /-controlled growth, and is size independent provided that at the start of testing. the requirements of this test method are satisfied. For the NOTE 3—In this test method, a^ is the initial crack length estimated procedure described in this test method, crack length and by elastic compliance. crack extension are determined from elastic comphance 3.2.12 original uncracked ligament, bo[L]—distance from measurements. These measurements are taken on a series of unloading/reloading segments spaced along the load-versusthe original crack front to the back edge of the specimen, that displacement record. Other methods such as dc electric is: potential can be used to estimate crack length and crack b„=W-a„ extension. 3.2.13 physical crack extension, AOplL]—an increase in 4.5 An alternative, multi-specimen technique can be used physical crack size (AOp = ap- a,,). to obtain 7/^ This technique requiresfiveor more identically 3.2.14 physical crack size, ap[L]—the distance from a prepared specimens tested to different crack opening disreference plane to the observed crack front. This distance placements. This technique uses optical measurements of may represent an average of several measurements along the crack extension on the fiacture surfaces after the test. crack front. The reference plane depends on the specimen 4.6 Supplemental information about the background of form, and it is normally taken to be either the boundary, or a this test method and the rationale for many of the technical plane containing either the load hne or the centerUne of a requirements of this test method are contained in Ref (1).* specimen or plate. The reference plane is defined prior to specimen deformation. 3.2.15 precrack load, PM[P\—the allowable precrack 5. Significance and Use load. 5.1 The /-integral values measured by this test method 3.2.16 remaining ligament, b[L\—distance from the characterize the toughness of ductile materials that lack physical crack front to the back edge of the specimen, that is: sufficient size and thickness to be tested for Kjc in accordance with the reqixirements of Test Method E 399. b=W-ap 5.1.1 The /-integral values can be used as indexes of 3.2.17 specimen span, S[L]—distance between specimen material toughness for alloy design, materials processing, supports for the SE(B) specimen. materials selection and specification, and quaUty assurance. 3.2.18 specimen thickness, B[L]—the side to side dimen5.1.2 The /-integral value for most structural metals is sion of the specimen being tested. 3.2.19 specimen width, W[L\—a physical dimension on a independent of testing speed in the quasi-static regime. The value becomes a function of testing speed in the dynamic test specimen measured from a reference position such as the regime. Cyclic loads or environmental attack under susfront edge in a bend specimen or the load line in the compact tained stress, or both, can cause additional contributions to specimen to the back edge of the specimen. crack extension. Therefore, the application of /-integral values in design of service components should be made with 4. Summary of Test Method full cognizance of service conditions. 4.1 This test method involves three-point bend loading or 5.1.3 /-integral values can be used to evaluate materials in pin loading of fatigue precracked specimens and determinaterms that can be significant to design, and for evaluation of tion of J as a function of crack growth. Load versus load-Une materials with flaws. displacement is recorded. The /-integral is determined and 5.1.4 This test method is appUcable for a wide range of plotted against estimated or physical crack growth, Aa or ductile engineering materials. However, there are high ducAflp, within specified Umits of crack growth. The resulting tility, high toughness materials for which this test method is data reflect the material's resistance to crack growth. not appUcable. The prescribed procedure may result in 4.2 For J^ determination, / is evaluated from a loadunsatisfactory results when applied to materials with exdisplacement record which is terminated by firacture instatremely high tearing resistance because crack growth due to bility prior to significant stable crack extension. The value of physical tearing of the material may be virtually indistin/,, determined by this test method represents a measure of fracture toughness at instabiUty without significant stable crack extension that is independent of in-plane dimensions. * The boldface numbers in parenthesesreferto thereferencesat the end of this test method. However, there may be a dependence of toughness on line or surface integral over a path that encloses the crack front from one crack surface to the other, used to characterize the local stress-strain field around the crack front. See Terminology E 616 for further discussion. 3.2.9 J-R curve—a plot of resistance to stable crack extension, Aa or Aa^.
68
#
E 1737
guishable from extensive crack tip blunting. 5.2 The J-R curve characterizes, within the Umits set forth in this test method, the resistance of metallic materials to slow stable crack growth after initiation from a pre-existing fatigue crack. 5.2.1 The J-R curve can be used to assess the significance of cracks in structural details in the presence of ductile tearing, with awareness of the difference that may exist between laboratory test and field conditions. 5.3 Jjc, as determined by this test method, characterizes the tou^ness of materials near the onset of stable crack extension from a preexisting fatigue crack. 5.3.1 Jjc and J^ values may be converted to their equivalents in terms of stress-intensity factor, Kj (2), if dominant elastic conditions for the application can be demonstrated. The Kj valuesfi-om//^ correspond to the material toughness near the onset of stable crack extension in a dominant linear elastic stress field that contains a preexisting crack. The Kj values from Jc correspond to the material toughness near the onset of unstable crack extension in a dominant linear elastic stress field containing a preexisting crack. The Jjc and J^ values according to this test method cannot be used to obtain Kj^ values according to Test Method E 399. 5.4 The value of J^. determined by this test method represents a measure of fracture toughness at instability without significant stable crack extension that is independent of in-plane dimensions. However, there may be a dependence of toughness on thickness, equivalent to a dependence on crack front length. 5.4.1 Values of/• increment of crack mouth opening displacement,
A2. SPECIAL REQUIREMENTS FOR TESTING COMPACT (C(T)) SPEQMENS A2.1 Specimen: A2.1.1 The standard compact specimen is a single-edge notched and fatigue-cracked plate loaded in tension. Two specimen geometries which have been used successfully are shown in Fig. A2.1. A2.1.2 Alternative specimens may have 2 < W/B < 4 but with no change in other proportions.
A2.2 Specimen Preparation—For generally applicable specifications concerning specimen size and preparation see Section 7. A2.3 Apparatus: A2.3.1 Tension Testing Clevis: A2.3.1.1 A loading clevis suitable for testing compact specimens is shown in Fig. A2.2. Both ends of the specimen
B = 0.5W
2H=1.2W iO.OlOW
COMPACT TEST SPECIMEN FOR PIN OF 0.24W (+0.000W/-0.005W) DIAMETER
1.25W±0.01W W±0.005W
B = 0.5W
1 0375W
0.2 IW (max) J
L
© 3J--
T o.iw T
r
O.IW
^"-t-^VjUSSW DIA.
COMPACT TEST SPECIMEN FOR PIN OF O.I875W(+O.OOOW/-0.001W)DIAMETER NOTE 1—A surface shaH be perpendicular and parallel as applicable witNn 0.002 TIR. NOTE 2—The Intersection of the crack starter notch tips on each surface of the spedmen shall be equally distant within 0.005 IV from ^ NOTE 3—See Fig. 2.
FIG. A2.1 Two Compact Specimen Designs That Have Been Used Successfully
78
E1737 LOADING ROD THREAD
D min)
_K,—_-_-_-_--j---------v^
1^
,OSW
T
']/
26W
-J
- *
. 25W
.257 W
.25W
r—
.257 W
.135¥r
A - SURFACES MUST BE FLAT, I N - L I N E AND PERPENDICULAR, AS APPLICABLE, TO WITHIN 0.002 i n . T . I . R . (Q.D5rnm) NOTE—Comers may be removed as necessary to accommodate the dip page. FIG. A2.2 Clevis for C(T) Specimen Testing
are held in such a clevis and loaded through pins, in order to allow rotation of the specimen during testing. In order to provide rolling contact between the loading pins and the clevis holes, these holes are provided with small flats on the loading surfaces. Other clevis designs may be used if it can be demonstrated that they will accompUsh the same result as the design shown. Qevises and pins should be fabricated from steels of sufficient strength (greater than 40 HRC) to elastically resist indentation loads. A2.3.1.2 The critical tolerances and suggested proportions of the clevis and pins are given in Fig. A2.2. These proportions are based on specimens having W/B = 2 for 5 > 12.7 mm (0.5 in.) and W/B = 4 for 5 < 12.7 mm. If a 1930-MPa (280 OCiO-psi) yield strength maraging steel is used for the clevis and pins, adequate strength will be obtained. If lower-strength grip material is used, or if substantially larger specimens are required at a given ays/E ratio, then heavier grips will be required. As indicated in Fig. A2.2, the clevis comers may be cut off sufficiently to accommodate seating of the clip gage in specimens less than 9.5 mm (0.375 in.) thick. A2.3.1.3 Careful attention should be given to achieving good alignment t h r o i ^ careful machining of all auxiliary gripping fixtures. A2.3.2 Displacement Gage—For generally applicable details concerning the displacement gage see 6.3. 79
A2.4 Procedure: A2.4.1 Measurement—Measure the dimensions, B^f, B, and W to the nearest 0.05 mm (0.002 in.) or 0.5 %, whichever is larger. A2.4.2 Loading pin fiiction and eccentricity of loading can lead to errors in /determinations. Keep the centerline of the upper and lower loadipg rods coincident within 0.76 mm (0.03 in.) during the test. Center the specimen with respect to the clevis opening within 0.76 mm. Seat the displacement gage in the knife edges firmly by wiggUng the gage lightly. A2.5 Calculation: A2.5.1 Calculations of /-integral are made from load, load-point displacement curves obtained using the procedure outUned in Section 8. A2'.5.2 Calculate / a s follows: (A2.1)
/ = /w + /™
where: Jei = elastic compohent of/, and Jpi = plastic component of/. A2.5.3 At a point corresponding to V^ P, on the specimen load versus load-line displacement record as folIo\ys: (A(,))^ (1 - .^) 'w
+ /.M O
(A2.2)
#
E 1737 where: E' =E/{l-v2), Cci - corrected specimen crack opening compliance on an unloading/reloading sequence.
where: ^0 =
iBBt,W)'i^
f(at/W)
(A2.3)
with:
Ka,/\V)'
[(2 + a,/W) (0.886 + 4.64 (a,/WO - 13.32 {aJW)^ + 14.72 {aJW)^ - 5.6 (aJW)*)]
C,= (A2.4)
and: •'MO ^PKO ~ ^M^(B
5^
1 - T(/-l) •
«(i-l)
(A2.5)
"{I-1)
where: ij(,_„ = 2.0 + 0.522 6(,_i)/fr, and :^(,_,) =1.0+ 0.76 6(,_.)/^A2.5.4 In Eq A2.5, the quantity Ap^^ - ^p/(,_i) is the increment of plastic area under the load versus load-line displacement record between lines of constant displacement at points /-I and /, see Fig. A1.3. The quantity Jp^-^ represents the total crack-growth-corrected plastic / at point i and is obtained in two steps by first incrementing the existing Jpm-i) and then by modifying the total accumulated result to account for the crack growth increment. Accurate evaluation of Jp^-^ from the relationship in A2.5 requires small and uniform crack growth increments consistent with the data spacing requirements of 8.4.4. The quantity Ap,(0 can be calculated from the following equation:
c, rH* rD — sine -- cosB — sin9 - cos8 R R
(A2.10)
and (Fig. A2.3): Cy = measured specimen elastic compliance (at the load line), //*= initial half-span of the load points (center of pin holes), R = radius of rotation of the crack centerline, (W + a)/2 where a is the updated crack length, D = one-half of the initial distance between the displacement measurement points, 6 ~ angle of rotation of a rigid body element about the unbroken midsection line, or d = sin-' [(dJ2 + D)/{D2 + i?2)i/2] _ tan"' (D/R), and d„ - total measured load-line displacement. A2.5.6 Other compliance equations are acceptable if the resulting accuracy is equal to or greater than those described and the accuracy has been verified experimentally.
H*
e
_i_^
D-f (I ^PUD ~ ^M'-i) ^
^
0
(AZ.O)
where: ^pi(i) - plastic part of the load-Une displacement = F, (P,C„.), and Cci = corrected compliance (see A2.5.5) required to give the current crack length, a,. For test methods that do not utiUze the elastic compliance techniques, C, can be determined from knowledge of Uj/W using the following equation:
\
I'^+^M
1
C, =
(
TAN-^ (D/R)
'-f 2.1630 + 12.219 (a,IW) - 20.065 (aJWf(A2.7)
E'B,\W-aJ - 0.9925 (a,/W)^ + 20.609 (a,/MO" -9.9314 (a,/WO']
A2.5.5 For QJ) specimens, the crack length is given by: at/W'= 1.000196 - 4.06319 U^ + 11.242 U/ - 106.043 UJ + 464.335 U* - 650.677 Uj
(A2.8)
where: t4
1
IB^'CJ'/^ + 1
(A2.9)
FIG. A2.3
Elastic Compliance Correction for Specimen Rotation
A3. SPECIAL REQUIREMENTS FOR TESTING DISK-SHAPED COMPACT (DC(T)) SPECIMENS A3.1 Specimen: A3.1.1 The standard disk-shaped compact specimen, DC(T), is a single-edge notched and fatigue-cracked plate loaded in tension (H). A specimen geometry which has been
used successfully is shown in Fig; A3.1. A3.1.2 Alternative specimens may have 2 < W/B < 4 but with no change in other proportions. A3.2 Specimen Preparation: 80
#
E 1737
.25W».005W DIA 2 HOLES
my
3k.
22° 30'
~r22°30'
^ ''^A B B=W/2 •.OlOW NOTE NOTE NOTE NOTE NOTE readings
1—A surface shall be perpendicular and parallel as applicable within 0.002 W TIR. 2—The intersection of the crack starter notch tips on each surface of the specimen shall be equally distant within 0.005 W from the centerline of the loading holes. 3—Integral or attached knife edges for clip gage attachment to the crack mouth may be used. 4—For starter notch and fatigue crack configuration see Fig. 2. 5—Circularity requirements measure radius at eight equally spaced points around the circumference. One of these points shall be the notch plane. Average to obtain radius. All values shall be within 5 % of the average. FIG.
A3.1
Disk-Shaped Compact Specimen DC(T) Standard Proportions and Tolerances
A3.2.1 For generally applicable specifications concerning specimen size and preparation, see Section 7. A3.3 Apparatus: A3.3.1 Tension Testing Clevis: A3.3.1.1 A loading clevis suitable for testing compact specimens is shown in Fig. A2.2. Both ends of the specimen are held in such a clevis and loaded through pins, in order to allow rotation of the specimen during testing. In order to provide rolling contact between the loading pins and the clevis holes, these holes are provided with small flats on the loading surfaces. Other clevis designs may be used if it can be demonstrated that they will accomplish the same result as the design shown. Clevises and pins should be fabricated from steels of sufficient strength to elastically resist indentation loads (>40 HRC). A3.3.1.2 The critical tolerance and suggested proportions of the clevis and pins are given in Fig. A2.2. These proportions are based on specimens having W/B = 2 for 5 > 12.7 mm (0.5 in.) and W/B = 4 for 5 < 12.7 mm (0.5 iii.). If a 1930-MPa (280 000-psi) yield strength maraging steel is used for the clevis and pins, adequate strength will be obtained. If lower strength grip material is used, or if substantially larger specimens are required at a given ays/E ratio, then heavier grips will be required. As indicated in Fig. A2.2, the clevis comers may be cut off sufficiently to accommodate seating of the clip gage in specimens less than 9.5 mm (0.375 in.) thick. A3.3.1.3 Careful attention should be given to achieving good alignment through careful machining of all auxiliary gripping fixtures. A3.3.2 Displacement Gage-^Foi generally applicable details concerning the displacement gage see 6.3. A3.4
measurements of circularity as well as width, W, crack length, a, and thicknesses, B and B^^ should be made. Measure the dimensions, B^ and B to the nearest 0.05 mm (0.002 in.) or 0.5 %, whichever is larger. A3.4.1.1 The specimen blank should be checked for circularity before specimen machining. Measure the radius at. eight equally spaced points around the circumference of the specimen blank. One of these points should lie in the intended notch plane. Average these readings to obtain the radius, r. If any measurement differs from r by more than 5 %, machine the blank to the required circularity. Otherwise, D = 2/-= 1.35 W. A3.4.1.2 Measure the width, W, and the crack length, a, from the plane of the centeriine of the loading holes (the notched edge is a convenient reference line but the distance from the centerline of the holes to the notched edge shall be subtracted to determine ff'and a). Measure the width, W, to the nearest 0.05 mm (0.002 in.) or 0.5 %, whichever is larger, at not less than three positions near the notch location and record the average value. A3.5 Calculation: A3.5.1 Calculation of J—For the disk compact specimen calculate J as follows: J=Jel + Jpl (A3.1) where: Jgi = elastic component of/, and Jpi = plastic component of 7. For the DC(T) specimen at a point corresponding to a,, v„ and P-i on the specimen load versus load-line displacement record as follows: _ (^(,/ (1 - ^)
Procedure:
•fin •'(i)'
A3.4.1 Measurement—The analysis assumes the specimen was machined firom a circular blank and therefore
^0-
81
E P< iBB^W)U2^
+ 1PKO
(A3.2)
MIW)
(A3.3)
®
E 1737 specimen method using an elastic compliance technique on disk-shaped compact specimens with crack opening displacements measured at the load-line, the crack length is given as follows: atlW= 0.998193 - 3.88087 U^ + 0.187106 tA,^ + 20.3714 t; 3 _ 45.2125 U* + 44.5270 UJ (A3.8) where:
where: „ ,^ '
(2 + a,IW){0n6 + 4M,/W- 11.58 (a^/HO^ + 11.43 (a,/^^-4.08 (a,/WQ") (l-a,/ff0'/2 1 - 7/-,
(a, - a/-i)
(A3.4) (A3.5)
bi-x
where: l(,-i) = 2.0 + 0.522 ^^.D/W, and
U = [(5^'C„)'/2 + 1]
T(,-o =1.0+ 0.76 Vo/^^A3.5.2 In Eq A3.5, the quantity Ap^,-) - ^p/(,_i) is the increment of plastic area under the load versus load-line displacement record between lines of constant displacement at points i-l and i, see Fig. A1.3. The quantity Jpifu represents the total crack growth corrected plastic / at point / and is obtained in two steps byfirstincrementing the existing Jpi(i-i) and then by modifying the total accumulated result to account for the crack growth increment. Accurate evaluation of Jpidj from the above relationship requires small and uniform crack-growth increments consistent with the data spacing requirements of 8.4.4. The quantity Apidj can be calculated from the following equation: (Pi + Pi-i)(ypK.->-^pK = B^bo
where: Api= area A as shown in Fig. A4.1. For the C(T) specimen at a point corresponding to F,, P, on the specimen load versus load-Une displacement record as follows: K^ (1 - iP) (A4.6) / = + /„/ where: K=
[(BB!^W)''\ for the C(T) specimen: ,,
,„^
(A4.7)
fiajm
(2 + aJW) (0.886 + 4.64 (aJW) - 13.32 (aJTVf + 14.72 (aJffO^-5.6 (a„/WO")
f{aj W) =
—
(A4.8)
and for the DC(T) specimen: (2 + aJW) (0.76 + 4.8 aJW- 11.58 {aJWf + 11.43 {aJWf - 4.08 {aJWf) (A4.9) RaolW) = (1 - aJW)^^ and: Jpi-
(A4.10) B^bo
where: n = 1 •¥ Q.522 bJW. Api — Area A as shown in Fig. A 4 . 1 . A4.3.3 Plot / versus Aa as shown in Fig. 5. Determine a construction line in accordance with the following equation:
(A4.1)
/=2(TyAa
(A4.11)
Plot the construction line, then draw a n exclusion line parallel to the construction Une intersecting the abscissa at 0.15 m m (0.006 in.). Draw a second exclusion line parallel to the construction line intersecting the abscissa at 1.5 m m (0.06 in.). Plot all / - A a data points that fall inside the area enclosed by these two parallel hues and capped by J^^^ — boay/lS. Make sure that data spacing meets the requirements of 9.9.3. A4.3.4 Plot an offset Une parallel to the construction a n d exclusion Unes at a n offset value of 0.2 m m (0.008 in.). A4.3.5 Using a method of least squares determine a linear regression Une of the foUowing form:
(I - y2)
+ /,pi
(A4.3)
with:
where: Jei = elastic component of/, and /p/ = plastic component of/. For the SE(B) specimen at a point corresponding to Fj and P, on the specimen load versus load-hne displacement record as follows: ^
AaJW)
(A4.2)
/n / = /« C, + C2 ln(Aa/k)
(A4.12)
where /c = 1.0 m m or 0.0394 in. Use only the data which conform to the requirements stated in the previous sections. Plot the regression Une as illustrated in Fig. 4. A4.3.6 The intersection of the regression Une of A4.3.5
Total Load-Line Displacement, v FIG. A4.1 Definition of Area for J Calculation
83
E1737 with the offset line of A4.3.4 defines JQ and AOQ. TO determine this intersection the following procedure is recommended. A4.3.6.1 Estimate an interim /Q(I) value from the data plot. A4.3.6.2 Evaluate Afl(,) from: Aa(,) = -^^ + 0.2 mm (0.008 in.) 2ffy
(A4.13)
A4.3.6.3 Evaluate an interim J^^j) froni ^^'^ following
power law relationship: C,(Afl(„//:)C' (A4.15) where k= \S) mm or 0.0394 in. A4.3.6.4 Return to A4.3.6.2 and A4.3.6.3 to get Aa(,+i) and interim /Q(/+2) until the JQ values converge to within ±2%. A4.4 Qualify this JQ value as //^ using the applicable requirements of 9.7, (that is, 9.7.1, 9.7.2, 9.7.3, 9.7.4, 9.7.9), and 9.9.
A5. GUIDELI^fES FOR DIRECT CURRENT ELECTRIC POTENTIAL DETERMINATION OF CRACK SIZE A5.1 Applications—Electric potential (EP) procedures for crack-si2B determination are appUcable to virtually any electrically conducting material in a wide range of testing environments. The d-c EP technique reUes on simple calibrations for standard geometries, and can yield a higher density of points to define a J-R curve than is typically achievable using elastic compliance procedures. The procedures discussed herein are those for which two-dimensional models can be used both for the specimen configuration and for the electric potential. A5.2 Measurement Principles—Determining crack size from electric potential measurements relies on the principle that the electric field in a cracked sample with a current flowing through it is a function of the sample geometry, and in particular the crack size. For a constant current flow, the electric potential or voltage difference across the crack plane will increase with increasing crack size due to modification of the electrical field and associated perturbation of the current streamUnes. The change in voltage can be related to crack size through analytical or experimental caUbration relationships. A5.3 Basic Method: A5.3.1 A constant current is passed through the sample resulting in a two dimensional electricfieldwhich is constant through the thickness at all points. The large scale crack tip plasticity associated with fracture of ductile materials can
increase the measiued electric potential due to resistivity changes without crack extension. These resistivity changes shall be properly accounted for in order to accurately determine crack extension in ductile materials. A5.3.2 Changes in the sample or instrumentation may result in proportional changes in the measured voltage. For example, a TC change in specimen temperature can result in a significant change in the EP signal due to the change in the material's electric resistivity. Also, some materials exhibit time-dependent conductivity changes while at elevated temperatures. Variations in the gain of amplifiers or calibration of voltmeters may also result in a proportional scaling of the measured voltages. To compensate for these effects, voltage measurements can be normalized using additional voltage measurements taken at a reference location. The reference location may be either on the test sample or on an alternate material sample in the same environment. If the reference measurements are made directly on the test sample, the location shall be chosen so that the reference voltage is not affected by crack size. Since all material and instrument variations are also included in the reference measurements.
D C CURREIsrr CIRCUIT DC Current Source
o o
ME/^UREMENT CIRCUIT
Anplifier Vbllmeter ~\. (Optional)
Recording Device
2Y= W/3 FiG. AS.2
n o . AS.1 Schematic Diagram of ttie dc Potentiai System
84
Scliematic of C(T) Specimen dc Potentiai Connections
E1737 sufficient resolution, accuracy, and stability characteristics. The dc method requires equipment capable of measuring small changes in dc voltage (for example, 0.05 to 0.5 nv) with relatively low dc signal to noise ratios. Although there are a variety of ways to implement the voltage measurement system, three commonly used systems include amplifier/ autographic recorder, amplifier/microcomputer analog to digital converter, and digital voltmeter/microcomputer. Autographic recorders are commonly available with suitable sensitivity and can be used to record the output voltage directly from the sample. A preamplifier can be used to boost the direct voltage output from the sample before recording. Another common technique uses a preamplifier to boost the direct output from the sample to a level that can be digitized using a conventional analog to digital converter and microcomputer. A third method makes use of a digital voltmeter with a digital output capabihty. The advantage of this type of system is that all of the sensitive analog circuits are contained -W/4 within a single instrument. A5.6 Crack Length Versus Electric Potential Relation2Y= 07W ships: A5.6.1 Closed form solutions for the relationship between FIG. A5.3 Alternative C(T) Specimen dc Potential Lead Positions electric potential versus crack size have been analytically derived for the SE(B) and C(T). These are described in A5.7. the normalization process should eliminate them. Use of A5.6.2 It is also possible to empirically develop relationreference voltage measurements can significantly increase ships for virtually any type of sample geometry used in J-R crack size resolution for some materials. curve testing. Such empirical relationships can be advantaA5.3.3 Typical apparatus for the d-c EP technique is geous in instances when sample geometries are complex, or shown in Fig. A5.1. The output voltages are typically in the wire placement has been altered. Analytical or empirical 0.1 to 50.0 mV range for common current magnitudes (5 to SO A), sample dimensions, and materials. Precise measure- relationships should be experimentally verified using alternative measurements at various crack sizes in the range of ments (typically ±0.1 %) of these relatively small output interest (optical surface measurements, compliance measurevoltages shall be made to obtain accurate crack size values. ments, or post-test fiacture surface measiu-ements). Such To obtain sufficient voltage resolution usually requires measurements should be reported and may be used for special care in eliminating electrical noise and drift. correcting crack lengths estimated from closed form equaA5.3.4 The d-c method is susceptible to thermoelectric tions. effects which produce d-c potentials in addition to those due A5.6.3 Voltage wire placements are usually a compromise to the sample electrical field. These thermoelectric voltages between good sensitivity to crack size changes and immunity can be a substantialfiractionof the total measured voltage. to errors caused by minor variations in lead location from Since the thermoelectric effect is present even without the sample to sample. Near crack tip lead locations yield better input current, it is possible to account for it by subtracting sensitivity to changes in crack size or to crack initiation. The voltage measurements taken with the current off from the difficulty with this type of arrangement is that the electrical measurements made with the current on. An alternative field is, in general, highly nonuniform in the near tip region. method corrects for the thermoelectric effect by taking Thus, minor variations in lead placement from one sample voltage measurements while reversing the direction of curto the next may produce significant differences in measured rentflow.Corrected EP measurements are then equal to one voltage for the same crack size. In most cases those positions half of the difference of the measured potential readings which give greatest sensitivity to crack size changes also have taken at each current polarity. A5.4 Current Generating Equipment—A constant current the greatest sensiti\dty to variations in lead wire positioning. A5.6.4 Current input wire locations also represent a shall be maintained by the power supply with sufficient compromise between uniformity and sensitivity. Placement short- and long-term stability. The required stabihty is a of the' current inputs near the crack tip region focuses the fimction of the resolution of the voltage measurement current streamlines there resulting in increased sensitivity to equipment (see A5.5) and the-desired crack size resolution. crack initiation. Placement of the current leads midway For optimum conditions, the relative stability of the power across the remaining ligament tends to provide a more supply ishould be equal to the effective resolution of the uniform current field for crack growth. voltage measurement system; that is, if the voltage measurement system can effectively resolve one part in 10(X) of the A5.7 Specimen Geometries: output voltage fi-om the sample (including electric noise, A5.7.1 Specimen geometries for Jjc/J-R curve testing inherent inaccuracies such as nonlinearity, etc.), then the covered in this annex are the compact tension, QT), and power supply should be stable to one part in 1000. single AB! THEN BG! = AB!: JJ% = 1% NEXTI% IF }}% = K% GOTO REDUCE INTERCHANGES ROWS TO GET MAX PIVOT ELEMENT FOR J% = K% TO U% TE! = AN!(JJ% J%) AN!{JJ%.J%) = AN!(K% J%) AN!(K%^%) = TE! NEXTJ%
XI. 1 To fit the equation of 9.2.1 to the RDAT /,, a, data using the method of least squares, the following equation must be set up and solved for a,^ B, and C: Sa,-
S/, .Oy
S f l ^2
2a^.
RDATZJj^-LJ?
_
3 _
2 J? 2 Jr' 2 7,«
XI.2 This equation can be set up and solved using a standard spreadsheet. The Microsoft QuickBASIC program which follows can also be used to accomplish this process. SUBJFIT SUBROUTINE TO SET UP FUNCTION FOR Aoq EVALUATION USES EQUATION a = Aoq + J/(2*SFLOW) + B J - 2 + C J - 3 WRITTEN BY J. A. Joyce USNA, Annapolis, 1993 INPUT IS RDAT% PAIRS OF a AND J IN VECTOR ARRAYS AM! AND JM! NEED IN MAIN PROGRAM A COMMON SHARED RDAT%, AM!(), JM!(), XN!(), FF!(), AN!(), SFLOW! INITIALIZATION FOR 1% - 1 TO 3 FOR J% = 1 TO 4 AN!(I% J%) - 0. NEXTJ% NEXTI% • DO SUMMATIONS FOR LEAST SQUARES AN!(1,1) - RDAT% JISUM! = 0. FOR 1% = 1 TO RDAT% JISUM! = JISUM! + JM!(I%) AN!(1,2) - AN!(1.2) + JM!(I%)' 2 ANI(2.2) = AN!(2,2) + JM!(I%) - 4 AN!(1,3) - AN!(1,3) + JM!(I%) - 3 AN!(2,3) - AN!(2,3) + JM!(I%) - 5 AN!(3,3) - AN!(3,3) + JM!(I%) - 6 AN!(1,4) - AN!(1,4) + AM!(I%) AN!(2,4) - AN!(2,4) + AM!(I%)*JM!a%)" 2 ANI(3.4) - AN!(3,4) + AM!a%)*JM!(I%) - 3 NEXTI% AN!(2,1)» AN!(1,2) AN!(3,1)-AN!(1,3) AN!(3,2) - AN1(2,3) AN!(1,4) - AN!(I,4) - JISUM!/(2*SFL0W!) AN!(2,4) - Aisn(2,4) - AN!{l,3)/(2*SFLOWI) AN!(3,4) - AN1{3,4) - AN!(2,2)/(2*SFLOW!) • NOW SOLVE THESE EQUATIONS USING GAUSS ELIMINATION • FORXNI CALL GAUSS PRINT "COEFHCIENTS OF INmALIZATION ARRAY ARE:" PRINT XN!{1),.XN!(2), XN!(3)
DETERMINES REDUCED ELEMENTS OF TRIANGULAR SET REDUCE: FORI%=:Kl%TON% Q! = AN!(I%, K%)/AN!(K%, K%) FORJ% = KI%TOM% AN!(I%, i%) - AN!(I%, J%) - Q!»AN!(K%, J%) NEXTJ% NEXTI% FORl% = Kl%TON% AN!(I%,K%) = 0. NEXTI% NEXTK% BACK S13STITUTION FOR THE SOLUTIONS XN!(N%) = AN!(N%,M%)/AN!(N%, N%) FOR NN% - I TO L% SU! » 0. 1% = N% - NN% 11%-155+ 1 FORJ%-II%TON% SU! - SU! + AN!a%, i%) * XN!(J%) NEXT J% XN!(I%) - (AN!(I%, M%) - SU!)/AN!(I%,I%) NEXTNN% END SUB
' CHECKTHEFIT FOR 1% - 1 TO RDAT96
89 Copyright
1996 b y A S I M International
www.astm.org
E1737
REFERENCES (1) Joyce, J. A., Manual on Elastic-Plastic Fracture Laboratory Test Procedures, MNL27, ASTM, 1996. (2) Rice, J. R., Journal of Applied Mechanics, Vol 35, 1968, pp. 379-386. (3) Dawes, M. C , "Elastic-Plastic Fracture Toughness Based on the CX)D and /-Contour Integral Concepts," Elastic Plastic Fracture, ASTM STP 668, ASTM, 1976, pp. 307-333. (4) Willoughby, A. A., and Garwood, S. J., "On the Unloading Compliance Method of Deriving Single Specimen R-Curves In Three-Point Bending," Elastic-Plastic Fracture, Second Symposium. ASTM STP 803, ASTM, Vol 2, 1983, pp. 372-397. (5) Hackett, E. M., and Joyce, J. A., "Dynamic J-R Curve Testing of a High Strength Steel Using the Key Curve and Multi-Specimen Techniques," Fracture Mechanics, 17th Symposium, ASTM STP 905, ASTM, 1986, pp. 741-774. (6) Hellman, D., Rohwerder, G., and Schwalbe, K-H., "Development of a Test Setup for Measuring Deflection of Single Edge Notched Bend (SENB) Specimens," JTEVA, Vol 12, No. 1, January 1984, pp. 62-64. (7) KarisAllen, K. J., and Matthews, J. R., "The Determination of Single Edge-Notched Bend Specimen Load-Line Displacement from Remotely Located Sensors in Elastic-Plastic Fracture
Testing," JTEVA, Vol 22, No. 6, November 1994, pp. 581-583. (8) Baratta, F. I., and Underwood, J. H., "Notch Dimensions for Three-point Bend Fracture Specimens based on Compliance Analysis," JTEVA, Vol 20, No. 5, September 1992, pp. 343-348. (9) Albrecht, P., et al, "Tentative Test Procedure for Determining the Plane Strain J-R Curve," JTEVA, Vol 10, No. 6, November 1982, pp. 245-251. (10) Gudas, J. P., and Davis, D. A., "Evaluation of the Tentative JrR Curve Testing Procedure by Round Robin Tests of HY130 Steel," JTEVA, Vol 10, No. 6, November 1982, pp. 252-262. (11) Begley, J. A., Clark, G. A., and Landes, J. D., "Results of an ASTM Cooperative Test Program on the J^ of HY-130 Steel," JTEVA, Vol 8, No. 5, September 1980. (12) Yoon, K. K., Gross, L. B., Wade, C. S., and VanDerSluys, W. A., "Disk-Shaped Specimen Test Method for Determining J-R Curves and Validation by J-Tests," Fracture Mechanics: 26th Volume, ASTM STP 1256, ASTM, 1995. (13) Hackett, E. M., Kirk, M. T., and Hays, R. A., "An Evaluation of J-R Curve Testing of Nuclear Piping Materials Using the Direct Current Potential Drop Technique," NUREG/CR-4540, U.S. Nuclear Regulatory Commission, August 1986.
The Amarlcan Scxiety for Testing and Materials takes no position respecting the validity of any patent rights asserted In connection with any item mentioned in this standard. Users of this standard are expressly advised that determination of the validity of any such patent rigfits, and the risk of Infringement of such rights, are entirely their ovi/n responsibility. This standard is subject to revision at any time by the responsible technical committee and must be reviewed every five years and If not revised, either reapproved or withdrawn. Your comments are Invited either for revision of this standard or for additional standards and shouM be addressed to ASTM Headquarters. Your comments will receive careful consideration at a meeting of the responsit>le technical committee, which you may attend. If you feel that your comments have not received a fair hearing you should make your vl»w$ known to the ASTM Committee on Standards, 100 Barr Harbor Drive, West Conahohocken, PA 19428.
90
MNL27-EB/May. 1996
Designation: E 1290 - 93
Standard Test Method for Crack-Tip Opening Displacement (CTOD) Fracture Toughness Measurement^ This standard is issued under thefixeddesignation E 1290; the number immediately following the designation indicates the year of original adoption or, in the case of revision, the year of last revision. A number in parentheses indicates the year of last reapproval. A superscript epsilon (e) indicates an editorial change since the last revision or reapproval.
E 813 Test Method for J,^, A Measure of Fracture 1. Scope Toughness^ 1.1 This test method covers the determination of critical E 1152 Test Method for Determining J-R Curves^ crack-tip opening displacement (CTOD) values at one or more of several crack extension events. These CTOD values 3. Terminology can be used as measures of fracture toughness for metallic materials, and are especially appropriate to materials that 3.1 Terminology E 616 is applicable to this test method. exhibit a change from ductile to brittle behavior with 3.2 Definitions: decreasing temperature. This test method applies specifically 3.2.1 crack tip opening displacement, (CTOD), S[L]—the to notched specimens sharpened by fatigue cracking. The crack displacement due to elastic and plastic deformation at recommended specimens are three-point bend [SE(B)] or variously defined locations near the original (prior to an compact [C(T)] specimens. The loading rate is slow and application of load) crack tip. influences of environment (other than temperature) are not Discussion—In this test method, CTOD is the displacement of the covered. The specimens are tested under crosshead or clip crack surfaces normal to the original (unloaded) crack plane at the tip of gage displacement controlled loading. the fatigue precrack, fl„. J. 1.1 The recommended specimen thickness, B, is that of In CTOD testing, « 0.2 mm (0.008 in.). The load P„ and the clip gage 4.3 for applications of the recommended specimens.) For displacement v„, for 6„ are indicated in Fig. 1. In CTOD testing, S„ [L] is the value of CTOD at the first attainment SE(B) specimens the recommended initial normalized crack of a maximum load plateau for fully plastic behavior. The load P,„ and size is 0.45 ^aJW-^ 0.55. The span-to-width ratio (S/W) is the clip gage displacement v,„, for S,„ are indicated in Fig. 1. specified as 4. 1.1.3 For the recommended compact specimen [C(T)] the 3.2.2 effective yield strength, ay [^^~^]—an assumed initial normalized crack size is 0.45 & aJW ^ 0.55. The value of uniaxial yield strength that represents the influence half-height-to-width ratio (H/W) equals 0.6 and the width to of plastic yielding upon fracture test parameters. thickness ratio is within the range 2 ^ W/B S 4. Discussion—The calculation of ay is the average of the 0.2 % offset 1.2 This standard does not purport to address all of the yield strength (oyg), and the ultimate tensile strength (a-j-s), that is (ff^s + safely problems, if any, associated with its use. It is the aTs)/2. Both ays and ay^ are determined in accordance with Test responsibility of the user of this standard to establish appro- Methods E 8. priate safety and health practices and determine the applica- 3.2.3 original crack size, a„ [L]—see Terminology E 616. bility of regulatory limitations prior to use. 3.2.4 original uncracked ligament, b^ [L]—the distance from the original crack front to the back surface of the specimen at the start of testing, bg= W - a„. 2. Referenced Documents 3.2.5 physical crack extension, M,, [L]—an increase in 2.1 ASTM Standards: physical crack size, Mp = cip- a„. E 4 Practices for Force Verification of Testing Machines^ 3.2.6 physical crack size, ap [L]—see Terminology E 616. E 8 Test Methods for Tension Testing of Metallic MateDiscussion—In CTOD testing, a^ = a„ + Aa^. rials^ 3.2.7 pop-in—a discontinuity in the load versus clip gage E 399 Test Method for Plane-Strain Fracture Toughness displacement record. The record of a pop-in shows a sudden of Metallic Materials-^ increase in displacement and, generally, a decrease in load. E 616 Terminology Relating to Fracture Testing-^ Subsequently, the displacement and load increase to above their respective values at pop-in. 3.2.8 slow stable crack extension [L]—a displacement ' This test method is under the jurisdiction of ASTM Committee E-8 on Fatigue and Fracture and is the direct responsibility of Subcommittee E08.08 controlled crack extension beyond the stretch zone width on Elastic-Plastic Fracture Mechanics Technology. (see 3.2.12). The extension stops when the applied displaceCurrent edition approved March 15, 1993. Published May 1993. Originally ment is held constant. published as E 1290 - 89. Last previous edition E 1290 - 89«i. 2 Annual Boole of ASTM Standards, Vol 03.01. 3.2.9 specimen span, S [L]—the distance between spec91 Copyright
1996 b y A S T M International
www.astm.org
E1290
Load P
Uv "
Uv W
P
P
••- V
-" P
Clip gage displacement, v
NOTE 1—Construction lines drawn parallel to the elastic loading slope to give Vp, the plastic component of total displacement, v^. NOTE 2—In curves b and d, the behavior after pop-in is a function of machine/specimen compliance, instrument response, etc. FIG. 1 Types of Load Versus Clip Gage Displacement Records
imen supports in a bend specimen. 3.2.10 specimen thickness, B[L]—see Terminology E 616. 3.2.11 specimen width, W [L]—see Terminology E 616. 3.2.12 stretch zone width, SZW [L]—the length of crack extension that occurs during crack-tip blunting, for example, prior to the onset of unstable brittle crack extension, pop-in, or slow stable crack extension. The SZW is in the same plane as the original (unloaded) fatigue precrack and refers to an extension beyond the original crack size. 3.2.13 unstable brittle crack extension [L]—an abrupt crack extension that occurs with or without prior stable crack extension in a standard test specimen under crosshead or clip gage displacement control. 4. Summary of Test Method 4.1 The objective of the test is to determine the value of CTOD at one or more of several crack extension events. The values of CTOD may correspond to: 5,., the onset of unstable brittle crack extension with no significant prior slow stable crack extension (see 3.2.1); 5,„ the onset of unstable brittle crack extension following prior slow stable crack extension; h,„, at the first attainment of a maximum load plateau for fully plastic behavior. 4.2 The test method involves crosshead or clip gage displacement controlled three-point bend loading or pin loading of fatigue precracked specimens. Load versus clip gage crack opening displacement is recorded, for example, Fig. 1. The loads and displacements corresponding to the specific events in the crack initiation and extension process are used to determine the corresponding CTOD values. For values of 5„ 5„ and 5,„, the corresponding load and clip gage displacements are obtained directly from the test records. 4.3 The rectangular section bend specimen and the com92
pact specimen are intended to maximize constraint and these are generally recommended for those through-thickness crack types and orientations for which such geometries are feasible. For the evaluation of surface cracks in structural applications for example, orientations T-S or L-S (Terminology E 616), the square section bend specimen is recommended. Also for certain situations in curved geometry source material or welded joints, the square section bend specimen may be preferred. Square section bend specimens may be necessary in order to sample an acceptable volume of a discrete microstructure. 5. Significance and Use 5.1 The CTOD values determined by this test method may be used to characterize the toughness of materials that: (a) are too ductile or lack sufficient size to be tested for K,^. in accordance with the requirements of Test Method E 399, or (b) show a propensity for unstable crack extension that would invalidate tests in accordance with the requirements ofTest Method E 813. 5.2 The different values of CTOD determined by this test method characterize the resistance of a material to crack initiation and early crack extension at a given temperature. 5.3 The values of CTOD may be affected by specimen dimensions. It has been shown that values of CTOD determined on SE(B) specimens using the square section geometiy may not be the same as those using the rectangular section geometry, and may differ from those obtained with C(T) specimens (see 4.3). 5.4 The values of CTOD determined by this test method may serve the following purposes: 5.4.1 In research and development, CTOD testing can show the effects of certain parameters on the fracture
Q) E 1290 from steels of sufficient strength and hardness (greater than 40 HRC) to elastically resist indentation loads. The critical tolerances and suggested proportions of the clevis and pins are given in Fig. 3. These proportions are based on specimens having W/B = 2 for 5 > 12.7 mm (0.5 in.) and W/B = 4 for J5 g 12.7 mm (0.5 in.). If a 1930 MPa (280 000 psi) yield strength maraging steel is used for the clevis and pins, adequate strength will be obtained. If lower strength grip material is used, or if substantially larger specimens are required at a given ays/^ ratio, then heavier grips will be required. As indicated in Fig. 3, the clevis corners may be cut 6. Apparatus off sufficiently to accommodate seating of the clip gage in 6.1 This procedure involves measurement of applied load, specimens less than 9.5 mm (0.375 in.) thick. Attention P, and clip gage crack opening displacement, v. Load versus should be given to achieving good alignment through careful displacement is autographically recorded on an x-y plotter machining of all auxiliary gripping fixtures. for visual display, or converted to digital form for accumula6.4 Displacement Measuring Devices: tion in a computer information storage facility and subse6.4.1 Displacement measuring gages are used to measure quent processing. Testing is performed under crosshead or opening displacements on SE(B) specimens at either knife clip gage displacement control in a compression or tension edges a distance z beyond the crack mouth. Fig. 4a, or at the testing machine, or both, that conforms to the requirements crack mouth (z = 0) in the case of integral knife edges. Fig. of Practices E 4. 4b. For C(T) specimens, where the opening displacement is 6.2 Fixturingfor Three-Point Bend Specimens—A recom- not measured on the load line, the difference between the mended SE{B) specimen fixture is shown in Fig. 2. Friction load line and the displacement measuring point shall constieffects between the support rollers and specimen are reduced tute the dimension z (see 9.2). Alternatively, when the by allowing the rollers to rotate during the test. The use of opening displacements on C(T) specimens are made on or high hardness steel of the order of 40 HRC or more is within ±0.002 ff of the load line, it may be assumed that z = recommended for the fixture and rollers to prevent indenta0. tion of the platen surfaces. 6.4.2 The clip gage recommended in Test Method E 399 6.3 Tension Testing Clevis—A loading clevis suitable for may be used in cases where the total expected displacement testing C(T) specimens is shown in Fig. 3. Each leg of the is 2.5 mm (0.1 in.) or less. Sensitivity and linearity requirespecimen is held by such a clevis and loaded through pins, in ments specified in Test Method E 399, shall be met over the order to allow rotation of the specimen during testing. To full working range of the gage. In addition, the gage is to be provide rolling contact between the loading pins and the calibrated to within ± 1 % of the working range. clevis holes, these holes are produced with small flats on the 6.4.3 For cases where a linear working range of up to 8 loading surfaces. Other clevis designs may be used if it can be mm (0.3 in.) or more is needed, an enlarged gage such as that demonstrated that they will accomplish the same resuU as shown in Fig. 5 can be used. Both linearity and accuracy of the design shown. Clevises and pins should be fabricated
toughness of metallic materials significant to service performance. These parameters include material composition, thermo-mechanical processing, welding, and thermal stress relief. 5.4.2 For specifications of acceptance and manufacturing quality control of base materials, weld metals, and weld heat affected zones. 5.4.3 For inspection and flaw assessment criteria, when used in conjunction with fracture mechanics analyses.
TEST SPECIMEN
RAM
-B
.6 PIN DIA
k l . l P I N D I A . DISPLACEMEIMTX ' 63/ GAGE TEST FIXTURE
B63 H-/
W(min)
BOSSES FOR SPRINGS OR RUBBER BANDS -
S
A>
>
0
a
1'
t
p!L4
/—>» ^ B - » IJ=W*.010H
NOTE 1—fi. surfaces shall be perpendicular and parallel as applicable within 0.001 W TIR. NOTE 2—Crack starter notch shall be perpendicular to specimen surfaces to within ±2°. NOTE 3—Integral or attachable knife edges for clip gage attachment may be used (see Fig. 4). NOTE 4—For starter notch and fatigue crack configurations see Fig. 8. FIG.
7
C(T) Specimen for pin of 0.241V (+0.000 W/-0.0051V) diameter
Proportional Dimensions and Tolerances for Square Section SE(B) Specimens 1.25W + 0.010W-
B = o.sw
W ± 0.005W-
r'T
0.37SW 2H = 1.2W ± 0.010W
ENVELOPE
I
MACHINED SLOT
FIG.
— ao
MACHINED SLOT
\
/ UNACCEPTABLE NOTCH •
. »0 -
0.1W-
-
^
\
•FATIGUE CRACK
NOTE 1 —W must not exceed W/16. NOTE 2—The intersection of the crack starter surfaces with the two specimen faces shall be equidistant from the top and bottom edges of the specimen within 0.005 W. FIG.
8
/
f f 0.21W (max)
9
Alternative C(T) Specimen Designs
8. Procedure 8.1 The objective of the procedure described herein is to identify the critical CTOD values that can be used as measures of the fracture toughness of materials. These values are derived from measurements of load and clip gage displacement, as described in Section 9. 8.2 After completion of the test, proceed as follows: 8.2.1 Heat tint or fatigue crack the specimen to mark the amount of slow stable crack extension. If fatigue crack marking is used, this should be done using a maximum cyclic load less than the previously applied monotonic load with the minimum cyclic load equal to 70 % of the maximum cyclic load. The maximum cyclic load should be of sufficient magnitude to prevent damage to the fracture surfaces by crack closure. 8.2.2 Break the specimen open to expose the crack, taking care to minimize additional deformation. Cooling ferritic steels enough to ensure brittle behavior may be helpful. 8.2.3 Measure the original crack length, fl„, and physical crack length after slow stable crack extension, Up, in accordance with 8.9.4. 8.3 Testing Rate—Load the specimen such that the rate of increase of stress intensity factor to the load Pj is within the range from 0.55 to 2.75 MPa m''Vs (30 000 to 150 000 psi in.'^^'/min). Carry out the test under either crosshead or clip gage displacement control (see 6.1 and 10.1.4). 8.4 Specimen Test Temperature—Control the specimen test temperature to an accuracy of ±2°C (±3°F). It is recommended that tests be made in situ in suitable low or high temperature media, as appropriate. In a liquid medium, hold the specimen at least 30 s/mm (12 min/in.) after the
ACCEPTABLE NOTCH
0.1W-
U- O.IW
C(T) Specimen for pin of 0.1875W (+0.000W/-0.001 IV) diameter
FATIGUE CRACK
•Bo -
SEE FIG.e.
^^
Envelope of Crack-Starter Notches
are used to simulate a specific structural application of interest. 7.3.4 To promote early fatigue crack initiation, and promote planar crack growth, a notch tip radius of 0.08 mm (0.003 in.) or less should be used. Additionally, there may be an advantage in using a Chevron notch (see appropriate figure in Test Method E 399), or by statically preloading the specimen. In the latter case, the specimen is loaded in such a way that the straight-through notch tip is compressed in a direction normal to the intended crack plane, but without allowing the applied load to exceed Pf. 7.3.5 The fatigue crack shall fall within the limiting envelope as shown in Fig. 8. 96
Q) E1290 specimen surface has reached the test temperature and prior to testing. When using a gaseous medium, use a soaking time significantly longer than 30 s/mm (12 min/in.) of thickness. The determination of an appropriate soaking time in a gaseous medium shall be the responsibility of those conducting the test. 8.5 SEiB) Testing—InstaW the bend fixture so that the line of action of the applied load passes mid-way between the support roller centers within 0.5 % of the distance between these centers. Position the specimens with the notch centerline mid-way between the rollers to within 0.5 % of the span, and position square to the roller axes within 2°. 8.6 CiT) Testing—To minimize errors from loading pin friction and eccentricity of loading from misalignment, the axes of the loading rods should be kept coincident within 0.8 mm (0.03 in.) during the test. Center the specimen with respect to the clevis opening within 0.8 mm (0.03 in.). 8.7 Clip Gage Seating—Seat the displacement gage in the knife or razor edges firmly, by lightly rocking the gage. 8.8 Recording: 8.8.1 The test records shall consist of autographic plots or digital records, or both, of the output of the load sensing device versus the output from the clip gage. 8.8.2 Test Record—The linear elastic portion of the load versus deflection test record shall exhibit a slope between 0.7 and 1.5. Maximum load can be estimated from 2.5 Pf, where Py is as specified for SE(B) and C(T) specimens in 7.3.1. 8.9 Measurements—All specimen dimensions shall be within the tolerances shown in Figs. 6, 7, and 9. 8.9.1 Thickness—Measure the specimen thickness, B, before testing, accurate to the nearest 0.05 mm (0.002 in.) or 0.5 %B, whichever is larger, at three locations along the uncracked ligament of the specimen. Record the average B. 8.9.2 SE{B) Specimen Width—Prior to testing, measure the width, W, adjacent to the notch on both sides accurate to the nearest 0.05 mm (0.002 in.) or 0.1 %W, whichever is larger. Record average W. 8.9.3 C{T) Specimen Width—Prior to testing, measure the width, W, from the load line to the back edge of the specimen on both sides of the notch, accurate to the nearest 0.05 mm (0.002 in.) or 0.1 %W, whichever is larger. Record average W. 8.9.4 Crack Length—After completion of the test (and, if necessary, breaking open the specimen after heating tinting or fatigue cracking in accordance with 8.2), examine the fracture surface. Along the front of the fatigue crack, and along the front of any slow stable crack extension, including the SZW, measure the crack length at nine equally spaced points across the specimen thickness, centered about the specimen centerline and extending to 0.005 B^ from the specimen surfaces. Calculate the original (fatigue) crack length, a,„ and the final physical crack length, Op (which includes the tear length and SZW), as follows: average the two near-surface measurements, add this result to the remaining seven crack length measurements, and average this total length by dividing by eight (see 9.4 for crack geometry validity criteria). The individual crack length measurements should be accurate to within the nearest 0.03 mm (0.001 in.). 97
9. Analysis of Experimental Data 9.1 Assessment of Load/Clip Gage Displacement Records—The applied load-displacement record obtained from a fracture test on a notched specimen will usually be one of the five types shown in Fig. 1. 9.1.1 In the case of a smooth continuous record in which the applied load rises with increasing displacement up to the onset of unstable brittle crack extension or pop-in, and where no significant slow stable crack growth has occurred (see 3.2 and Figs, la and lb), the critical CTOD, 5,. shall be determined from the load and plastic component of clip gage displacement, v^, corresponding to the points P^ and v,.. If failure occurs close to the linear range, apply the procedure of Test Method E 399 to test whether a valid K,,. measurement can be made. 9.1.2 In the event that significant slow stable crack extension (see 3.2) precedes either unstable brittle crack extension or pop-in, or a maximum load plateau occurs, the load-displacement curves will be of the types shown in Figs. Ic, Id, and le, respectively. Thesefiguresillustrate the values of V and P to be used in the calculation of 5„ or 5,„, whichever is appropriate. 9.1.3 If the pop-in is attributed to an arrested unstable brittle crack extension in the plane of the fatigue precrack, the result must be considered as a characteristic of the material tested. NOTE 1—Splits and delaminations can result in pop-ins with no arrested brittle crack extension in the plane of the fatigue precrack.
For this method, such pop-in crack extension can be assessed by a specific change in compliance, and also a post-test examination of the specimen fracture surfaces. When the post-test examination shows that the maximum pop-in crack extension has exceeded 0.04 bg, calculate values of 5^. or 5„ corresponding to the loads P^ or P,, and displacements of v,. or v,„ respectively (for example, point B in Fig. 10a), in accordance with 9.2. When the post-test examination of the fracture surface shows no clear evidence that the maximum pop-in crack extension has exceeded 0.04 b,„ the following procedure may be used to assess the significance of small pop-ins (see 3.2 and Figs, lb and Id). Referring to Fig. 10: 9.1.3.1 Draw the tangent OA and a parallel line EC through the maximum load point associated with the particular pop-in under consideration. 9.1.3.2 Draw the line BD parallel to the load axis. 9.1.3.3 Mark the point E at 0.95BD. 9.1.3.4 Draw the line CEF. 9.1.3.5 Mark the point G corresponding to the load and displacement at pop-in crack arrest. 9.1.3.6 When the point G is outside the angle BCF, calculate values of 8^ or 5„ corresponding to the loads P^. or P,i and displacements v^ or v„, respectively (for example, point B in Fig. 10a), in accordance with 9.2. 9.1.3.7 When the point G is within the angle BCF, the pop-in may be ignored (Fig. 10b). NOTE 2—Although an individual pop-in may be ignored on the basis of these criteria, this does not necessarily mean that the lower bound of fracture toughness has been measured. For instance, in an inhomogeneous material such as a weld, a small pop-in may be recorded because of fortuitous positioning of the fatigue precrack tip. Thus, a
#
/
3 /
E 1290 where: K^ YP/[BlV'%and Y is determined as follows: (a) SE(B) Specimen having S = 4W: 6(fl„/ W)'" (1.99- aj W[ 1 - aj W] • [2.15 - 3.93a,./ W + 2.7(a„/ HQ^]) (1 +2aJ\V)(\ -aJW)^'^ (b) C(T) Specimen: (2 + a„/HO(0.886 + AMaJW- I3.32(a„/H0+ 14.72(a„/HO^-5.6(a„/HO'')
^
P. or P„ 0.95BD
Load, P
Previously Ignored pop-In
/ -^//\ /
/
\ \
)
Pop-In thot may NOT be Ignored (See 9.1.3)
{\-aJW)"Values of Y for the SE(B) and C(T) specimens are summarized in Tables 1 and 2, respectively. P = load corresponding to P,., P„ or P,„. See Fig. 1, V = Poisson's ratio, oy^ = yield or 0.2 % offset yield strength at the temperature of interest, E = Young's modulus at the temperature of interest, V,, = plastic component of clip gage opening displacement corresponding to v^ v„ or v„. See Fig. 1, z - distance of knife edge measurement point from front face (notched surface) on SE(B) specimen, or from load line in C(T) specimen (see 6.4.1), and r,, = plastic rotation factor = 0.4(1 -f- a). (c) for SE(B) specimen: a = 0.1, and
(a) C D Clip Gage Displacement, v
rp = 0.44. 0.95BD
(d) for C(T) specimens: a = l^[{ajb,f + ajb„ + 1/2] 2(ajb„ + '/2) Load, and P f^ = 0.47 for 0.45 ^aJWi 0.50, or rp = 0.46 for 0.50 < aJWi 0.55 9.3 Discontinued Test—If the test is terminated by some fault in the testing system, or the load-displacement recording exceeds the range of the clip gage or recording chart, report 5 as being greater than that concomitant with the last C D load recorded. In the latter case, report the maximum load as Clip Gage Displacement, v greater than the load recorded at chart run-out. 9.4 Qualifying CTOD Values: NOTE—Slope of line OF is exaggerated for clarity. 9.4.1 The critical CTOD values, for example, 5,. and 5,„ FIG. 10 Significance of Pop-In are valid if: 9.4.1.1 These values of CTOD are equal to or less than the slightly different fatigue precrack position may give a larger pop-in, measurement capacity of the specimen, which corresponds which could not be ignored. In such circumstances the specimens should to 8„. be sectioned after testing, and examined metallographically to ensure 9.4.1.2 The difference between the maximum and minthat the crack tips have sampled the weld or base metal region of interest imum of all 9 crack length measurements of the fatigue crack (see Ref. (1)).^ does not exceed 0.10 the original (fatigue) crack length a