BEYOND SIGNIFICANCE TESTING R E F O R M I N G DATA A N A L Y S I S M E T H O D S IN B E H A V I O R A L
RESEARCH
REX B. K L I N E American Psychological Association • Washington, DC
Copyright © 2004 by the American Psychological Association. All rights reserved. Except as permitted under the United States Copyright Act of 1976, no part of this publication may be reproduced or distributed in any form or by any means, or stored in a database or retrieval system, without the prior written permission of the publisher. Published by American Psychological Association 750 First Street, NE Washington, DC 20002 www.apa.org To order APA Order Department P.O. Box 92984 Washington, DC 20090-2984 Tel: (800) 374-2721 Direct: (202) 336-5510 Fax: (202) 336-5502 TDD/TTY: (202) 336-6123 Online: www.apa.org/books/ E-mail:
[email protected] In the U.K., Europe, Africa, and the Middle East, copies may be ordered from American Psychological Association 3 Henrietta Street Covent Garden, London WC2E 8LU England
Typeset in Goudy by World Composition Services, Inc., Sterling, VA Printer: Edwards Brothers, Ann Arbor, MI Cover Designer: Naylor Design, Washington, DC Project Manager: Debbie Hardin, Carlsbad, CA The opinions and statements published are the responsibility of the authors, and such opinions and statements do not necessarily represent the policies of the American Psychological Association. Library of Congress Cataloging-in-Publication Data Kline, Rex B. Beyond significance testing: reforming data analysis methods in behavioral research/by Rex B. Kline.—1st ed. p. cm. Includes bibliographical references and index. ISBN 1-59147-118-4 (alk. paper) 1. Psychometrics—Textbooks. I. Title. BF39.K59 2004 150'.72'4—dc22 British Library Cataloguing-in-Publication Data A CIP record is available from the British Library. Printed in the United States of America First Edition
2003022594
For my family, Joanna, Julia Anne, and Luke Christopher, bright angels all.
It's late. Time to make up your mind. Which will it be? The reality of dreams or the dream of reality? —Alfred Bester
CONTENTS
Preface
I.
yd
Introductory Concepts
1
Chapter 1.
Changing Times
Chapter 2.
Fundamental Concepts
19
Chapter 3.
What's Wrong With Statistical Tests— And Where We Go From Here
61
II.
Effect Size Estimation in Comparative Studies
3
93
Chapter 4.
Parametric Effect Size Indexes
Chapter 5.
Nonparametric Effect Size Indexes
143
Chapter 6.
Effect Size Estimation in One-Way Designs
163
Chapter 7.
Effect Size Estimation in Multifactor Designs
203
III.
Alternatives to Statistical Tests
95
245
Chapter 8.
Replication and Meta-Analysis
247
Chapter 9.
Resampling and Bayesian Estimation
273
References
295
Index
313
About the Author
325
PREFACE
The goals of this book are to (a) review the now-large literature across many different disciplines about shortcomings of statistical tests; (b) explain why these criticisms have sufficient merit to justify change in data-analysis practices; (c) help readers acquire new skills concerning effect size estimation and interval estimation for effect sizes; and (d) review additional alternatives to statistical tests, including bootstrapping and Bayesian statistics. This book is a follow-up to the report of Leland Wilkinson and the Task Force on Statistical Inference (TFSI; 1999) of the American Psychological Association (APA) and the fifth edition of the Publication Manual of the American Psychological Association (APA, 2001). Both the report of the TFSI and the most recent Publication Manual call for changes in the way data are analyzed for psychology research journals, including rhe reporting of effect sizes and confidence intervals for primary results. The reporting of effect sizes is now also required by increasing numbers of research journals in psychology and other disciplines. In addition, the reforms mentioned imply a reduced role for traditional statistical tests, which reflects decades of increasing criticism of the use of statistical tests in the behavioral and other sciences. An additional goal is related to the criticism that the most recent Publication Manual calls for change in data analysis practices but does not give examples. Numerous examples with actual research results are presented throughout this volume. This book is written for researchers and students in psychology and related areas who may not have strong quantitative backgrounds. It assumes that the reader has had at least one undergraduate-level course in behavioral science statistics. Each substantive chapter begins with a review of fundamental statistical issues but does not get into the minutia of statistical theory.
Works that do so are cited in the text, and such works can be consulted for more information. This book is suitable as a textbook for an introductory course in behavioral science statistics at the graduate level. It can also be used in a senior undergraduate-level course that considers modern methods of data analysis. Coverage of some of the more advanced topics in this book, such as noncentrality interval estimation and effect size estimation for random factors, could be skipped in such a class. Especially useful for all readers is chapter 3, which considers common misinterpretations of the results of statistical tests. These misinterpretations are widespread among students and researchers alike, and such false beliefs may have hindered the development of psychology and related areas as cumulative sciences. It was a pleasure to work with the development and production staff at the APA. Their work is first-rate. The two anonymous reviews of an earlier version of this work were extraordinarily helpful. This kind of feedback is invaluable to an author, and any remaining shortcomings in the book reflect my own limitations. Special thanks to Debbie Hardin, the project manager for this book, who did a super job of dealing with the original (and technically complicated) manuscript. Finally, I greatly appreciate the support of my wife while working on this project and the delightful company of our two wonderful children, to whom this book is dedicated.
xii
PREFACE
I INTRODUCTORY CONCEPTS
1 CHANGING TIMES
Somehow the wondrous promise of the earth is that there are things beautiful in it, things wondrous and alluring, and by virtue of your trade you want to understand them. —Mitchell Feigenbaum, Chaos theorist (quoted in Gleick, 1988, p. 187)
This book has a home page on the Internet; its address is http://www.apa.org/books/resources/kline From the home page, readers can find supplemental readings about advanced topics, exercises with answers, resources for instructors and students, and links to related Web sites. Readers can also download data files for some of the research examples discussed later. In 1996, the Board of Scientific Affairs of the American Psychological Association (APA) convened the Task Force on Statistical Inference (TFSI). The TFSI was asked to respond to the long-standing controversy about statistical significance tests and elucidate alternative methods (Wilkinson & TFSI, 1999). Some hoped that the TFSI would recommend a ban on statistical tests in psychology journals. Such a ban was also discussed in recent special sections or issues of Psychological Science (Harris, 1997a), Research in the Schools (McLean & Kaufman, 1998), and an edited book by Harlow, Mulaik, and Steiger (1997), the title of which asks the question, "What if there were no significance tests?" Problems with and alternatives to statistical tests were also discussed in a special issue of the journal of Experimental Education (B. Thompson, 1993a). Serious discussion of such a ban reflects the culmination of many years of disenchantment with statistical tests. In fact, this controversy has escalated decade by decade and has crossed various disciplines as diverse as psychology and wildlife sciences (e.g., D. Anderson, Burnham, & W. Thompson, 2000).
Talk of a ban on statistical tests would probably come as a surprise to a casual observer, to whom it would be plain that results of statistical tests are reported in most empirical articles published in psychology and related disciplines in the past 50 years (Hubbard & Ryan, 2000). The same observer stepping into almost any university classroom for courses in behavioral science statistics at either the undergraduate or graduate level would find that these tests have been the main subject matter for the past 20 years or more (Aiken, West, Sechrest, & Reno, 1990; Frederich, Buday, & Kerr, 2000). Nevertheless, by the late 1990s the number of voices in the behavioral sciences decrying the limitations of statistical tests started to reach a critical mass. This was apparent in the formation of the TFSI by the APA to look at this controversy. It is also obvious in the fact that about two dozen research journals in psychology, education, counseling, and other areas now require the reporting of effect sizes in submitted manuscripts (Fidler & B. Thompson, 2001 ).1 Two of these are flagship journals of associations (American Counseling Association, Council for Exceptional Children), each with more than 50,000 members. One of the most recent APA journals to make this requirement is the Journal of Educational Psychology. The requirement to report effect sizes sends a powerful message to potential contributors to these journals that use of statistical tests alone is insufficient, and the number of journals making it is bound to increase. Editorial policies in prominent journals can be an important bellwether for reform (Sedlmeier & Gigerenzer, 1989; Vacha-Haase, 2001). Indeed, Kaufman (1998) noted that the controversy over the use of statistical tests is the major methodological issue of our generation. So perhaps a casual observer might sense that change is coming after all. GOALS AND PLAN OF THE BOOK This book aims to help readers stay abreast of ongoing changes in the ways we analyze our data and report our findings in the behavioral sciences. These readers may be educators, applied researchers, reviewers of manuscripts for journals, or undergraduate or graduate students in psychology or related disciplines. It is assumed that many readers (like the author) were trained in traditional methods of data analysis—that is, the use of statistical tests as the primary (if not only) way to evaluate hypotheses. Readers who are currently students are perhaps at some advantage because their views and skills may not yet be so narrow. However, even very experienced researchers 1
B. Thompson keeps a list of journals that require the reporting of effect sizes at http://www.coe .tamu.edu/~bthompson/journals.htm
CHANGING TIMES
who have published many articles may have wondered whether there are not better ways to evaluate research hypotheses, or whether it is actually necessary to include results of statistical tests in articles (e.g., Kaufman, 1998). Readers already convinced of the limitations of statistical tests should find in this book useful arguments to reinforce their viewpoint. Readers not sharing this view will, it is hoped, find some interesting ideas to ponder. This book does not debate whether we in the psychological community should change the way we use statistical tests. Tryon (2001) and others have noted that more than 50 years of trying to remediate misuses of statistical tests by discussing their technical merits has not been productive. This book assumes instead that developments in the field already point toward a diminishing role for statistical tests. As a consequence, the goals of this book are to help readers understand (a) the controversy about and limitations of statistical tests, (b) strengths and weakness of some proposed alternatives to statistical tests, and (c) other methods related to a reduced role for statistical tests, such as meta-analysis. Of primary importance for the second and third points is effect size estimation which, as mentioned, is now required by many journals. The estimation of average effect size across a set of studies in the same general area is also a key part of most metaanalyses. Another major focus of this book involves interval estimation, especially the construction of confidence intervals based on observed effect sizes. Part I of the book is concerned with fundamental concepts and summarizes the debate about statistical tests. Chapter 2 reviews principles of sampling and estimation that underlie confidence intervals and statistical tests. Chapter 3 outlines arguments against the continued use of statistical tests as our primary means to evaluate hypotheses. This discussion assumes that although there is nothing inherently wrong with statistical tests, what they actually do makes them unsuitable for perhaps most types of behavioral research. It is also argued that research progress in psychology has been hindered by our preoccupation with statistical tests. Part II comprises four chapters that emphasize effect size estimation in comparative studies that compare at least two different groups or conditions. Chapter 4 reviews the general rationale of effect size estimation and introduces basic parametric effect size indexes for continuous outcome variables, including standardized mean differences and measures of association. Also considered is the comparison of groups at the case level with relatively simple statistics based on proportions of scores above or below certain reference points. The critical problem of evaluating substantive (theoretical, clinical, or practical) significance versus statistical significance is also discussed. Chapter 5 introduces nonparametric effect size indexes for comparing groups on categorical outcomes, such as relapsed versus not relapsed. Chapters 6 and 7 concern effect size estimation in one-way designs with at
INTRODUCTORY CONCEPTS
least three conditions and factorial designs with two or more independent variables. Many empirical examples are presented in chapters 4 to 7. Presentations about effect size estimation are often chock full of equations. This is because many effect size indexes can be computed in more than one way, such as from group descriptive statistics or test statistics. To reduce the overall number, only the most essential equations are given in chapters 4 to 7. Some of these equations are for primary researchers who have access to the original data, but others are also handy in secondary analyses based on summary statistics often reported in printed or on-line documents. Information about additional ways to compute effect size indexes is available in technical books about meta-analysis, such as Cooper and Hedges (1994b). Part III includes two chapters that cover topics related to reform of methods of data analysis in the social sciences. Chapter 8 deals with principles of replication and meta-analysis. The latter has become an increasingly important tool in both the social and health sciences for synthesizing results across a research literature. Its emphasis on effect sizes in primary studies instead of results of statistical tests avoids some of the limitations of the latter. Researchers working in areas with sufficient numbers of studies for meta-analysis thus need to understand its potential strengths and limitations. Chapter 9 surveys two other alternatives to traditional statistical tests that are often overlooked in psychology, statistical resampling—which includes the method of bootstrapping—and Bayesian estimation.
RETROSPECTIVE Comprehensive historical accounts of the long-standing controversy about statistical significance tests can be found in Gigerenzer (1993), Huberty and Pike (1999), and Oakes (1986). Hybrid Logic of Statistical Tests (1920-1960) The basic logical elements of what is today often referred to as null hypothesis significance testing (NHST) were present in scientific papers as early as the 1700s (Stigler, 1986). These elements were not formally organized into a systematic method until the early 1900s, however. The method of NHST in its contemporary form is actually a hybrid of two different schools of thought, one from the 1920s associated with R. Fisher (e.g., 1925) and another from the 1930s called the Neyman—Pearson approach, after Neyman and E. S. Pearson (e.g., Neyman & E. S. Pearson, 1933). Other individuals contributed to these schools, such as K. Pearson and CHANGING TIMES
A. Wald (Hogben, 1957), but the work of the three principals listed first forms the genesis of NHST. The Neyman—Pearson model is an extension of the Fisher model. Fisher's approach featured only a null hypothesis and subsequent estimation of the conditional probability of the data under it with statistical tests. The probabilities generated by statistical tests are commonly called p values. There was no alternative hypothesis in Fisher's model. The conventional levels of statistical significance used today, .05 and .01, are generally attributed to Fisher, but he apparently did not advocate that these values be applied across all studies (Cowles & Davis, 1982). Anyhow, for its focus on p values under the null hypothesis, Fisher's model has been called the p-value approach (Huberty, 1993). The addition of the alternative hypothesis to the basic Fisher model, the attendant specification of one- or two-tailed regions of rejection, and the application of fixed levels of a across all studies characterize the NeymanPearson model. The last characteristic listed is perhaps the main source of the rigid application of the .05 or .01 levels of statistical significance that is today's practice. For the same reason, the Neyman-Pearson model has been described as the fixed-/) approach (Huberty, 1993). The Neyman— Pearson model also brought with it the conceptual framework of power and associated decision errors, Type I and Type II. A modern power analysis is in spirit and fact based on the Neyman-Pearson model, not the Fisher model. To say that advocates of the Fisher model and the Neyman—Pearson model exchanged few kind words about each other's approach is an understatement. Their long-running debate was acrimonious. Nevertheless, the integration of the two models by statisticians and authors other than Fisher, Neyman, and E. S. Pearson into what makes up contemporary NHST took place roughly between 1935 and 1950 (Huberty, 1993). Gigerenzer (1993) referred to this integrated model as the hybrid logic of scientific inference, and P. Dixon and O'Reilly (1999) called it the "Intro Stats" method because this is the approach outlined in virtually all contemporary textbooks for introductory statistics in the behavioral sciences. Many authors have noted that (a) the hybrid logic that underlies modern NHST would have been rejected by Fisher, Neyman, and E. S. Pearson, although for different reasons; and (b) its composite nature may be a source of confusion about what results from statistical tests really mean. Institutionalization of the "Intro Stats" Method (1940-1960) Before 1940, statistical tests were used in relatively few published articles in psychology. Authors of works from this time instead used in nonstandard ways a variety of descriptive statistics or rudimentary test statistics. However, from roughly 1940 to 1960 during what Gigerenzer and
INTRODUCTORY CONCEPTS
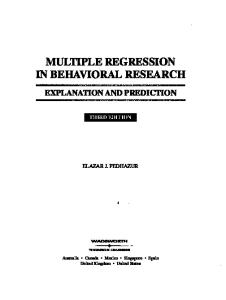
D. Murray (1987) called the inference revolution in psychology, the Intro Stats method was widely adopted in textbooks, university curricula, and journal editorial practice as the method to test hypotheses. Gigerenzer (1993) identified two factors that contributed to this shift. One is the move in psychology away from the study of single cases, such as in operant conditioning studies of individual animals, to the study of groups. This change occurred roughly from 1920 to 1950. Another is what Gigerenzer (1993) and others called the probabilistic revolution in science, which introduced indeterminism as a major theoretical concept in areas such as quantum mechanics and genetics to better understand the subject matter. In psychology, though, it was used to mechanize the inference process through NHST, a critical difference, as it turns out. After the widespread adoption of the Intro Stats method, there was a dramatic increase in the reporting of statistical tests in journal articles in psychology and related fields. This trend is obvious in Figure 1.1, reproduced from Hubbard and Ryan. These authors sampled about 8,000 articles published between 1911 and 1998 in randomly selected issues of 12 different APA journals. Summarized in the figure are the percentages of articles in which statistical tests were used in the data analysis. This percentage is about 17% from 1911 to 1929. It increases to around 50% in 1940, continues to rise to about 85% by 1960, and exceeds 90% since the 1970s. The time period of the most rapid increase in use of NHST, about 1940 to 1960, corresponds to the inference revolution in psychology. Some advantages to the institutionalization of NHST were noted by Gigerenzer (1993). The behavioral sciences grew rapidly after 1945, and its administration was made easier by the near-universal use of statistical tests. For example, journal editors could use NHST outcomes to decide which studies to publish or reject, respectively, those with or without statistically significant results, among other considerations. The method of NHST is mechanically applied, and thus seemed to remove subjective judgment from the inference process. That this objectivity is more apparent than real is another matter (more about this point later). The method of NHST also gave behavioral researchers a common language and perhaps identity as members of the same grand research enterprise. It also distinguished them from their counterparts in the natural sciences, who may use statistical tests to detect outliers but not typically to test hypotheses (Gigerenzer, 1993). The elevation of any method to dogma has potential costs, some of which are considered next. Increasing Criticism of Statistical Tests (1940-Present) There has been controversy about statistical tests for more than 70 years, or as long as they have been around (Kirk, 1996). Some examples of CHANGING TIMES
100
m so
r
70
value from the output of a computer program, such as p - .012. Other recommendations about the statistical analyses (pp. 21-26) include the following: 1. Report adequate descriptive statistics, such as means, variances, and sizes of each group and a pooled within-groups variance-covariance in a comparative study or a correlation matrix in a regression analysis. This information is necessary for later meta-analyses or secondary analyses by other researchers.
INTRODUCTORY CONCEPTS
13
2. Effect sizes should "almost always" be reported (p. 25). Several examples of effect size indexes are listed, many of which are discussed later in this book and by Kirk (1996) and Borenstein (1998), among others. The absence of effect sizes is also cited as an example of a study defect (p. 5). However, authors are still not required to report them. 3. The use of confidence intervals is "strongly recommended," but not required (p. 22). Predictably, not everyone is happy with the report of the TFSI or the fifth edition of the Publication Manual. For example, B. Thompson (1999) noted that only encouraging the reporting of effect sizes or confidence intervals presents a self-canceling mixed message. Sohn (2000) lamented the lack of clear guidelines in the report of the TFSI for changing data analysis practices that may improve the relevance of psychology research. Finch et al. (2001) welcomed the TFSI report, but contrasted the somewhat ambiguous recommendations about statistical analyses in the APA's current Publication Manual against the relatively simple set of guidelines for manuscripts submitted to biomedical journals by the International Committee of Medical Journal Editors (1997). Kirk (2001) also welcomed the TFSI report but suggested that the next (sixth) edition of the Publication Manual should contain a much more detailed section on the recommendations of the TFSI. He also noted the relative absence of examples in the current Publication Manual (fifth edition) of how to appropriately report statistics. See TFSI (2000) for responses to some of these criticisms. Interviews by Fidler (2002) with some of the principals shed light on why the fifth edition of the Publication Manual does not require reporting of effect sizes. There are some situations where it is difficult or impossible to compute effect sizes. This is especially true for some complex repeatedmeasures designs or multivariate designs. Thus, there was a reluctance to mandate a requirement that in some research contexts could not be met. However, it is possible to calculate effect sizes in perhaps most behavioral studies. It is also true that the effect size estimation void for some kinds of designs is being filled by ongoing research, and is or soon will be filled.
PROSPECTIVE I believe the events just described indicate a future in which the role of traditional statistical tests in behavioral research will get smaller and smaller. This change will not happen overnight, and statistical tests are not about to disappear in the short term. Indeed, it is expected in the meantime that researchers will still have to report the results of statistical tests in their
14
CHANGING TIMES
manuscripts. This is because, to be frank, their manuscripts may be rejected if they contain no statistical tests. However, researchers should give much less interpretive weight to outcomes of statistical tests than in the past. Specific recommendations follow. 1. Researchers should not view a statistically significant result as particularly informative. For example, they should not conclude that such results are automatically noteworthy or that they are likely to replicate. 2. Researchers should also not discount a statistically nonsignificant result. For example, they should not conclude that failing to reject the null hypothesis means that the population effect size is zero. This false belief may be responsible for the overlooking of possibly beneficial effects in health research (R. Rosenthal, 1994). 3. Effect sizes should always be reported, and confidence intervals should be constructed about them whenever possible. However, real reform does not involve computing effect sizes only for statistically significant results. This would amount to "business as usual" where the statistical test is still at center stage (Sohn, 2000). Real reform also means that effect sizes are interpreted and evaluated for their substantive significance, not just reported. Other recommendations are given later in the book, many of which do not involve the use of statistical tests at all. This is consistent with a vision of the future in behavioral research that 1 and others advocate (e.g., B. Thompson, 2002b): Most studies in the future will not use statistical tests as the primary decision criterion, and those that do will concern only very specific problems for which variations of NHST may be appropriate, such as equivalence testing or inferential confidence intervals (chap. 3, this volume). It is also envisioned that the social sciences will become more like the natural sciences. That is, we will report the directions and magnitudes of our effects, determine whether they replicate, and evaluate them for their theoretical, clinical, or practical significance, not just their statistical significance (Kirk, 1996).
VOICES FROM THE FUTURE As mentioned, it may be easier for younger researchers who are not as set in their ways to respond to the call for reform in methods of data analysis and inference. However, some journal editors—who are typically accomplished and experienced researchers—are taking the lead in reform. INTRODUCTORY CONCEPTS
15
So are the authors of many of the works cited in this book. Students are also promising prospects for reform because they are, in my experience and that of others (Hyde, 2001), eager to learn about limitations of traditional statistical tests. They can also understand, with proper instruction, ideas such as effect size and confidence intervals, even in introductory statistics courses. In fact, it is my experience that it is easier to teach undergraduates these concepts than the convoluted logic of NHST. Other basics of reform are even easier to teach, such as the need for replication. Presented next are some example responses to the question, "What is the most important thing you learned in this class?" on a recent final examination in introductory psychology statistics I gave. These words from future behavioral researchers also reiterate some of the major goals of this book. May we all be so wise. • Null hypothesis significance testing is not the only or necessarily the best way to test hypotheses. • Just because a finding is statistically significant doesn't mean that it's important or reliable. • If you increase the sample size enough, any result will be statistically significant. This is scary. • To be skeptical of research papers that put a large emphasis on statistical significance. • Statistical significance does not mean practical significance. Effect size, power, means, and standard deviations should be included in research reports. There needs to be in the social sciences a better understanding of statistical tests so that we can make better, more informed choices. It has been said that if we do not make the future, others will do it for us. It is time to start building our future by moving beyond statistical tests and leaving behind other, old ways of doing things. We need to explore other possibilities for testing our hypotheses, ones that may lead to a more productive future for research in psychology and related disciplines. I hope this book will challenge, encourage, and support readers to think and act along these lines.
CONCLUSION The controversy about statistical tests in psychology was briefly described, as were the events leading up to it. This history gives the context for the 1999 report of the Task Force on Statistical Inference and the 2001 fifth edition of the Publication Manual of the APA. It also indicates that the continued use of statistical tests as the sole way to test hypotheses and
16
CHANGING TIMES
make inferential decisions in the behavioral sciences is unlikely. The points raised set the stage for reviewing in the next chapter some fundamental statistical concepts. These concepts are also crucial for understanding the limitations of statistical tests and characteristics of some proposed alternatives, such as interval estimation and effect size estimation.
RECOMMENDED READINGS Gigerenzer, G. (1993). The superego, the ego, and the id in statistical reasoning. In G. Keren & C. Lewis (Eds.), A handbook for data analysis in the behavioral sciences: Vol. 1. Methodological issues (pp. 311-339). Hillsdale, NJ: Erlbaum. Kirk, R. E. (2001). Promoting good statistical practices: Some suggestions. Educational and Psychological Measurement, 61, 213-218. Wilkinson, L, & the Task Force on Statistical Inference. (1999). Statistical methods in psychology journals: Guidelines and explanations. American Psychologist, 54, 594-604.
INTRODUCTORY CONCEPTS
17
2 FUNDAMENTAL CONCEPTS
When we are self-indulgent and uncritical, when we confuse hopes and facts, we slide into pseudoscience and superstition. —Carl Sagan (1996, p. 27)
This chapter prepares readers for learning about alternatives to statistical tests through survey of fundamental concepts about research designs, variables, and estimation. Also reviewed are characteristics of statistical tests in general and those of three of the most widely used tests in comparative studies, the t test and F test for means and the chi-square (%2) test for twoway contingency tables. We will see in the next chapter that there are many misunderstandings about statistical tests, so readers should pay close attention to the discussions that follow. Exercises with answers for this chapter are available on this book's Web site.
TERMS AND IDEAS ABOUT COMPARATIVE STUDIES Essential ideas about study design and the nature of independent or dependent variables are reviewed in this section. It is hoped that this presentation will build a common vocabulary for later chapters. Independent Samples Designs and Correlated Designs An independent variable (factor) has at least two levels. In an independent samples (between-subjects) design, each level is studied with an unrelated sample (group), and every case is measured once on the dependent (outcome) variable. If cases are randomly assigned to samples, the factor
19
is a manipulated or experimental variable and the design is a randomizedgroups or completely randomized design. If cases are classified into groups based on an intrinsic characteristic such as gender, the factor is a nonexperimental or individual'difference variable. Studies in which all factors are individualdifference variables are referred to as nonexperimental, correlational, or observational studies. The samples are related in a dependent-samples or correlated design. There are two kinds. In a repeated-measures or within-subjects design, each case is measured at every level of the factor, such as pretest and posttest. This means that the "samples" are actually identical across the levels of the factor. R. Rosenthal, Rosnow, and Rubin (2000) distinguished between intrinsically and nonintrinsically repeated-measures designs. The logic of the former requires multiple assessments of each case, such as when maturational change is studied in individuals. The rationale of a nonintrinsically repeatedmeasures design does not require multiple testing of each case because the same factor could theoretically be studied with independent samples. For instance, the effect of caffeine versus no caffeine on athletic performance could be studied with unrelated groups in a completely randomized design or with just one group in a repeated-measures design. In the second kind of correlated design, a matched-groups design, a separate group corresponds to each level of the factor, just as in between-subjects designs. The difference is that each case in a matched-groups design is explicitly paired with a case in every other sample on at least one matching variable, which controls for this variable. Compared to designs with independent samples, correlated designs may reduce error variance and increase statistical power. For these reasons, a correlated design may be chosen over an independent samples design even though the research question does not require dependent samples. These advantages have potential costs, though. Repeated-measures designs may require controls for order effects, and matched-groups designs are subject to regression effects if cases come from the extremes of their respective populations. See Ellis (1999) for a clear discussion of these and other design issues when studying dependent samples. Balanced and Unbalanced Designs An independent samples design is balanced if the number of cases in each group (n) is the same. If any two groups are of different size, the design is unbalanced. With no missing data, correlated designs are inherently balanced. Although there is no general statistical requirement for balanced designs, there are some potential drawbacks to unbalanced designs. One is loss of statistical power even if the total number of cases is the same
20
FUNDAMENTAL CONCEPTS
for a balanced versus an unbalanced design. Suppose that nt = r\i = 50 for a balanced two-group design. R. Rosenthal et al. (pp. 30-32) showed that the relative loss of power for an unbalanced design where n\ = 70 and n2 = 30 is equivalent to losing 16 cases (16% of the sample size) from the balanced design. The relative power loss increases as the group size disparity increases. A critical issue concerns the reason why the group sizes are unequal. For example, an unbalanced design may arise because of randomly missing data from a design intended as balanced, such as when equipment fails and scores are not recorded. A handful of missing observations is probably of no great concern, such as if HI = 100 and T\I = 97 as a result of three randomly missing scores. A more serious problem occurs when unbalanced designs are a result of nonrandomly missing data, such as when higher proportions of participants drop out of the study under one condition than another. Nonrandomly missing observations in this instance may cause a bias: Study participants who withdrew may differ systematically from those who remain, and the results may not generalize to the intended population. Unfortunately, there is no simple statistical "fix" for bias because of nonrandomly missing data. About all that can be done is to understand the nature of the data loss and how it affects the results; see West (2001) for more information. Sometimes unbalanced designs are intentional—that is, based on a specific sampling plan. Standardization samples of contemporary ability tests are often stratified by demographic or other variables to match recent census data about the population of the United States. Because sizes of groups based on demographic variables such as gender or age are not usually equal in the population, samples so stratified may be unbalanced. Unequal group sizes in this case is actually an asset because it helps to ensure the representativeness of the sample in terms of relative group sizes. There are also times when groups with relatively low population base rates are intentionally oversampled. This is a common practice in research with special populations. Suppose that the base rate of clinical depression in the general population is 5%. In a particular study, a group of n\ = 50 depressed patients is compared with n.2 = 50 control cases. This design is balanced, which maximizes the power of the group contrast. However, the base rate of depression in the sample is 10 times higher than in the population. Because sample base rates affect statistical tests and some types of effect size estimates, the results may not generalize if the population base rates are very different. Schultz and Grimes (2002) made the point that equal group sizes are not always an asset even in randomized trials. Specifically, they show that forcing equal group sizes through restricted forms of random assignment, such as permuted-blocks randomization, may introduce bias compared to
INTRODUCTORY CONCEPTS
21
simple randomization, which does not guarantee equal group sizes. Thus, whether unequal group size is a problem depends on the research context. Multiple Independent or Dependent Variables Studies with just one independent variable are called singk'factor or one'way designs. However, many behaviors studied by social scientists are affected by more than one variable. One of the goals of a multifactor design is to model this complexity by including two or more factors in the design. The terms higher order, factorial, or blocking design, among others, describe various kinds of multifactor designs. Blocking designs involve partitioning the total sample into groups based on an individual-difference variable (e.g., age) believed to affect outcome. If cases within each block are randomly assigned to levels of a manipulated factor, the resulting two-way design is a randomized-blocks design. Effect size estimation in single-factor designs is covered in chapters 4 through 6, and chapter 7 deals with this topic for multifactor designs. Regardless of the number of factors, comparative studies with just one dependent variable are univariate designs. Many common statistical tests such as the t and F tests for means are generally univariate tests. Multivariate designs have at least two dependent variables, which allows measurement of outcome in more than one area. This book deals only with univariate designs. Because entire volumes are devoted to the basics of multivariate methods (e.g., Grimm & Yarnold, 1995, 2000), it is beyond the scope of this book to deal with them in detail. Also, multivariate analyses often wind up as a series of univariate analyses conducted with individual outcomes. This book's Web site has a supplemental chapter about multivariate effect size estimation in designs with independent samples and fixed factors. Fixed-Effects and Random-Effects Factors This distinction affects how the results are to be generalized and how effect size magnitude should be estimated. It is introduced by example: Suppose that the independent variable is dosage of a drug. There are theoretically an infinite number of dosages. If, say, five different dosages are randomly selected for study, the drug factor is a random-effects factor. Selecting dosages at random may give a representative sample from all possible levels. If so, the results of the study may generalize to the whole population of dosages. However, if the particular dosages for study are selected by some other means, the drug factor is probably a fixed-effects factor. For instance, a researcher may intentionally select five different dosages that form an equalinterval scale, such as 0 (control), 3, 6, 9, and 12 mg • kg"1. Because these
22
FUNDAMENTAL CONCEPTS
dosages are not randomly selected, the results may not generalize to other dosages not included in the original study, such as 15 mg • kg"1. Qualitative factors are usually treated as fixed factors. This is especially true for individual-difference variables such as gender where all possible levels may be included in the study. Quantitative variables can be analyzed as either fixed or random factors. A control /actor is a special kind of random factor that is not of interest in itself but is included for the sake of generality (Keppel, 1991). Suppose that participants are required to learn a list of words. If only a single word list is used, it is possible that the results are specific to the particular words on that list. Using several different lists matched on characteristics such as relative word frequency and treating word list as a random factor may enhance generalizability. Repeated-measures factors that involve trials or measurement at specific times, such as three and six months after treatment, are usually considered fixed. If there are many repeated measures and only some are randomly selected for analysis, the repeated-measures factor is considered random. Designs with random factors may require special considerations in statistical testing and effect size estimation. Thus, it may be better to consider a factor as fixed instead of random if in doubt. Chapters 6 and 7 deal with designs in which there is at least one random factor. Please note that the subjects factor is almost always seen as random because its levels—the individual cases—are usually different from study to study. Covariate Analyses Both correlated and blocking designs may reduce error variance compared to independent samples and one-way designs, respectively. Another way is covariate analysis. A covariate is a variable that predicts outcome but is ideally unrelated to the independent variable. The variance explained by the covariate is removed, which reduces error variance. Suppose a basic math skills pretest is given to students before they are randomly assigned to different instructional conditions for introductory statistics. Outcome is measured with a common final examination. It is likely that the pretest will covary with exam scores. In an analysis of covariance (ANCOVA), the effect of the pretest is statistically removed from the outcome variable. With enough reduction in error variance, the power of the test of instructional condition may be increased. Because ANCOVA is a statistical method, it can be incorporated into any of the designs mentioned earlier. However, ANCOVA is usually appropriate only for randomly assigned groups, and it is critical to meet the statistical assumptions of this method. These points are elaborated in chapter 6 when effect size estimation in covariate analyses is discussed.
INTRODUCTORY CONCEPTS
23
SAMPLING AND ESTIMATION Basic issues in sampling and estimation are reviewed next, including types of samples, statistics as estimators of population parameters, and interval estimation (i.e., the construction of confidence intervals based on sample statistics). Types of Samples One of the hallmarks of behavioral research is the distinction between populations and samples. It is rare that whole populations are studied. If the population is large, vast resources may be needed to study it. For example, the budget for the 2000 census of the population of the United States was about $4.5 billion, and almost a million temporary workers were hired for the endeavor (U.S. Census Bureau, 2002). It may be practically impossible to study even much smaller populations. For example, the base rate of autism is about 4 in 10,000 children (.04%). If autistic children are dispersed over a large geographic area or live in remote regions, studying all of them may be impracticable. Behavioral scientists must usually make do with small subsets of populations or samples. There are three general kinds of samples: random, systematic, and ad hoc. Random samples are selected by a chance-based method that gives all observations an equal probability of appearing in the sample, which may yield a representative sample. Observations in systematic samples are selected using some orderly sampling plan that may yield a representative sample, but this is not guaranteed. Suppose that an alphabetical list of every household is available for some area. A random number between 10 and 20 is generated and turns out to be 17. Every 17th household from the list is contacted for an interview, which yields a 6% (1/17) sample in that area. Most samples in social science research are neither random nor systematic but rather ad hoc samples, also called samples of convenience, locally available samples, or accidental samples. All of these terms imply the study of samples that happen to be available. A group of undergraduate students in a particular class who volunteer as research participants is an example of a convenience sample. There are two problems with such samples. First, they are probably not representative. For instance, it is known that volunteers differ systematically from nonvolunteers. Second, distributional theories that underlie statistical tests generally assume random sampling. If the data are from ad hoc samples, there is a conceptual mismatch with the test's distributional theory. This is a criticism of statistical tests among others considered in the next chapter. Despite the potential problems of ad hoc samples, it is often difficult or impossible to collect random or even systematic samples. True random 24
FUNDAMENTAL CONCEPTS
sampling requires a list of all observations in the population, but such lists rarely exist. Also, the notion of random or systematic sampling does not apply to animal research: Samples in this area are almost never randomly selected from known populations of animals. Perhaps the best way to mitigate the influence of bias in ad hoc samples is to follow what is now a fairly standard practice: Measure a posteriori a variety of sample characteristics and report them along with the rest of the results, which allows readers of the study to compare its sample with those of other studies in the same area. Another option is to compare the sample demographic profile with that of the population (if such a profile exists) to show that the sample is not obviously unrepresentative. Sample Statistics as Estimators Values of population parameters, such as means (|i), variances (a2), or correlations (p), are usually unknown. They are instead estimated with sample statistics, such as M (means), s2 (variances), orr (correlations). These statistics are subject to sampling error, which refers to the difference between an estimator and the corresponding population value. These differences arise because the values of statistics from random samples tend to vary around that of the population parameter. Some of these statistics will be too high and others too low (i.e., they over- or underestimate the population parameter), and only a relatively small number will exactly equal the population value. This variability among estimators from different samples is a statistical phenomenon akin to background (natural) radiation: It's always there, sometimes more or less, fluctuating randomly from sample to sample. The amount of sampling error is generally affected by the variability of population observations, how the samples are selected, and their size. If the population is heterogenous (e.g., O is large), values of sample statistics may also be quite variable. Obviously, values of estimators from biased samples may differ substantially from that of the corresponding parameter. Given reasonably representative sampling and constant variability among population observations, sampling error varies inversely with sample size. This implies that statistics in larger samples tend to be closer on average to the population parameter than in smaller samples. This property describes the law of large numbers, and it says that one is more likely to get more accurate estimates from larger samples than smaller samples. Sample statistics are either biased or unbiased estimators of the corresponding population parameter. The sample mean is an unbiased estimator because its average (expected) value across all possible random samples equals the population mean. The sample variance—also called a mean square—is an unbiased estimator of population variance if computed as the ratio of the sum of squares over the degrees of freedom, or INTRODUCTORY CONCEPTS
25
df
N-l
'
where X is an individual score. In contrast, a sample variance derived as S2 = SS IN is a negatively biased estimator because its values are on average less than a2. All references to sample variances that follow assume Equation 2.1 unless otherwise indicated. Expected values of statistics that are positively biased estimators generally exceed that of the corresponding parameter. There are ways to correct some statistics for bias. For example, although s2 is an unbiased estimator of a2, the sample standard deviation s is a negatively biased estimator of o. However, multiplication of s by the correction factor in parentheses that follows
yields the statistic d, which is a numerical approximation to the unbiased estimator of c. Because the value of the correction factor in Equation 2.2 is larger than 1.00, d > s. There is also greater correction for negative bias in smaller samples than in larger samples. If N = 5, for instance, the unbiased estimate of <J is d = {1 + l/[4 (5 - 1)]} 5 = (1.0625)s but for N = 50, the unbiased estimate is 0 = {1 + l/[4 (50- 1)]}S = (1.005l)s which shows relatively less adjustment for bias in the larger sample. In even larger samples, the value of the correction factor in the previous equation is essentially 1.00; that is, there is practically no adjustment for bias. This is another instance of the law of large numbers: Averages of even-biased statistics from large samples tend to closely estimate the corresponding parameter. Point and Interval Estimation Sample statistics are used for two types of estimation. Point estimation is when the value of a sample statistic (e.g., M) is taken as the sole estimate of a parameter (e.g., (J,). Because of sampling error, however, it is quite unlikely that the two will be equal. Interval estimation recognizes this reality
26
FUNDAMENTAL CONCEPTS
by constructing a confidence interval about a point estimate. A confidence interval reflects the amount of sampling error associated with that estimate within a specified level of uncertainty. A confidence interval can also be seen as a range of plausible values for the corresponding parameter. In graphical displays, confidence intervals may be represented as error bars around a single point. Carl Sagan (1996) called error bars "a quiet but insistent reminder that no knowledge is complete or perfect" (pp. 27-28). Wider reporting of confidence intervals is also part of suggested reform of statistical practice in the social sciences (see chapter 1). We need a more precise definition of a confidence interval. The following is based on Steiger and Fouladi (1997, pp. 229-230): 1. A 1 — (X confidence interval for (on) a parameter is a pair of statistics yielding an interval that, over repeated samples, includes the parameter with probability 1 - (X. (The symbol oc is the level of statistical significance.) 2. A 100 (1 - oc)% confidence interval for a parameter is a pair of statistics yielding an interval that, over repeated samples, includes the parameter 100 (1 - Ct)% of the time. The value of 1 - a is selected by the researcher to reflect the degree of statistical uncertainty. The lower bound of a confidence interval is the lower confidence limit, and the upper bound is the upper confidence limit. Because the most common levels of statistical significance in NHST are oc = .05 or (X = .01, one usually sees in the literature either 95% or 99% confidence intervals. However, it is possible to construct confidence intervals that correspond to other levels of statistical significance. For example, error bars around points that represent means in graphs are sometimes each one standard error wide, which corresponds roughly to a = .32 and a 68% confidence level. In traditional confidence intervals—those based on central test statistics (defined next)—the sample statistic is usually exactly between the lower and upper bounds. That is, the width of the interval is symmetrical around the estimator. The phrase "a confidence interval about" an estimator is sometimes used to describe a symmetrical confidence interval. However, this phrase neglects to mention the population parameter that the interval is intended to approximate. It is also the case that the estimator does not always fall at the very center of other kinds of confidence intervals, such as those based on noncentral test statistics (also defined next). The traditional way to construct a confidence interval is by adding and subtracting from a statistic the product of its standard error and the two-tailed critical value at the (X level of statistical significance in a relevant central test distribution, such as t. A standard error is the standard deviation of the sampling distribution of an estimator. The square of the standard
INTRODUCTORY CONCEPTS
27
error is the conditional variance, the variance of the sampling distribution. A sampling distribution is a probability distribution based on random samples all of size N. In general, standard errors vary directly with variability among population observations and inversely with sample size. The latter explains part of the law of large numbers: Distributions of statistics from larger samples are generally narrower than distributions of the same statistic from smaller samples. A central test distribution assumes that the null hypothesis is true. Central test distributions are used in null hypothesis significance testing (NHST) to determine the critical values of test statistics. Tables of critical values for distributions such as t, F, and %2 found in many introductory statistics textbooks are based on central test distributions. Standard errors of statistics with simple sampling distributions can be estimated with formulas that have appeared in statistical textbooks for some time. By a "simple" distribution it is meant that (a) the statistic estimates only a single population parameter, and (b) both the shape and variance of its sampling distribution are constant regardless of the value of the parameter. Distributions of means and mean differences are simple as just defined, and traditional confidence intervals for them are discussed next. Confidence Intervals for fJi The standard error in a distribution of random means is
(2.3) Because the population variance a2 is not generally known, this standard error is usually estimated as
This estimate is subject to sampling error because the variance s2 is a sample statistic. The relevant test statistic for means when O is unknown is central t, so the general form of a confidence interval for |l based on a single observed mean is M±5M[t2.taU,a(N-l)]
(2.5)
where the term in brackets is the positive two-tailed critical value in a central t distribution with N - 1 degrees of freedom at the a level of statistical significance. Suppose we find in a sample of 25 cases that M = 100.00 and s = 9.00. The standard error is
28
FUNDAMENTAL CONCEPTS
SM = 9.00/251/2 = 1.80 and t2.taii, .05 (24) = 2.064- The 95% confidence interval for (J, is thus 100.00 ± 1.80 (2.064) or 100.00 ± 3.72, which defines the interval 96.28-103.72. The 99% confidence interval for (l is constructed the same way except t2.taiii .01 (24) = 2.797: 100.00 + 1.80 (2.797) or 100 ± 5.03, which defines the interval 94.97-105.03. The 99% confidence interval is wider than the 95% confidence interval based on the same statistic because a greater margin of error is allowed. Let us consider now the correct interpretation of the 95% confidence interval for (0, derived earlier, 96.28-103.72: 1. This interval defines a range of outcomes that should be considered equivalent to the observed result (M = 100.00) given the amount of expected sampling error at the 95% confidence level. 2. It also provides a reasonable estimate of the population mean. That is, |A could be as low as 96.28 or it could be as high as 104.72, again at the 95% confidence level. 3. Of course, there is no guarantee that p. is actually included in the confidence interval. We could construct the 95% confidence interval around the mean in another sample, but the center or endpoints of this new interval will probably be different compared with the original. This is because confidence intervals are subject to sampling error, too. 4. However, if 95% confidence intervals are constructed around the means of all random samples drawn from the same population, then 95/100 of them will include |I. The last point gives a more precise definition of what we mean by "95% confidence level" or "95% confident" from a frequentist or long-run relative-frequency view of probability as the likelihood of an outcome over repeatable events under constant conditions except for random error. This view also assumes that probability is a property of nature that is independent of what the researcher believes. In contrast, a subjectivist or subjective degreeof-belief view defines probability as a personal belief the researcher has about nature that is independent of nature's true state. The same view also does not distinguish between repeatable and unrepeatable (unique) events (Oakes, 1986; Reichardt & Gollob, 1997). Although researchers in their daily lives probably take a subjective view of probabilities, it is the frequentist definition that generally underlies sampling theory. INTRODUCTORY CONCEPTS
29
A researcher is probably more interested in knowing the probability that a specific 95% confidence interval contains |i than in knowing that 95/100 of all such intervals do. From a frequentist view, this probability for the unique confidence interval of our example, 96.28-103.72, is either 0 or 1.0. That is, this interval either contains JJ, or it does not. Thus, it is generally incorrect from this perspective to say that the interval 96.28-103.72 has a probability of .95 of including u.. Reichardt and Gollob (1997) noted that this kind of specific probability inference and the related specific confidence inference that one is 95% confident that the interval includes (0, is permitted only in a very particular circumstance, which is that every possible value of (J. is considered equally likely before the study is conducted. In Bayesian estimation, which is based on a subjectivist view of probability, the same circumstance is described by the principle of indifference, which says that in the total absence of information about the parameter, equal probabilities are assumed for all possible values. However, rarely do we have absolutely no information about likely or even plausible values for the population mean. In contrast, percentages associated with Bayesian confidence intervals are interpreted as probabilities that the parameter lies within the interval. This is what most researchers really want to know but generally cannot get from a traditional confidence interval. The fundamentals of Bayesian estimation are considered in chapter 9. There is a kind of compromise language for describing traditional confidence intervals that "splits the difference" between frequentist and subjectivist views of probability. Applied to our example, it goes like this: The unique interval 96.28-103.72 estimates fi, with 95% confidence. This statement may not be incorrect from a frequentist perspective because it is not quite a specific confidence inference. It also gives a nod toward the subjectivist view because it associates a degree of belief with a specific interval. Like other compromises, however, it may not please purists who hold one view of probability or the other. The issues raised about the proper interpretation of percentages associated with unique confidence intervals foreshadow similar difficulties in interpreting probabilities (p values) from statistical tests. Part of the problem is a clash between the long-run relative-frequency view of probability generally assumed by these tests and a subjective view of probability held by perhaps most researchers who use them. Another is the gap between what researchers really want to know and what ap value from a statistical test actually tells them. Confidence Intervals for ju^ - jm,2 The standard error in a distribution of differences (contrasts) between pairs of means from independent samples selected from different populations is
30
FUNDAMENTAL CONCEPTS
where O"i and O2 are the population variances and HI and n2 are the sizes of each sample (group). If we assume homogeneity of population variance (i.e., of = o~ 2 ), the expression for the standard error reduces to
(2-7) where a2 is the common population variance. This variance is usually unknown, so the standard error is estimated by
where SP is the pooled within-groups variance, which is the average of the two group variances weighted by the degrees of freedom. It's equation is 2 _
nt -
W
Sp — ~~Tr
dfw
—
si
(n2 ^
nt + n2 - 2
\£*s)
where SSw? and dfw are, respectively, the pooled within-groups sum of squares and degrees of freedom. The latter can also be expressed as dfw = d/i + dfi = N - 2. Only in balanced designs can Sp also be calculated as the average of the two group variances, or (sf + s|)/2. The general form of a confidence interval for (Xj - |o,2 based on the difference between independent means is
(Mt - M2) ± SMl _M2 ft2.tail, „ (N - 2)]
(2.10)
where MI - M2 is the observed mean contrast and N - 2 is the pooled within-groups degrees of freedom (dfw) of the positive two-tailed critical value of t at the a level of statistical significance. Suppose in a balanced two-group design where n = 5 we observe
MI - M2 = 2.00, sf = 7.50, s^ = 5.00 which implies Sp = (7.50 + 5.00)/2 = 6.25. The standard error for the contrast is
s M l - M = [6-25 (1/5 + 1/5)]1/2 = 1.58 INTRODUCTORY CONCEPTS
31
and £2-taii, .05 (8) = 2.306. The 95% confidence interval for the mean contrast is 2.00 + 1.58(2.306)
or
2.00 ± 3.65
(2.11)
which defines the interval -1.65-5.65. Based on these results we can say that |ii - ^.2 could be as low as -1.65 or as high as 5.65, with 95% confidence. Please note that this interval includes zero as a reasonable estimate of (0,1 - (J-2- This fact is subject to misinterpretation. For example, it may be incorrectly concluded that (J^ = (J.2 because zero falls between the lower and upper bounds of the confidence interval. However, zero is only one value within a range of estimates of \ii - |l2, so in this sense it has no special status in interval estimation for this example. Besides, the confidence interval itself is subject to sampling error, so zero may not be included within the 95% confidence interval for [ij - jj,2 in a replication. It is the range of overlap between the two confidence intervals (if any) that would be of greater interest than whether zero is included in one interval or the other. These issues are elaborated next. Now let us consider confidence intervals for contrasts between dependent means. Below we use the symbol MD to refer the average difference score when two dependent samples are compared. A difference score is computed as D = Xj - %2 for each of the n cases in a repeated-measures design or for each of the n pairs of cases in a matched-groups design. (Difference scores are also called gain scores or change scores.) If D = 0, there is no difference; any other value indicates a higher score in one condition than in the other. The average of all the difference scores equals the dependent mean contrast, or MD = MI — M2. The standard error of Mp is (2.12) where the OD and OD are, respectively, the population variance and standard deviation of the difference scores. The variance OD takes account of the population correlation of the scores between the conditions, which is designated in Equation 2.13 as pi2. Assuming homogeneity of variance, the variance of the difference scores is afe = 2a2(l - p12)
(2.13)
where a2 is the common population variance. When there is a stronger subjects effect—cases maintain their relative positions across the conditions— pi2 approaches 1.00. This reduces the variance of the difference scores, which in turn reduces the standard error of the dependent mean contrast 32
FUNDAMENTAL CONCEPTS
(Equation 2.12). It is this subtraction of consistent individual differences from the standard error that makes confidence intervals based on dependent mean contrasts generally narrower than confidence intervals based on contrasts between unrelated means. It also explains the power advantage of the t test for dependent samples over the t test for independent samples, which is considered next. However, these advantages are realized only if p^ > 0. Otherwise, confidence intervals and statistical tests may be wider and less powerful (respectively) for dependent mean contrasts. The population variance of the difference scores, Oj> is usually unknown, but it is often estimated as
where SD and $£, are, respectively, the sample variance and standard deviation of the difference scores. The former is calculated as
SD = sf + si - 2 covn
(2.15)
where cov\i is covariance of the observed scores across the conditions. It is the product of the cross-conditions correlation and the within-conditions standard deviations:
covl2 = rn sj s2
(2.16)
As r\i approaches 1.00, the variance sogets smaller, which in turn decreases the estimated standard error of the dependent mean contrast. The general form of a confidence interval for (ID is
MD±SMD[t2-«ii.«(n-l)]
(2.17)
Suppose for a dependent samples design we observe the following data:
MI - M2 = 2.00, 5] = 7.50, s22 = 5.00, r12 = .735
Given the above information, SD = 7.50 + 5.00 - 2 (.735) (7.501/2) (5.001/2) = 3.50 SMD = (3.50/5)1/2 = .837 The value of £2-011, .05 (4) is 2.776, so the 95% confidence interval for (J,D is 2.00 ± .837 (2.776) or 2.00 ± 2.32
INTRODUCTORY CONCEPTS
(2.18)
33
which defines the interval -.32-4.32. Please note that the 95% confidence interval assuming a dependent-samples design is narrower than the 95% confidence interval based on the same means and variances for an independent-samples design, which is -1.65-5.65. (Compare Equations 2.11 and 2.18.) This result is expected because r\i is relatively high (.735) for the dependent-samples design (r\i is presumed to be zero when the samples are independent). Confidence Intervals for Other Kinds of Statistics Many statistics other than means have complex distributions. For example, distributions of sample proportions for a dichotomous variable are symmetrical only if the population proportion is Jl = .50; the same is true for the Pearson correlation r only if the population correlation is p = 0. Other statistics have complex distributions because they estimate more than one population parameter. This includes some widely used effect size indexes such as standardized mean differences, which for contrasts between independent means generally estimate 8 = (flj — Ji2)/o, the ratio of the population mean difference over the common population standard deviation. (Chapter 4 considers standardized mean differences in detail.) Until recently, confidence intervals for statistics with complex distributions have been estimated with approximate methods. One such method involves confidence interval transformation (Steiger & Fouladi, 1997) in which the statistic is mathematically transformed into units that are normally distributed. The confidence interval is built by adding and subtracting from the transformed statistic the product of the standard error in the transformed metric and the appropriate positive two-tailed critical value of the normal deviate z- The lower and upper bounds of this interval are then transformed back into the metric of the original statistic, and the resulting interval may be asymmetrical around that statistic. The construction of confidence intervals for p based on the Fisher's Z transformation of r is an example of this approach, which is covered in many statistics textbooks (e.g., Glass & K. Hopkins, 1996, pp. 357-358). Other transformation-based methods for constructing confidence intervals for the population parameters estimated by effect size statistics are introduced in later chapters. Another approximate method builds confidence intervals directly around the sample statistic and are thus symmetrical about it. The width of the interval on either side is a product of the two-tailed critical value of a central test statistic and an estimate of the asymptotic standard error, which estimates what the standard error of the statistic would be in a large sample (e.g., N > 500). However, if the researcher's sample is not large, the estimated standard error based on this approach may not be very accurate.
34
FUNDAMENTAL CONCEPTS
Another drawback to this method is that the distributions of some sample statistics, such as the multiple correlation R, are so complex that a computer is needed to derive the estimated standard error. Fortunately, there are increasing numbers of computer programs for calculating confidence intervals, some of which are mentioned later. A more exact method for constructing confidence intervals for statistics with complex distributions is noncentrality interval estimation (Steiger & Fouladi, 1997). It also deals with situations that cannot be handled by approximate methods. This method is based on noncentral test distributions that do not assume that the null hypothesis is true. A bit of perspective is in order: Families of central distributions of t, F, and %2 are special cases of noncentral distributions of each test statistic just mentioned. Compared to central distributions, noncentral distributions have an additional parameter called the noncentrality parameter. This extra parameter basically indicates the degree of departure from the null hypothesis. For example, central t distributions are described by a single parameter, the degrees of freedom, but noncentral t distributions are described by both the degrees of freedom and a noncentrality parameter. If this parameter equals zero, the resulting distribution is the familiar and symmetrical central t distribution. As the value of the noncentrality parameter is increasingly positive, the noncentral t distributions described by it become increasingly positively skewed (e.g., Gumming & Finch, 2001, fig. 5). The same thing happens but in the opposite direction for negative values of the noncentrality parameter for t distributions. Noncentrality interval estimation is impractical without relatively sophisticated computer programs for iterative estimation. Until just recently, such programs have not been widely available to applied researchers. A notable exception in a commercial software package for general statistical analyses is the Power Analysis module by J. Steiger in STATISTICA (StatSoft Inc., 2003), which can construct noncentral confidence intervals based on several different types of statistics (Steiger & Fouladi, 1997). This includes many of the standardized indexes of effect size introduced in later chapters. There are now also a few different stand-alone programs or scripts (macros) for noncentrality interval estimation, some available for free through the Internet. These programs or scripts are described in chapter 4, and the Web site for this book also has links to corresponding download pages. Later chapters demonstrate the calculation of both approximate and more exact noncentral confidence intervals for standardized effect size indexes. The technique of bootstrapping, a method for statistical resampling, can also be used to construct confidence intervals. Chapter 9 reviews the rationale of bootstrapping.
INTRODUCTORY CONCEPTS
35
LOGIC OF STATISTICAL SIGNIFICANCE TESTING A brief history of NHST was given earlier. This section outlines the basic rationale and steps of NHST as it is often practiced today. The following review lays the groundwork for understanding limitations of NHST considered in the next chapter. Contexts and Steps There are two main contexts for NHST, reject-support (RS) and acceptsupport (AS). The former is the most common and concerns the case in which rejection of the null hypothesis supports the researcher's theory. The opposite is true in AS testing: It is the failure to reject the null hypothesis that supports what the researcher actually believes. Listed next are the main steps of NHST for both RS and AS testing. Each step is discussed in the sections that follow with emphasis on points that are not as well known as they should be. 1. Based on the research question, formulate the first of two statistical hypotheses, the null hypothesis HQ. 2. Formulate the second statistical hypothesis, the alternative hypothesis H]. 3. Set the level of statistical significance a, which is the probability of a Type I error. 4- Collect the data and determine its probability p under H0 with a statistical test. Reject HQ if p < oc. Null Hypotheses The null hypothesis is a default explanation that may be rejected later given sufficient evidence. In RS testing, this default explanation is the opposite of the researcher's theory; in AS testing, the null hypothesis reflects the researcher's theory. In either RS or AS testing, the null hypothesis is usually a point hypothesis that specifies the numerical value of at least one population parameter. There are two different kinds of null hypotheses (J. Cohen, 1994). A nil hypothesis says that the value of a population parameter is zero or the difference between two or more parameters is zero. Examples of nil hypotheses are presented next: H0: M-D = 0
H0: Hi - M-z = 0
H0: p = 0
Nil hypotheses are usually statements of absence, whether of an effect, difference, or association. In contrast, a non-ni( hypothesis asserts that a
36
FUNDAMENTAL CONCEPTS
population parameter is not zero or that the difference between two or more parameters is not zero. It typically assumes a non-zero effect, difference, or association. Examples of non-nil hypotheses are given next:
H0: Ho = 10.00
H0: Hi - \L2 = 5.00
H0: p = .30
Nil hypotheses as default explanations are generally most appropriate when it is unknown whether effects or relations exist at all, such as in new research areas where most studies are exploratory. However, nil hypotheses are less suitable when it is known a priori that an effect is probably not zero. This is more likely in established research areas. For instance, it is known that women and men differ in certain personality characteristics (e.g., Feingold, 1994). Specification of H0: (ii - (0.2 = 0 (i.e., H0: \i\ = M-2) when testing gender differences in these characteristics may set the bar too low because this nil hypothesis is probably false. Accordingly, rejecting it is not an impressive scientific achievement. There are also situations where specification of a nil hypothesis is clearly indefensible. One example is using a nil hypothesis to test a reliability coefficient for statistical significance. For example, Abelson (1997a) noted that declaring a reliability coefficient to be nonzero based on such a test is the "ultimate in stupefyingly vacuous information" (p. 121). This is because what is really important to know is whether a reliability coefficient is acceptably high for a specific purpose, such as rxx > -90 when a test is used for individual assessments that determine access to treatment resources. Nil hypotheses are tested much more often in the social sciences than non-nil hypotheses. This is true even in established research areas where a nil hypothesis is often a "straw man" argument. There are at least three reasons for this puzzling situation: Many researchers are unaware of the possibility to specify non-nil hypotheses. Statistical software programs usually test only nil hypotheses. This means that tests of non-nil hypotheses must be computed by hand. Unfortunately, this is generally feasible only for relatively simple non-nil hypotheses, such as HQ: Hi - H-2= 5.00, which can be evaluated without difficulty with the t test. Alternative Hypotheses This second statistical hypothesis complements HQ. In RS testing, the alternative hypothesis HI represents the researcher's theory; in AS testing, it does not. Unlike the null hypothesis, the alternative hypothesis is typically a range hypothesis that specifies a range of values for the population parameter^). The two kinds of alternative hypotheses are directional (one-tailed, one-sided) and nondirectional (two-tailed, two-sided). Anondirectionalalter' native hypothesis predicts any result not specified in HQ, but a directional INTRODUCTORY CONCEPTS
37
alternative hypothesis specifies a range of values on only one side of the point prediction in HQ. For example, given HQ: (J-i = |J.2> there is only one possible nondirectional alternative hypothesis, HI: |li ^ (J,2, but two possible directional alternatives, HI: \li > |J,2 or Hj: (0,1 < JJ.2The choice between a nondirectional or directional H] is supposed to be made before the data are collected. If there are a priori reasons to expect a directional effect, the appropriate directional HI should be specified; otherwise, a nondirectional H! may be a safer bet. The choice between a directional or nondirectional H! affects the results of statistical tests as follows: It is easier to reject H0 when a directional HI is specified and the data are in the same direction. If H0 is actually false, there is also greater statistical power compared to a nondirectional HI. However, if a directional H! is specified but the data indicate an effect in the opposite direction, then one is supposed to fail to reject HO even if the results are very inconsistent with it. In practice, however, these conventions are not always followed. For example, it is sometimes not possible to reject HQ for a nondirectional H! but it is possible for a directional HI- A researcher who initially specified a nondirectional HI may "switch" to a directional alternative hypothesis to reject the null hypothesis. It also happens that researchers "switch" from one directional Hj to another depending on the data, again to reject HQ. Some would consider changing HO or HI based on sample results a kind of statistical "sin" that is to be avoided. Like admonitions against other kinds of sins, they are not always followed. Level of Type I Error Alpha (a) is the probability of making a Type I error; more specifically, it is the conditional prior probability of rejecting HQ when it is actually true (Pollard, 1993). Alpha is a prior probability because it is specified before the data are collected, and it is a conditional probability because HO is assumed true. In other words, cc = p (Reject H0 | H0 true)
(2.19)
where the symbol "|" means assuming or given. Alpha can also be understood as the probability of getting a result from a random sample that leads to the incorrect decision to reject the null hypothesis. All these descriptions of a are also long-run, relative-frequency statements about the probability of a Type I error. Conventional levels of a in the social sciences are either .05 or .01. When other levels are specified, they tend to be even lower, such as (X = .001. It is rare for researchers to specify a levels higher than .05. The main reason is editorial policy: Manuscripts may be rejected for publication if
38
FUNDAMENTAL CONCEPTS
(X > .05. This policy would make more sense if the context for NHST were always RS testing where a Type I error is akin to a false positive because the evidence is incorrectly taken as supporting the researcher's theory. As noted by Steiger and Fouladi (1997), the value of (X should be as low as possible from the perspective journal editors and reviewers, who may wish to guard against incorrect claims. In AS testing, however, they should worry less about Type I error and more about Type II error because false claims in this context arise from not rejecting HQ. Insisting on low values of (X in this case may facilitate publication of erroneous claims. It is important to realize that oc sets the risk of a Type I error for a single hypothesis test. However, rarely is just one hypothesis tested. When multiple statistical tests are conducted, there is also an experimentwise (family' wise) probability of Type I error, designated below as (XE^. It is the likelihood of making one or more Type I errors across a set of tests. If each individual test is conducted at the same level of a, then
aEW = 1 - (1 - a)c
(2.20)
where c is the number of tests, each conducted at the a level of statistical significance. In this equation, the term (1 - Ct) is the probability of not making a Type I error for any individual test; (1 - a)c is the probability of making no Type I errors across all tests; and the whole expression is the likelihood of committing at least one Type I error among the tests. We need to understand a couple of things about this equation. If only one hypothesis is tested, then <XEW = a. If there are multiple tests, this equation is accurate only if the hypotheses or outcome variables are perfectly uncorrelated. If not, the estimated rate of experimentwise Type I error given by this equation will be too low. The result generated by the equation is the probability of one or more Type I errors, but it does not indicate how many Type I errors may have been committed (it could be 1, or 2, or 3 . . . ) or on which hypothesis tests they occurred. Suppose that 20 statistical significance tests are conducted each at a = .05 level in the same sample. The experimentwise Type I error rate is
<XEW = 1 - (1 - -05)20 = .64 In other words, the risk of a making a Type I error across the whole set of 20 tests is 64%, given the assumptions just stated. There are two basic ways to control experimentwise Type I error: Reduce the number of tests or lower (X for each one. The former can be realized by honing one's questions down to the most substantively meaningful (prioritize the hypotheses). This also means that "fishing expeditions" where essentially every effect is tested are to be avoided. Another way to reduce
INTRODUCTORY CONCEPTS
39
the number of hypotheses is to use multivariate methods, which can test hypotheses across several variables at once. There is a relatively simple method to set a for individual tests called the Bonferroni correction: Divide a target value of (XEW by the number of tests, and set the corrected level of statistical significance a* for each individual test to the value of this ratio. Suppose a researcher wishes to limit the experimentwise risk of Type I error to 10%. If a total of 20 tests are planned, then a* = .10/20 = .005 for each individual test. Other methods are considered in chapter 6. However, readers should know that not all methodologists believe that controlling experimentwise Type I error is a generally desirable goal in the social sciences. This opinion stems from the apparently low general statistical power of social science research, an issue discussed later. Like the choice between a directional and nondirectional HI, the decision about a is supposed to be made before the data are collected. For example, if a = .01 but the estimated probability of the data under HQ is .03, one is supposed to fail to reject HQ. However, the temptation to increase (X (or cc*) from .01 to .05 to reject HQ may be strong in this case. Increasing a based on the data is another form of statistical sin that occurs in the real world. Statistical Tests The most widely used test statistics in the social sciences are probably the £, F, and %2 statistics, but there are many others. Although different in their applications, assumptions, and distributions, all such tests do basically the same thing: A result is summarized with a sample statistic. The difference between the statistic and the value of the corresponding population parameter(s) specified in the null hypothesis is compared against an estimate of sampling error. A computer program for general statistical analyses will convert test statistics to probabilities based on the appropriate theoretical central test distribution. These probabilities are often printed in program output under the column heading p, which is the same abbreviation used in many journal articles. One should not forget that p actually stands for the conditional probability p (Data | H0 true) which should be understood as the likelihood of the sample result or one even more extreme assuming the null hypothesis is true. Both p and a are derived in the same sampling distribution and are properly interpreted as long-run, relative-frequency probabilities. Unlike a, however, p is not the conditional prior probability of a Type I error because it is computed for a particular sample result. To differentiate the two probabilities, Gigerenzer
40
FUNDAMENTAL CONCEPTS
(1993) referred to p as the exact level of significance. If this exact significance level is less than the conditional prior probability of a Type I error (p < a), then HO is rejected and the result is considered statistically significant at that level of a. If a = .05 and p = .032, for example, then H0 is rejected, the result is taken as statistically significant at the .05 level, and its exact level of statistical significance is .032. It can be shown that many test statistics can be expressed as the product Test statistic = / (N) X ES index
(2.21)
where / (N) is a function of sample size for the particular test statistic and ES Index is an effect size index that expresses the degree of discrepancy between the data and HQ in a standardized metric (R. Rosenthal, 1994). Various standardized effect size indexes are introduced in later chapters, but for now consider two implications of this equation: 1. Holding sample size constant, the absolute values of test statistics generally increase with no upper bound and their p values approach zero as the effect size increases. 2. Holding constant a non-zero effect size, increasing the sample size causes the same change in test statistics and p values. These implications explain how it is possible for even trivial effects to be statistically significant in large samples. They also explain how even large effects may not be statistically significant in small samples. In other words, statistical significance does not imply that an effect is large, important, or even interesting. By the same token, one cannot conclude that the absence of statistical significance indicates a small or unimportant effect. That p values from statistical tests (a) are both conditional and longrun, relative-frequency probabilities and (b) measure sample size as well as effect size makes them apparently difficult to correctly interpret. Evidence that p values are in fact widely misunderstood in the behavioral sciences like psychology is considered in the next chapter.
POWER Power is the conditional prior probability of making the correct decision to reject HQ when it is actually false, or Power = p (Reject H0 | H0 false)
(2.22)
A Type II error, on the other hand, occurs when the sample result leads to the failure to reject H0 when it is actually false. The probability of INTRODUCTORY CONCEPTS
41
a Type II error is usually represented by P, and it is also a conditional prior probability: (3 = p (Fail to reject H0 | H0 false)
(2.23)
Because power and (3 are complementary, or Power + P = 1.00
(2.24)
whatever increases power decreases the probability of a Type II error and vice versa. Summarized next are factors that affect the power of statistical tests: 1. The lower the level of (X, the lower is power. Thus, reducing the chance of a Type I error increases the likelihood of a Type II error. However, there are other ways to increase power besides increasing a. 2. Power is greater in larger samples. This fact is demonstrated below for the test statistics t, F, and %2. 3. Power is greater when H\ is directional and the population effect is in the same direction. If the two disagree, however, power is essentially zero. 4. Study design: (a) Correlated designs are generally more powerful than independent-samples designs. Blocking designs and covariate analyses may also increase power, (b) Balanced designs are generally more powerful than unbalanced designs, (c) Tests for effects of fixed factors are usually more powerful than tests for effects of random factors. 5. Power declines as the reliability of the scores in a particular sample is lower. With lower score reliability comes higher error variance, which makes it more difficult to detect a real effect. 6. Parametric tests such as t and F are generally more powerful than nonparametric tests. See Siegel and Castellan (1988) for information about nonparametric tests. 7. In general, the larger an effect in the population for a given design, the easier it is to detect in samples. However, the magnitude of the real effect that can theoretically be observed is somewhat under the control of the researcher. For example, a longer, more intense intervention may potentially have a larger effect than a shorter, less intense intervention. A power analysis gives the probability of rejecting HQ. There are two kinds. An a priori power analysis is conducted before the data are collected. It involves (a) specification of the study's planned characteristics, such as
42
FUNDAMENTAL CONCEPTS
the level of a and the sample size; and (b) estimation of the expected magnitude of the population effect. The latter may be based on theory, results of previous empirical studies, or an educated guess. If the researcher is uncertain about the population effect size, power can be calculated for a range of estimates. A variation is to specify a desired level of power and then estimate the minimum sample size needed to obtain it. A post hoc power analysis is conducted after the data are collected. The observed effect size is treated as the population effect size, and the probability of rejecting the null hypothesis given the study's characteristics is estimated. However, a post hoc analysis that shows low power is more like an autopsy than a diagnostic procedure. That is, it is better to think about power before it is too late. In the past, researchers conducted power analyses by consulting special tables presented in sources such as J. Cohen (1988). Now there are several computer programs for power analysis on personal computers. Some of these programs, such as the Power Analysis module of STATISTICA, use noncentral test distributions, which are generally necessary for correct power estimates. Power analysis programs assume the user knows something about the effect size indexes described in later chapters. Estimated power levels no higher than .50 are problematic. If power is only .50, the probability of rejecting HQ when it is false is no greater than guessing the outcome of a coin toss. In fact, tossing a coin instead of actually conducting a study would be just as likely to give the correct decision and would save time and money, too (F. Schmidt & Hunter, 1997). Unfortunately, the results of several reviews indicate that the typical power of social science research may be no greater than about .50 (e.g., Sedlmeier & Gigerenzer, 1989). When power estimates are broken down by whether estimated effect sizes are small, medium, or large—specific definitions of these adjectives are given in chapter 4—their values are about .20, .50, and .80, respectively. Power for the study of large effects, .80, is certainly better than for the others listed but still results in a Type II error rate of 20%. Increasing sample sizes would address the problem of low power, but the number of additional cases necessary to reach even a power level of .80 when studying effects of small or medium magnitude may be so great as to be practically impossible (F. Schmidt, 1996). This is a critical limitation of NHST in the social sciences. The concept of power does not stand by itself without NHST. As statistical tests play a smaller role in our analyses, the relevance of power will also decline. If statistical tests are not used at all, the whole idea of power is meaningless. Besides, it is a stronger scientific result to observe the same effect at p < .10 across two different smaller samples than to find p < .05 in one larger sample.
INTRODUCTORY CONCEPTS
43
OVERVIEW OF SPECIFIC STATISTICAL TESTS Reviewed next are essential characteristics of three widely used test statistics in the behavioral sciences, the t and F statistics for means and the %2 statistic for two-way contingency tables. The F statistic is part of a family of techniques known as the analysis of variance (ANOVA), but note that the F statistic is not synonymous with ANOVA. That is, we can conduct an ANOVA without computing the F statistic, but not vice versa. It is reviewed only for designs with a single fixed factor, but its basic logic generalizes to other kinds of designs with continuous outcome measures (chapters 6 and 7). The t statistic is discussed only for designs with two conditions, such as treatment versus control. It is important for readers to know that the t, F, and %2 statistics are not reviewed for their own sakes. This is because they are subject to the general drawbacks of all NHST methods that are considered in the next chapter. These shortcomings are so serious that it is recommended that the continued use of statistical tests as the primary inference tool in the behavioral sciences is not acceptable. However, familiarity with the sample descriptive statistics that contribute to the t, F, and %2 statistics gives one a head start toward understanding effect size estimation. It is also possible in many cases to compute effect size indexes from these test statistics. Please also note that the sampling distributions of the t, F, and %2 tests described are, respectively, the central t, central F, and central %2 distributions in which the null hypothesis is assumed to be true. In later chapters readers will learn more about noncentral t and noncentral F distributions in which the null hypothesis is assumed to be false. These distributions are required for calculating exact confidence intervals based on certain kinds of standardized indexes of effect size.
t TESTS FOR MEANS The t tests reviewed compare means from either two independent or dependent samples. Both are actually special cases of the F test for means. Specifically, t2 = F when both statistics are computed for the same mean contrast for a nil hypothesis. The statistical assumptions of the t tests for independent versus dependent samples are the same as those of the corresponding F tests and are discussed later. The general form of the t statistic for a contrast between independent means is
44
FUNDAMENTAL CONCEPTS
where N - 2 is the pooled within-groups degrees of freedom (dfw), MI - M2 and SM -M are> respectively, the observed mean contrast and its standard error (Equation 2.8), and Hi - (J-2 is the population mean difference specified in the null hypothesis. If the latter is predicted to be zero, a nil hypothesis is tested; otherwise a non-nil hypothesis is tested. The t statistic for a dependent mean contrast has the same overall form:
where the degrees of freedom equal the group size (n) minus 1, MD and SM are, respectively, the observed average difference score and its standard error (Equation 2.14), and [ID is the population average difference score specified in the null hypothesis. For a nil hypothesis, (ip = 0, and this term drops out of the equation. Assuming a nil hypothesis, both forms of the t statistic defined earlier express a mean contrast as the proportion of its standard error. If t = 1.50, for example, the first mean is I1/! standard errors higher than the second, but note that the sign of t is arbitrary because it depends on the direction of subtraction between the two means. It is important to realize that the standard error metric of the C test is affected by sample size, which is demonstrated now. This is explained in Tables 2.1 and 2.2, described next. Table 2.1 presents the means and variances of two groups where MI — M2 = 2.00. Table 2.2 reports the results of the independent samples t test for the data in Table 2.1 at three different group sizes, n = 5, 15, and 30, for a nondirectional HI- (Readers are encouraged to reproduce these results.) Please note in Table 2.2 that the value of the pooled within-groups variance for these data, SP = 6.25, is unaffected by group size. This is not true for the standard error of MI - M2, which, as expected, gets smaller as n increases. This causes the value of t to go up and its probability to go down for the larger group sizes. Consequently, the t statistic for n = 5 does not indicate a statistically significant contrast at the .05 level, but it does for the two larger group sizes. Results for the latter indicate less expected sampling error, but not a
TABLE 2.1 Means and Variances for Two Independent Samples Group M s2
13.00 7.50
11.00 5.00
INTRODUCTORY CONCEPTS
45
TABLE 2.2 Results of the Independent Samples t Test for the Data in Table 2.1 at Three Different Group Sizes Group size (n) Statistic
5
15
30
SM^ - M2 t
1.58 1.26
.913 2.19
.645 3.10
df P fe-tail, .05
95% Cl for (I-, - \i2
8
28
58
.243 2.306 -1 .64-5.64
.037 2.048 .13-3.87
.003 2.002 .71-3.29
Note. For all analyses, M, - A4 = 2.00 and s£ = 6.25. Cl = confidence interval.
different or more substantial mean contrast. This reduction in sampling error is also evident in the 95% confidence intervals about the observed mean difference: Their widths decrease as n gets larger. The standard error metric of the t test is also affected by whether the means are independent or dependent. This is demonstrated next. Table 2.3 presents raw scores and descriptive statistics for a small data set where the observed mean difference is 2.00. Reported in Table 2.4 are the results of two different t tests and 95% confidence intervals for the data in Table 2.3. The first analysis assumes n = 5 cases in each of two unrelated samples, but second analysis assumes n = 5 pairs of scores across two dependent samples. Only the second analysis takes account of the positive cross-conditions correlation for these data, r12 = .735. Observe in Table 2.4 the narrower 95% confidence interval, the higher value of t, and its lower p value in the dependent samples analysis relative to the independent samples analysis of the same data.
TABLE 2.3 Raw Scores and Descriptive Statistics for Two Samples Condition
M s2
1
2
9
12 13 15 16
8 12 11 10 14
13.00 7.50
11.00 5.00
Note. In a dependent-samples analysis, r,2 = .735 and = sg = 3.50.
46
FUNDAMENTAL CONCEPTS
TABLE 2.4 Results of the Independent Samples t Test and the Dependent Samples fTest for the Data in Table 2.3 Analysis Independent samples Dependent samples
Standard error 1.58 .837
95% Cl for n, - n2
-1.64-5.64 .32-4.32
t
df a
1.26 2.38b
8 4
Note. Cl = confidence interval. For both analyses, M, - ftfe = 2.00. p = .243. "p = .076.
a
The results reported in Tables 2.2 and 2.4 show a special correspondence between 95% confidence intervals based on mean contrasts and results of the t test conducted with the same data at the .05 level for a nil hypothesis and a nondirectional alternative hypothesis: The confidence interval includes zero if HO is not rejected, but it does not include zero if H0 is rejected. This relation is not surprising because the same basic information that goes into a confidence interval goes into a statistical test. However, much of this information is hidden if all that is reported is a test statistic and its p value. A mathematically sophisticated reader may be able to construct a confidence interval from the test statistic by solving for the standard error, but simply reporting the confidence interval makes this information accessible to all. An important point should be made: Thompson (2002b) and others noted that it is erroneous to equate confidence intervals and statistical tests because of the special correspondence between them, mentioned previously. This is because the most informative use of confidence intervals compares them across different studies, not whether a particular interval includes zero. This most informative use concerns replication, something that results of statistical tests in a single study cannot address. The same author also makes the point that statistical tests cannot be conducted without a null hypothesis, but no hypothesis is required for a confidence interval. These ideas are elaborated in the next chapter.
F TESTS FOR MEANS The £ statistic compares only two means. Such contrasts are focused comparisons, and they address specific questions, such as whether treatment is superior to control. All focused comparisons are single-df, directional effects. The F statistic can also analyze focused comparisons—recall that t = F for a mean contrast. The F statistic, but not t, can also be used in omnibus comparisons, which simultaneously compare at least three means for equality. Suppose that factor A has a = 3 levels. The omnibus effect of INTRODUCTORY CONCEPTS
47
A has two degrees of freedom (d/A = 2), and the overall F test of this effect evaluates the following nil and nondirectional alternative hypotheses: H0: M-i = ^2 = 1^3
HI: |at * |X2 * |I3 G-e., not H0)
and
Rejecting HQ in favor of Hj for the previous example says only that the differences among the observed means MI, M2, and Mj are unlikely assuming equal population means. This result alone is often not very informative. That is, a researcher may be more interested in a series of focused comparisons, such as the contrast of the first level of A with the second (e.g., HQ: (J,i = JJ-2. HI: Hi > (^2 )> which break down the omnibus effect into specific directional effects. Accordingly, it is common practice to either follow an omnibus comparison with focused comparisons or forego the omnibus comparison and analyze only focused comparisons. The logic of F as a test statistic for the omnibus comparison in a design with a single fixed factor A with two or more levels is explained next. There are separate sections about omnibus F statistics for designs with independent samples and for designs with dependent samples. The presentations for correlated designs are more technical. However, readers interested in methods for independent samples can skip the sections about correlated designs without difficulty. Independent Samples F Test The general form of the F statistic for the omnibus effect in a singlefactor design with independent samples is P (dfA, dfw) =
(2.27)
where d//\ and d/\y are, respectively, the degrees of freedom for the numerator and denominator of F. The former equals the number of levels of factor A minus one, or d/^ = (a -1), and the latter is the total within-groups degrees of freedom, or a
a
dfw= £$= I ("i-D = N - a i= 1
(2.28)
i= 1
The numerator of F is the between-conditions (groups) mean square. Its equation is
i>(M,-M T ) 2 =^ =— ; 48
FUNDAMENTAL
CONCEPTS
(2.29)
where $SA is the between-conditions sum of squares, n,- and MJ are, respectively, the size and mean of the zth condition, and Mj is the mean for the total data set. The latter is the grand mean, the average of all N scores. The value of MT can also be computed as the weighted average of the condition means or only in a balanced design as the arithmetic average of the condition means. Please note in this equation that group size contributes only to the numerator of the between-conditions variance, SS^- The implication of this fact is demonstrated next. The numerator of F, MS^, reflects group size and sources of variability that give rise to unequal group means, such as a systematic effect of factor A or sampling error. It is the error term (denominator) of F, the pooled withinconditions mean square MS^, that measures only unexplained variance. This is because cases within the same condition are treated alike, such as when patients in a treatment group are all given the same dosage of the same drug. Because drug is a constant for these patients, it cannot account for individual differences among them. The equation for the error term is
"X /C1
^^W
Z d/< 7 = 5.50. The dependence of M$A and F on group size is obvious: Both increase along with the group size, which also progressively lowers the probability values for F from p = .429 for n = 5 to p = .006 for n = 30. This change in p values occurs even though the group means and variances are constant across all analyses.
INTRODUCTORY CONCEPTS
49
TABLE 2.5 Means and Variances for Three Independent Samples Group
M s2
13.00 7.50
11.00 5.00
12.00 4.00
TABLE 2.6 Results of the Independent Samples FTest at Three Different Group Sizes for the Data in Table 2.5 df
MS
2 12 14
5.00 5.50
.91a
2 42 44
15.00 5.50
2.73b
30.00 5.50
5.45C
SS
Source
n =5
Between (A) Within (error) Total
10.00 66.00 76.00
Between (A) Within (error) Total
30.00 231 .00 261.00
Between (A) Within (error) Total
60.00 478.50 538.50
n= 15
n = 30
a
p = .429.
b
p = .077.
2 87 89
c
p = .006.
Weighted- Versus Unweighted-Means Analysis The standard F statistic described earlier is used in a weighted'means analysis. This is because the squared deviation of each condition mean from the grand mean is weighted by group size when MS^, the numerator of F, is computed (Equation 2.29). If the design is unbalanced, the means from the bigger groups get a larger weight. This is not a problem if unequal study group sizes reflect unequal population group sizes. An unweighted-means analysis may be preferred if unequal group sizes are a result more of sampling artifacts. All means are given the same weight in this method. This is accomplished by (a) computing the grand mean as the arithmetic average instead of the weighted average of the group means and (b) substituting an average group size for the actual group sizes in the equation for M$A- This average group size is the harmonic mean:
50
FUNDAMENTAL
CONCEPTS
—
(2.31)
1/n, i= 1
where n.j is the actual size of the ith group. Note that a weighted-means analysis and an unweighted-means analysis generate the same value of F in a balanced design. Assumptions of the Independent Samples F Test It is stated in many introductory statistics textbooks that the assumptions of the F test in designs with independent samples and fixed factors include independence of the observations, normal population distributions, and equal population variances. The latter is the assumption of homogeneity of variance, and it is necessary whenever error terms include variances averaged across different conditions (e.g., Equation 2.30). However, there are related requirements that may not be explicitly stated in introductory textbooks. These include the requirements that all levels of each fixed factor are included in the experiment and that treatments are additive and have no affect on the shapes or variances of population treatment distributions (Winer, Brown, & Michels, 1991). If a treatment is studied that is expected to affect both the average level and variability of cases, the latter requirement may be violated. Altogether these requirements are more restrictive than many researchers realize. The p values from the F test are computed under these assumptions. If these assumptions are violated, then the p values of these tests—and decisions based on them, namely whether to reject HQ—may not be accurate. If observed p values wind up being too low because of violation of assumptions, there is a positive bias because Hg is rejected more often than it should. In the RS context for statistical tests, this implies that the researcher's hypothesis is supported more often than it should be. It can also happen that observed p values can be too high because of violation of assumptions, which may reduce power. There is a relatively large literature about the consequences of violating the assumptions of statistical tests in general and the F test in particular in fixed-effects ANOVA. It is beyond the scope of this section to review this literature in detail, so only an overview is presented; readers are referred to Winer et al. (1991, pp. 100-110) and a review article by Glass, Peckham, and Sanders (1972) for more information. The independence assumption is critical because nonindependence can seriously affect both p values and power regardless of whether the group sizes are equal or unequal. This requirement should generally be seen as an essential property of the research
INTRODUCTORY CONCEPTS
51
design. It was believed that the normality assumption is generally unimportant in that it can be violated with relative impunity with little effect on p values or power. It was also believed that the F test is relatively insensitive to variance heterogeneity. However, recent work by Wilcox (1987, 1998) and others indicate that (a) even relatively small departures from normality can sometimes distort the results of the standard t or F tests; (b) there can be serious positive bias in these tests when the ratio of the largest over the smallest within-groups variance is 9 or greater; and (c) the degree of inaccuracy in p values may be greater when the group sizes are small and unequal or when heterogeneity is associated with one outlier group than when it is spread across all the groups (Keppel, 1991). There are versions of both the t and F tests for independent samples that do not assume normality or homogeneity of variance (e.g., Winer et al., 1991, pp. 66-69; Wilcox, 1987), but they are not used nearly as often as the standard t and F tests based on these assumptions. Reviewed in the next chapter is evidence that the assumptions of t, F, and other statistical tests seem to be infrequently met or evaluated in applied behavioral research. This is another serious shortcoming of the use of statistical tests in the behavioral sciences. Dependent Samples F Test The between-conditions variance, M$A, and the pooled within-conditions variance, MS^, are computed the same way regardless of whether the samples are independent or dependent (Equations 2.29-2.30). However, the latter no longer reflects just unexplained variance when the samples are dependent, so it is not the error term for the omnibus F statistic in a correlated design. This is because of the subjects effect, which in a oneway design is manifested in positive covariances between every pair of conditions. When the independent variable has three or more levels, the average covariance across all pairs of conditions, Mcov, estimates the subjects effect for the whole design. Removing this effect from the pooled withinconditions variance (literally, MS^ - MCMI) gives the error term for F in a one-way design with dependent samples. This error term reflects inconsistent performance across the conditions. This inconsistency may be a result of random variation or to a nonadditive effect, which means that the independent variable does not have the same relative impact on all cases. In other words, there is some characteristic of participants that moderates the effect of factor A, either amplifying or diminishing it. For example, a drug may be more effective for older patients than younger patients. This moderator effect is also known as a person X treatment interaction. In an additive model, which assumes no true person X treatment interaction, the error term of the dependent samples F statistic is presumed to
52
FUNDAMENTAL CONCEPTS
reflect only random error. In some sources, this error term is designated as MSres, where the subscript refers to residual variance. However, an additive model is probably unrealistic for many within-subjects factors in the behavioral sciences. A nonadditive model assumes a true person x treatment interaction, and the error term in this model may be called MSA x s. where the subscript reflects this assumption. This notation is used later. Unfortunately, it is not possible to separately estimate variability because of random error versus a true person X treatment interaction when each case is measured once in each condition, which is typical in one-way within-subjects designs. This implies that MSres = MSA x s in the same data set, so the distinction between them is more conceptual than practical. Cases in which the assumption of additive versus nonadditive models makes a difference in effect size estimation are considered in chapter 6. We can now define the general form of the omnibus F test for singlefactor designs with dependent samples assuming a nonadditive model: (2-32)
where d/A *§ = (a - 1) (n — I) and MSAx s = MS^ - Mcov. The latter can also be expressed as
xs
SS A x S SSW - SSS = -7- = ~T - ~J
,- --, (2.33)
where SS$ is the sum of squares for the subjects effect with dfa = n — 1 degrees of freedom. Equation 2.33 shows the removal of the subjects effect from the pooled within-conditions variability in a correlated design, which is the same basic subtraction that generates the error term of the dependent samples t statistic (Equation 2.15). Equation 2.33 also shows the decomposition of the total within-conditions sums of squares into two parts, one because of the subjects effect and the other associated with the error term, or oiw = Sjj + 3oA x 5. The F test for dependent samples has the same potential power advantage over the F test for independent samples as the t test for dependent samples has over its independent samples counterpart. This is demonstrated with the data for three samples presented in Table 2.7. The results of two different F tests conducted with these data are reported in Table 2.8. The first analysis assumes n = 5 cases in each of three independent samples, and the second analysis assumes n = 5 triads of scores across three dependent samples. Only the second analysis takes account of the positive correlations between each pair of conditions, which range from .730 to .839 (Table 2.7). INTRODUCTORY CONCEPTS
53
TABLE 2.7 Raw Scores and Descriptive Statistics for Three Samples Condition
M s2
1
2
3
9 12 13 15 16
8 12 11 10 14
10 11 13 11 15
13.00 7.50
11.00 5.00
12.00 4.00
Note. In a dependent samples analysis, r12 = .735, r13 = .730, and r23 = .839.
Observe the higher F and lower p values for the dependent samples analysis even though the group means and variances are constant. Assumptions of the Dependent Samples F Test The same assumptions of the independent samples F test— independence, normality, and homogeneity of variance—apply to the dependent samples F test. However, there are additional assumptions that concern the correlations between multiple measures obtained from the same cases (or sets of matched cases). When a within-subjects factor has at least three levels, these assumptions are relatively complicated and quite difficult to meet in practice. An additional requirement is that of sphericity or circular' ity, which assumes that the population variances of the difference scores between every pair of conditions are equal. This assumption is critical TABLE 2.8
Results of the Independent Samples FTest and the Dependent Samples FTest for the Data in Table 2.7 SS
Source Between (A) Within (error) Total Between (A) Within Subjects (S) Ax S (error) Total a
p = .429.
54
df
MS
F
Independent samples analysis 10.00 2 66.00 12 76.00 14
5.00 5.50
.91 a
Dependent samples analysis 10.00 2 66.00 12 54.67 4 11.33 8 76.00 14
5.00 5.50 13.67 1.42
3.53b
b
p = .080.
FUNDAMENTAL CONCEPTS
because even relatively minor violations of this assumption may lead to rejecting HQ too often (i.e., resulting in a positive bias). There are statistical tests intended to detect departure from sphericity, but they have been criticized for restrictive assumptions of their own, such as normality. Some methodologists suggest that the sphericity requirement may not be tenable in most behavioral studies and that researchers should direct their efforts to controlling bias (Keppel, 1991). There are basically five options for dealing with the sphericity assumption that are briefly summarized next; see H. Keselman, Algina, and Kowalchuk (2001), Max and Onghena (1999), or Winer et al. (1991, pp. 239-273) for more information: 1. Assume maximal violation of sphericity, compute F in the usual way, but compare it against a higher critical value. This critical F has only 1 and n - 1 degrees of freedom; the standard critical F for comparing a dependent means has a - 1 and (a- 1) (n- 1) degrees of freedom. This method has been called the Geisser-Greenhouse conservative test or the GeisserGreenhouse correction. 2. Estimate the degree of departure from sphericity with a statistic called estimated epsilon, £. This statistic ranges from l/(a — 1), which indicates maximal departure to 1.00, which in turn indicates no violation of sphericity. The degrees of freedom for the critical value for F are then taken as e (a - 1) and e (a - l)(n - 1), which makes the test more conservative for < 1.00. There are somewhat different forms of 8 that may be called the Box correction, the Geisser-Greenhouse epsilon, or the Huynh-Feldt epsilon. 3. Conduct focused comparisons between pairs of condition means instead of the omnibus comparison This implies that each contrast has its own specialized error term (i.e., it is not MSAxS f°r the whole design). Because these unique error terms are based on data from only two conditions, the sphericity requirement does not apply. 4. Analyze data from all levels of the factor with multivariate analysis of variance (MANOVA), which also does not assume sphericity. In this approach, difference scores between adjacent levels of factor A are analyzed as multiple, correlated outcome variables (e.g., Stevens, 1992, chap. 13). 5. Use the statistical resampling method of bootstrapping to generate an empirical F test for repeated measures data. (Bootstrapping as an alternative to traditional statistical tests is discussed in chapter 9, this volume). In a recent Monte Carlo analysis, Berkovits, Hancock, and Nevitt (2000) found that
INTRODUCTORY CONCEPTS
55
this method is relatively robust against violation of the sphericity assumption. All of these options are concerned in large part with the estimation of accurate p values in correlated designs. Considering the limitations of p values outlined in the next chapter, perhaps an even better choice is to move away from traditional statistical tests to model-fitting techniques suitable for repeated-measures data, such as structural equation modeling or hierarchical linear modeling, among others. This point is elaborated later. Analysis of Variance as Multiple Regression All forms of ANOVA are nothing more than special cases of multiple regression (MR), which itself is just an extension of bivariate regression that analyzes one or more predictors of a continuous dependent variable. These predictors can be either continuous or categorical variables. Categorical predictors are represented in regression equations with special codes that each correspond to a single df contrast (i.e., a focused comparison) between the levels of that predictor. It is also possible in MR to estimate interaction effects between continuous or categorical predictors. In theory, one needs only a software program for MR to conduct any kind of ANOVA. The advantage of doing so is that the output of regression programs usually includes correlations, partial correlations, or standardized regression coefficients (beta weights), all of which are standardized measures of effect size. In contrast, software programs for ANOVA may print only source tables, and the F and p values in these tables measure both effect size and sample size (e.g., Table 2.6). The disadvantage of using MR programs instead of ANOVA programs is that the coding required for some kinds of designs, especially ones with repeated-measures factors, can become complicated. In contrast, ANOVA programs are typically easier to use because no special coding of the factors is required by the user. Fortunately, there are some straightforward ways to extract information about effect size from ANOVA source tables that are demonstrated in later chapters. Entire books are written about the relation between ANOVA and MR (e.g., Keppel & Zedeck, 1989), so it is not possible to deal with this issue in substantive detail. However, readers should be aware of this alternative to using ANOVA to analyze means and estimate effect size.
X2 TEST OF ASSOCIATION Whether there is a statistical relation between two categorical variables is the question addressed by the %2 test of association. A two-way contingency
56
FUNDAMENTAL CONCEPTS
TABLE 2.9 Results of the Chi-Square Test of Association for the Same Proportions at Different Group Sizes Outcome Observed Frequencies Group
n
Recovered
Not recovered
Recovery rate
xMD
Treatment Control Total
40 40 80
24 16 40
16 24 40
.60 .40
3.20a
Treatment Control Total
80 80 160
48 32 80
32 48 80
.60 .40
6.40b
n = 80
a
p=.074.
b
p=.011.
table summarizes the data analyzed by this test. Presented in the top half part of Table 2.9 is a 2 X 2 cross-tabulation that shows the frequencies of treatment and control cases (n = 40 each) that either recovered or did not recover. A total of 24 cases in the treatment group recovered, or 60%. Among control cases, 16 cases recovered, or 40%. The recovery rate among treated cases is thus 20% higher than among untreated cases. The %2 test of association for two-way contingency tables takes the form (f
_f
\2
1 = 1 j = 1 ^V^ ,j Je
where the degrees of freedom are the product of the number of rows (r) minus one and the number of columns (c) minus one, /0 is the observed frequency for the cell in the ith row and jth column, and /e.. is the expected frequency for the same cell under the nil hypothesis that the two variables are unrelated. There is a quick way to derive by hand the value of /e for any cell: Divide the product of the row and column totals for that cell by the total number of cases, N. It is that simple. The statistical assumptions of the % test of association include independence of the observations, classification of each observation into one and only one category (i.e., contingency table cell), and a sample size large enough so that the minimum expected value across the cells is about 5 for tables with more than a single degree of freedom or about 10 for tables with a single degree of freedom. For the 2x2 cross-tabulation in the top half of Table 2.9, the expected frequency for each cell is/e = (40 X 40)/80 = 20. This shows a pattern where
INTRODUCTORY CONCEPTS
57
outcome is unrelated to treatment status because the expected recovery rate is the same for both groups, 50% (20/40). After application of this equation, the results are %2 (1) = 3.20, p = .074, so the nil hypothesis that group membership and recovery status are unrelated is not rejected at the .05 level. The effect of increasing the group size but keeping all else constant on the X2 test is demonstrated in the bottom part of Table 2.9. Reported there are results of the /2 test for the same proportions but a larger group size, n = 80. The null hypothesis is now rejected at the .05 level—%2 (1) = 6.40, f> = .011—even though the improvement in recovery rate for treated versus control cases is unchanged, 20%. Other common applications of the %2 test not described include a goodness-of-fit test for categorical variables and a test for correlated proportions, among others. All tests just mentioned are also sensitive to sample size. STATISTICAL TESTS AND REPLICATION Statistical tests provide a framework for making a dichotomous decision—reject or fail to reject HQ—about sample results in the face of uncertainty. This uncertainty is sampling error, which is estimated in some way by essentially all statistical tests. Of course, any decision based on a statistical test may not be correct (e.g., a Type I or Type II error). In any science, though, it is replication that is the ultimate arbiter: No matter how intriguing a result from a single study, it must be replicated before it can be taken seriously. Replication also is the ultimate way to deal with the problem of sampling error. Indeed, statistical tests are unnecessary with sufficient replication. There is a much stronger tradition of replication in the natural sciences than in the social sciences. It is also true that statistical tests are infrequently used in the natural sciences. Whether this association is causal is a matter of debate. Some authors argue that the widespread use of statistical tests in the social sciences works against the development of a stronger appreciation for replication (e.g., Kmetz, 2000; F. Schmidt & Hunter, 1997). There are probably other factors that contribute to the difference in emphasis on replication across the social and natural sciences (Kupfersmid, 1988), but the possibility that statistical tests is one of them warrants careful consideration. Replication and meta-analysis as a method for research synthesis are considered in chapter 8. CONCLUSION Outlined in this chapter is a basic vocabulary for comparative studies and the logic of interval estimation for statistics with simple distributions,
58
FUNDAMENTAL CONCEPTS
such as means, versus those with complex distributions, such as some effect size indexes. Confidence intervals for the former are constructed with central test statistics, but the latter may require noncentral test statistics. Special software tools are also typically needed for noncentral confidence intervals. A confidence interval based on a statistic sets a reasonable lower and upper bounds for the corresponding population parameter, but there is no guarantee that the value of the parameter is included in a particular confidence interval. The essential logic of statistical tests in general and characteristics of the t and F tests for means and the %2 test for two-way contingency tables in particular was also reviewed. Any statistical test measures both effect size and sample size. This is why neither the values of test statistics or their associated probabilities say much useful about effect size. Additional limitations of statistical tests are considered in the next chapter.
RECOMMENDED READINGS Gumming, G., & Finch, S. (2001). A primer on the understanding, use, and calculation of confidence intervals that are based on central and noncentral distributions. Educational and Psychological Measurement, 61, 532-574Reichardt, C. S., & Gollob, H. F. (1997). When confidence intervals should be used instead of statistical tests, and vice versa. In L. L. Harlow, S. A. Mulaik, & J. H. Steiger (Eds.), What if there were no significance tests? (pp. 37-64). Mahwah, NJ: Erlbaum. Smithson, M. J. (2000). Statistics with confidence: An introduction for psychologists. Thousand Oaks, CA: Sage.
INTRODUCTORY CONCEPTS
59
3 WHAT'S WRONG WITH STATISTICAL TESTS— AND WHERE WE GO FROM HERE
Statistics is a subject of amazingly many uses and surprisingly few effective practitioners. —B. Efron and R. Tabshirani (1993, p. xiv)
This chapter considers problems with null hypothesis significance testing (NHST). The literature in this area is quite large. D. Anderson, Burnham, and W. Thompson (2000) recently found more than 300 articles in different disciplines about the indiscriminate use of NHST, and W. Thompson (2001) lists more than 400 references about this topic. As a consequence, it is possible to cite only a few representative works. General reviews of the controversy about NHST in the social sciences include Borenstein (1998), Nickerson (2000), and Nix and Barnette (1998). Examples of works more critical of NHST include J. Cohen (1994); Gigerenzer (1998a, 1998b); Gliner, Morgan, Leech, and Harmon (2001); and Kruegar (2001), and examples of works that defend NHST include Abelson (1997a, 1997b); Chow (1998a, 1998b); Harris (1997c); and Mulaik, Raju, and Harshman (1997). After review of the debate about NHST, I argue that the criticisms have sufficient merit to support the minimization or elimination of NHST
The author wishes to thank Richard S. Herrington, as well as the anonymous reviewers, for suggestions in this chapter.
61
in the behavioral sciences. I offer specific suggestions along these lines. Some concern alternatives that may replace or supplement NHST and thus are directed at researchers. Others concern editorial policies or educational curricula. Few of the recommendations given are original in that many have been made over the years by various authors. However, as a set they deal with issues often considered in separate works. For simplicity, the context for NHST assumed is reject—support (RS) instead of accept—support (AS). The RS context is more common, and many of the arguments can be reframed for the AS context. Exercises for this chapter can be found on this book's Web site.
NHST OUTCOMES ARE INTERPRETED AS SOMETHING THEY ARE NOT People are by nature good at pattern recognition. We find evidence for this in almost every aspect of human life, whether it is the apparently innate preference of infants for visual stimuli that resemble a human face or the use of language by adults to construct a social reality. There are probably deep evolutionary roots of our ability to find meaning in the world around us. This ability is also at the core of some personality theories. For instance, Rollo May (1975) wrote, Creative people ... do not run away from non-being, but by encountering and wrestling with it, force it to produce being. They knock on silence for answering music; they pursue meaninglessness until they force it to mean. (p. 93)
Our pattern recognition ability is so well-developed that sometimes we see too much meaning in otherwise random events. Sagan (1996) described several examples, including one that involved an early satellite photo of a hill in a place called Cydonia on Mars that resembles a human face. Some people took this formation as evidence for a vanished civilization. Later satellite images of the same hill showed pretty clearly that it was carved by natural forces such as wind erosion, but the tendency to see something recognizable in randomness is strong. By virtue of their training or personal dispositions, scientists may be extraordinarily good at pattern recognition, which also makes them subject to the potential error of seeing too much meaning in certain events. This seems to be true about NHST, because many common fallacies about it involve exaggerating what can be inferred from statistical tests. These incorrect inferences may be a source of cognitive misdirection that hinders progress in behavioral research.
62
STATISTICAL TESTS
Misinterpretations of p Values Next we consider common misunderstandings about the probabilities generated by statistical tests, p values. Let us first review their correct interpretation. Recall that statistical tests measure the discrepancy between a sample statistic and the value of the population parameter specified in the null hypothesis, HQ, taking account of sampling error. The empirical test statistic is converted to a probability within the appropriate central test distribution. This probability is the conditional probability of the statistic assuming H0 is true (see chap. 2, this volume). Other correct interpretations for the specific case p < .05 include the following: 1. The odds are less than 1 to 19 of getting a result from a random sample even more extreme than the observed one when HO is true. 2. Less than 5% of test statistics are further away from the mean of the sampling distribution under H0 than the one for the observed result. 3. Assuming H0 is true and the study is repeated many times, less than 5% of these results will be even more inconsistent with HO than the observed result. That is about it. Other correct definitions may be just variations of those listed. The range of correct interpretations of p values is thus actually quite narrow. Let us refer to any correct definition as p (D | HO), which emphasizes probabilities from statistical tests as conditional probabilities of the data (D) given the null hypothesis. Presented next are common misinterpretations for the case p < .05. Some of them arise from forgetting that p values are conditional probabilities or reversing the two events represented by p values, D and H0. Reasons why each is incorrect are also given below: Fallacy Number I A p value is the probability that the result is a result of sampling error; thus, p < .05 says that there is less than a 5% likelihood that the result happened by chance. This false belief is the odds-against'chance fantasy (Carver, 1978). It is wrong because p values are computed under the assumption that sampling error is what causes sample statistics to depart from the null hypothesis. That is, the likelihood of sampling error is already taken to be 1.00 when a statistical test is conducted. It is thus illogical to view p values as measuring the probability of sampling error. This fantasy together with others listed later may explain the related fallacy that statistical tests
INTRODUCTORY CONCEPTS
63
sort results into two categories, those a result of chance (Ho is not rejected) and others a result of "real" effects (Ho is rejected). Unfortunately, statistical tests applied in individual studies cannot make this distinction. This is because any decision based on NHST outcomes may be wrong (i.e., a Type I or Type II error). Fallacy Number 2
A p value is the probability that the null hypothesis is true given the data; thus, p < .05 implies p (Ho | D) < .05. This is the inverse probability error (J. Cohen, 1994) or the Bayesian Id's wishful thinking error (Gigerenzer, 1993), and it stems from forgetting that p values are conditional probabilities of the data, or p (D \ HO), and not of the null hypothesis, or p (Ho | D). The latter is the posterior probability of the null hypothesis in light of the data, and it is probably what researchers would really like to know. A simplified form of Bayes's theorem shows us that p (D | HQ) from a statistical test and the posterior probability of the null hypothesis are in fact related:
i>(H 0 )p(D|H 0 )
p(H0|L>)- -
J-
(3.1)
In Equation 3.1, p (Ho) is the prior probability that the null hypothesis is true before the data are collected, and p (D) is the prior probability of the data irrespective of the truth of the null hypothesis. That is, given the p value from a statistical test along with estimates of p (Ho) and p (D), we could derive with this equation p (Ho | D), the posterior probability of the null hypothesis. Unfortunately, those who use traditional statistical tests do not usually think about prior probabilities. If pressed to specify these values, they may venture a guess, but it may be viewed as subjective. In contrast, a Bayesian approach specifically estimates the posterior probability of the hypothesis, not just the conditional probability of the data under that hypothesis. There are also ways to estimate prior probabilities that are not wholly subjective. Chapter 9 considers the Bayesian approach to hypothesis testing. Fallacy Number 3
If the null hypothesis is rejected, p is the probability that this decision is wrong; thus, if p < .05, there is less than a 5% chance that the decision to reject the null hypothesis is a Type I error. This fallacy is another kind of inverse probability error that Pollard (1993) described as confusing the conditional prior probability of a Type I error, or a = p (reject H0 1 H0) 64
STATISTICAL TESTS
with the conditional posterior probability of a Type I error given that the null hypothesis was rejected, or: p (H01 reject H0) Pollard uses Bayes's theorem to show it is not generally possible to estimate p (Ho | reject HO) from a. On a more intuitive level, the decision to reject the null hypothesis in an individual study is either correct or incorrect, so no probability is associated with it. Only with sufficient replication could we discern whether a specific decision to reject HQ was correct. Fallacy Number 4 The complement of p, 1 - p, is the probability that the alternative hypothesis is true given the data, or p (Hi | D). Thus, p < .05 says that the likelihood that HI is true is greater than 95%. This erroneous idea is the validity fallacy (Mulaik et al., 1997) or the valid research hypothesis fantasy (Carver, 1978). The complement of p is a probability, but it is just the likelihood of getting a result even less extreme under HQ than the one actually found. Accordingly, complements of p have nothing directly to do with the posterior probability of HI. Fallacy Number 5 The complement of p is the probability that a result will replicate under constant conditions; thus, p < .05 says that the chance of replication exceeds 95%. This is the repUcability or repeatability fallacy (Carver, 1978). Another variation for p < .05 is that a replication has a 95% probability of yielding a statistically significant result, presumably in the same direction as in the original study. If this fallacy were true, knowing the probability of finding the same result in future replications would be very useful. Alas, a p value is just the probability of a particular result under a specific hypothesis. As noted by Carver, replication is a matter of experimental design and whether an effect actually exists in the population. It is thus an empirical question for future studies and not one directly addressed by statistical tests in a single study. Readers should note, however, that there is a sense in which p values concern replication. Greenwald, Gonzalez, Harris, and Guthrie (1996) made the point that p values in an original study are monotonically related to the statistical power of replications. A monotonic relation is typically ordinal or nonlinear; thus, there is not a uniform correspondence between p values and the probabilities of null hypothesis rejections in replications. Specifically, without special graphs like ones presented by Greenwald et al., one cannot directly convert a p value to the likelihood of repeating a null INTRODUCTORY CONCEPTS
65
hypothesis rejection. This is a subtle point. It is probably best to keep in mind that p values have little to do with replication in the usual scientific sense. Mistaken Conclusions After Making a Decision About the Null Hypothesis There are also many false conclusions that may be reached after deciding to reject or fail to reject HO based on p values. Most require little explanation about why they are wrong: Fallacy Number 1 A p value is a numerical index of the magnitude of an effect; thus, low p values indicate large effects. This misconception could be called the magnitude fallacy. Smaller p values indicate lower conditional probabilities of the data, given the required assumption that the null hypothesis exactly describes the population (J. Cohen, 1994), but that is about all that can be said without other kinds of analyses such as effect size estimation. This is because statistical tests and their p values measure sample size and effect size (e.g., Table 2.2), so an effect of trivial magnitude needs only a large enough sample to be statistically significant. If the sample size is actually large, low p values just confirm a large sample, which is a tautology (B. Thompson, 1992). Now, results that are truly of large magnitude may also have low p values—it is just that one cannot tell much by looking at p values alone. Fallacy Number 2
Rejection of the null hypothesis confirms the alternative hypothesis and the research hypothesis behind it. This meaningfulness fallacy actually reflects two conceptual errors. First, the decision to reject H0 in a single study does not imply that HI is "proven." Second, even if the statistical hypothesis HI is correct, it does not mean that the substantive hypothesis behind it is also correct. For example, Arbuthnot (1710) studied the birth records for London for 82 consecutive years (1629-1710). More boys than girls were born every single year during this time. For example, in 1629 there were 5,218 registered births of boys compared with 4,683 births of girls. Based on all these data, Arbuthnot rejected the hypothesis that equal proportions of babies are boys versus girls. In modern terms, he rejected the non-nil hypothesis HQ: n = .50, where 71 is the population proportion of boys in favor of the directional alternative hypothesis HI: 71 > .50. However, Arbuthnot's substantive hypothesis was that because of divine providence, more boys are born to compensate for higher numbers of male deaths in
66
STATISTICAL TESTS
wars, accidents, and the like so that, in the end, "every Male may have a Female of the same Country and suitable Age" (1710, p. 188). Arbuthnot was correct about the statistical hypothesis HI, but his substantive hypothesis, although colorful, does not correspond to the actual underlying cause of unequal numbers of newborn boys versus girls: Sperm with Y chromosomes swim faster than those with X chromosomes and arrive in greater numbers to fertilize the egg. The distinction between statistical and substantive hypotheses is crucial. They differ not only in their levels of abstraction (statistical: lowest; scientific: highest), but also have different implications following rejection of HQ. If HO and HI reflect only statistical hypotheses, there is little to do after rejecting HQ except replication. However, if H! stands for a scientific hypothesis, the work just begins after HQ is rejected. Part of the work involves pitting the research hypothesis against other substantive hypotheses also compatible with the statistical hypothesis Hj. If these other hypotheses cannot be ruled out, the researcher's confidence in the original hypothesis must be tempered. It may also be necessary to conduct additional studies that attempt to falsify equivalent models. This is the strategy of strong inference (Platt, 1964). Fallacy Number 3 Failure to reject a nil hypothesis means that the population effect size is zero. This is not a valid inference for a few reasons. One is the basic tenet of science that absence of evidence is not evidence of absence. Also, the decision to fail to reject a nil hypothesis may be a Type II error. For example, there may be a real effect, but the study lacked sufficient power to detect it. Given the relatively low overall power of behavioral research, this is probably not an infrequent event. Poor research design or use of flawed measures can also lead to Type II errors. Fallacy Number 4 Failure to reject the nil hypothesis HQ: |l i = |I 2 means that the two populations are equivalent. Suppose that an established treatment known to be effective is compared with a new treatment that costs less. It is incorrect to conclude that the two treatments are equivalent if the nil hypothesis HQ: (J. i = (4,2 is not rejected. The inference of equivalence would be just as incorrect if this example concerned reliability coefficients or proportions in two groups that were not statistically different (Abelson, 1997a; B. Thompson, 2003). To rephrase the tenet cited earlier, the absence of evidence for differences is not evidence for equivalence. Proper methods for equivalence testing are described later.
INTRODUCTORY CONCEPTS
67
Fallacy Number 5 Rejecting the null hypothesis confirms the quality of the experimental design. Poor study design can create artifactual effects that lead to incorrect rejection of H0. Also, plain old sampling error can lead to Type I errors even in well-controlled studies. Fallacy Number 6
If the null hypothesis is not rejected, the study is a failure. This misconception is the mirror image of the preceding one. Although improper methods or low power can cause Type II errors, failure to reject H0 can also be the product of good science. For example, some claims based on initial studies are incorrect, which means that replication will lead to negative results. Readers may recall an announcement a few years ago by researchers who claimed to have produced cold fusion (a low energy nuclear reaction) with a relatively simple laboratory apparatus. Other scientists were unable to replicate the phenomenon, and the eventual conclusion was that the claim was premature (Taubes, 1993). Fallacy Number 7 Rejection of HO means that the underlying causal mechanism is identified. This misinterpretation is related to the ones discussed to this point. It should be obvious by now that a single HQ rejection does not prove a presumed causal effect represented by the statistical hypothesis HI. Fallacy Number 8
The failure to replicate is the failure to make the same decision about HO across studies. P. Dixon and O'Reilly (1999) refer to this idea as the reification fallacy. Under this sophism, a result is considered not replicated if HO is rejected in the first study but not in the second study. However, this view ignores sample size, effect size, and the direction of the effect across the two studies. Suppose a group mean difference is found in an initial study and a nil hypothesis is rejected. The exact same group mean difference is found in a replication study, but HO is not rejected because of a smaller sample size. We actually have positive evidence for replication even though different decisions about H0 were made across the two studies. Widespread Nature of Misinterpretations There is evidence that many of the false beliefs just described are common even among professional researchers and educators. For instance, Oakes (1986) asked 70 academic psychologists to state their usually adopted 68
STATISTICAL TESTS
TABLE 3.1 Usually Adopted Interpretations of p < .01 by 70 Academic Psychologists Statement 1. 2. 3. 4. 5. 6. 7.
The null hypothesis is absolutely disproved. The probability of the null hypothesis has been found. The experimental hypothesis is absolutely proved. The probability of the experimental hypothesis can be deduced. The probability that the decision taken is wrong is known. A replication has a .99 probability of being significant. The probability of the data given the null hypothesis is known.
f
%
1 32 2 30 48 24 8
1.4 45.7 2.9 42.9 68.6 34.3 11.3
Note. From Statistical Inference (p. 81), by M. Oakes, 1986, New York: Wiley. Copyright 1986 by John Wiley and Sons. Reprinted with permission.
interpretations of p < .01. The respondents could offer more than one interpretation. Of the seven statements listed in Table 3.1, only the last is correct, but just 8 of 70 participants (11%) reported it. Almost 50% endorsed statements 2 and 4 in the table that p values indicate the conditional probability of H0 (inverse probability error) or H\ (valid research hypothesis fallacy), respectively. The majority of the respondents said in error that p values are posterior probabilities of Type I error, and about one third said that the complements of p values indicate the likelihood of replication (repeatability fallacy). Lest one think that Oakes's results are specific to an unrepresentative group of NHST-challenged academic psychologists, results of other surveys of professionals or near-professionals in the social sciences indicate similar, apparently widespread misunderstandings (e.g., Mittag & B. Thompson, 2000; Nelson, R. Rosenthal, & Rosnow, 1986). Tversky and Kahneman (1971) described a kind of cognitive distortion among psychologists they called the belief in the law of small numbers. This belief holds that (a) even small samples are typically representative of their respective populations, and (b) statistically significant results are likely to be found in replication samples half the size of the original. The belief in the law of small numbers is probably just as widespread in other social science disciplines as in psychology. One also need not look very hard in published sources to find errors similar to those in Table 3.1. J. Cohen (1994) listed several distinguished authors who have made such mistakes in print, including himself. This book probably contains similar kinds of errors. Dar, Serlin, and Omer (1994) noted that several prominent psychotherapy researchers who published in some of the best peer-reviewed journals in this area made similar mistakes over a period of three decades. At first glance, this situation seems puzzling. After all, many academicians and researchers have spent hundreds of hours studying or teaching NHST in statistics courses at both the undergraduate
INTRODUCTORY CONCEPTS
69
and graduate levels. Why does this rather large investment of educational resources and effort not have more apparent success? Two factors warrant comment. The first is that NHST is not the most transparent of inference systems. Pollard and others noted that it is difficult to explain the logic of NHST and dispel confusion about it. Some of the language of NHST is very specific and unnatural. For example, the word significant implies in natural language that something is important, noteworthy, or meaningful, but not in NHST. There may also be inherent contradictions in the hybrid of the Fisher and Neyman-Pearson models on which contemporary NHST is based (P. Dixon & O'Reilly, 1999; Gigerenzer, 1993). Another problem is a general human weakness in reasoning with conditional probabilities, especially ones best viewed from a relative frequency perspective (e.g., J. Anderson, 1998).
NHST DOES NOT TELL US WHAT WE REALLY WANT TO KNOW Many of the fallacies about NHST outcomes reviewed concern things that researchers really want to know, including the probability that H0 or H! is true, the likelihood of replication, and the chance that the decision taken to reject HQ is wrong, all given the data. Using R to stand for replication, this wish list could be summarized as: p (H 0 1D), p (H! | D), p (R \ D), and p (H 0 1 Reject H0) Unfortunately, statistical tests tells us only p (D \ HO). As noted by J. Cohen (1994), however, there is no statistical technique applied in individual studies that can fulfill this wish list. (A Bayesian approach to hypothesis testing is an exception; see chap. 9, this volume.) However, there is a method that can tell us what we really want to know, but it is not a statistical technique; rather, it is replication, which is not only the best way to deal with sampling error, but replication is also a gold standard in science (see chap. 2, this volume). This idea is elaborated next and again in chapter 8.
NIL HYPOTHESES ARE USUALLY FALSE Nil hypotheses are the most common type tested in the social sciences. However, it is very unlikely that the value of any population parameter is exactly zero, especially if zero implies the complete absence of an effect, association, or difference (e.g., Kirk, 1996). For example, the population correlation (p) between any two variables we would care to name is probably 70
STATISTICAL TESTS
not zero. It is more realistic to assume nonzero population associations or differences (see chap. 2, this volume). Meehl (1990) referred to these nonzero effects as a "crud factor" because, at some level, everything is related to everything else; Lykken's (1968) term ambient correlational noise means basically the same thing. Although exact values of the crud factor are unknown, correlations may depart even further from zero for variables assessed with the same measurement method. Correlations that result in common method variance may be as high as .20 to .30 in absolute value. If nil hypotheses are rarely true, rejecting them requires only sufficiently large samples. Accordingly, (a) the effective rate of Type I error in many studies may be essentially zero, and (b) the only kind of decision error is Type II. Given that power is only about .50 on average, the typical probability of a Type II error is also about .50. F. Schmidt (1992, 1996) made the related point that methods to control experimentwise Type I error, such as the Bonferroni correction, may reduce power to levels even lower than .50. It should be said that, as point hypotheses, non-nil hypotheses are no more likely to be true than nil hypotheses. Suppose that a non-nil hypothesis is HQ: p = .30. The true value of the population correlation may be just as unlikely to be exactly .30 as zero. However, non-nil hypotheses offer a more realistic standard against which to evaluate sample results, when it is practical to actually test them. Perhaps most p values reported in the research literature are associated with null hypotheses that are not plausible. For example, D. Anderson et al. (2000) reviewed the null hypotheses tested in several hundred empirical studies published from 1978 to 1998 in two prominent environmental sciences journals. They found many biologically implausible null hypotheses that specified things such as equal survival probabilities for juvenile and adult members of a species or that growth rates did not differ across species, among other assumptions known to be false before the data were collected. I am unaware of a similar survey of null hypotheses in the social sciences, but it would be surprising if the results would be appreciably different.
SAMPLING DISTRIBUTIONS OF TEST STATISTICS ASSUME RANDOM SAMPLING Lunneborg (2001) described this issue as a mismatch between statistical analysis and design. The p values for test statistics are estimated in sampling distributions that assume random sampling from known populations. These are the same distributions in which standard errors for traditional confidence intervals are estimated. Random sampling is a crucial part of the population inference model, which concerns the external validity of sample results. However, most samples in the social sciences are not randomly selected— INTRODUCTORY CONCEPTS
71
they are samples of convenience. In experimental studies, it is the randomization model, which involves the random assignment of locally available cases to different conditions, that is much more common than the population inference model. Reichardt and Gollob (1999) suggested that results of standard statistical tests yield standard errors that are too conservative (too large) when randomized cases are from convenience samples. They described a modified t test that assumes the population size equals total number of cases, N = HI + ni. Lunneborg (2001) described the use of bootstrapping to construct empirical sampling distributions for randomization studies based on convenience samples. Bootstrapping is described in chapter 9. Bakan (1966) argued that the ideal application of NHST is manufacturing, not the social sciences. Essentially any manufacturing process is susceptible to random error. If this error becomes too great, such as when pistons are made too big relative to the cylinders in car engines, products fail. In this context, the null hypothesis represents a product specification that is reasonable to assume is true, samples can be randomly selected, and exact deviations of sample statistics from the specification can be accurately measured. It may also be possible in this context to precisely estimate the costs of certain decision errors. All of these conditions rarely hold in behavioral research. As the saying goes, one needs the right tool for the right job. Perhaps NHST is just the wrong tool in many behavioral studies.
STATISTICAL ASSUMPTIONS OF NHST METHODS ARE INFREQUENTLY VERIFIED Statistical tests usually make certain distributional assumptions. Some are more critical than others, such as the sphericity requirement of the dependent samples F test. If critical assumptions are violated, p values may be wrong. Unfortunately, it seems that too many researchers do not provide evidence about whether distributional assumptions are met. H. Keselman et al. (1998) reviewed more than 400 analyses in studies published from 1994 to 1995 in major education research journals, and they found relatively few articles that verified assumptions of statistical tests. Max and Onghena (1999) found a similar neglect of statistical issues across 116 articles in speech, language, and hearing research journals. These surveys reflect an apparently substantial gap between NHST as described in the statistical literature and its use in practice. Results of more quantitative reviews also suggest that there may be relatively few instances in practice when widely used methods such as the standard F test give accurate results because of violations of assumptions (e.g., Lix, J. Keselman, & H. Keselman, 1996).
72
STATISTICAL TESTS
NHST BIASES THE RESEARCH LITERATURE There is a sense that journal editors are not interested in publishing studies without HQ rejections. This perception is supported by (a) comments by past editors of respected journals about favoring studies with HQ rejections (e.g., Melton, 1962); (b) survey results that show that behavioral researchers are unlikely to submit studies without HO rejections for publication (e.g., Greenwald, 1975); and (c) the more causal observation that the large majority of published studies contain H0 rejections. The apparent bias for studies with statistically significant results presents the difficulties enumerated and discussed next: 1. The actual rate of Type I error in published studies may be much higher than indicated by a. Suppose that a treatment is no more effective than control (the nil hypothesis is true) and 100 different studies of the treatment are each conducted at Ct = .05. Of the 100 t tests of the treatment versus control mean contrasts, a total of five are expected to be statistically significant. Suppose these five studies are published, but authors of the other 95 decide not to submit their studies or do so but without success. The actual rate of Type I error among the five published studies is 100%, not 5%. Also, the only studies that got it right—the 95 where HO was not rejected—were never published. Clark (1976) made a similar point: Because researchers find it difficult to get their failures to replicate published, Type I errors, once made, are difficult to correct. 2. The reluctance to submit or publish studies with no statistically significant results leads to a "file drawer problem." This term is from R. Rosenthal (1979), and it refers to studies not submitted for publication or presented in another forum, such as conferences. It is thought that many file drawer studies contain no HO rejections. If an effect is actually zero, results of such studies are more scientifically valid than published studies that reject nil hypotheses. 3. Published studies overestimate population effect sizes. Without large samples to study small- or medium-sized effects, it may be difficult to get statistically significant results because of low power. When HO is rejected, it tends to happen in samples where the observed effect size is larger than the population effect size. If only studies with HO rejections are published, the magnitude of the population effect size winds up being overestimated. An example illustrates this point. Table 3.2
INTRODUCTORY CONCEPTS
73
TABLE 3.2 Results of Six Hypothetical Replications Study
W-*
1 2 3 4 5 6
2.50 4.00 2.50 4.50 5.00 2.50
Average:
3.58
s? 17.50 16.00 14.00 13.00 12.50 15.00
si
'(38)
Reject nil hypothesis?
95% Cl
16.50 18.00 17.25 16.00 16.50 17.00
1.91 3.07 2.00 3.74 4.15 1.98
No Yes No Yes Yes No
-.53-6.53 1.36-6.64 -.03-5.03 2.06-6.94 .56-7.44 -.06-5.06
Range of overlap:
2.06-5.03
Note. For all replications, n = 20, a = .05, and H, is nondirectional. Cl = confidence interval.
summarizes the results of six different hypothetical studies where two of the same conditions are compared on the same outcome variable. Note that results of the independent samples t test leads to rejection of a nil hypothesis in three studies (50%), but not in the rest. More informative than the number of HO rejections is the average value of MI - M2 across all six studies, 3.58. This result may be a better estimate of jj,j - U-2 than the mean difference in any individual study. Now suppose that results from the three studies with HQ rejections in the table (studies 2, 4, and 5) are the only ones published. The average value of M! - M2 for these three studies is 4.22, which is greater than the average based on all six studies.
NHST MAKES THE RESEARCH LITERATURE DIFFICULT TO INTERPRET If there is a real effect but power is only .50, about half the studies will show positive results (Ho rejected) and the rest negative results (Ho not rejected). If somehow all studies are published, the box score of positive and negative results will be roughly equal. From this perspective, it would appear that the research literature is inconclusive (e.g., Table 3.2). Because power is generally about .50 in the social sciences, it is not surprising that only about half of the studies in some areas yield positive results (F. Schmidt, 1996). This is especially true in "soft" behavioral research where theories are neither convincingly supported or discredited but simply fade away as researchers lose interest (Meehl, 1990). Part of the problem comes from interpreting the failure to reject a nil hypothesis as implying a zero population
74
STATISTICAL TESTS
effect size. Such misinterpretation may also lead to the discarding of treatments that produce real benefits. There may be other negative consequences of using NHST outcomes to sort studies by whether their results are statistically significant. I have heard many psychology students say, "Research never proves anything." These same students have probably recognized that "the three most commonly seen terms in the [soft social science] literature are 'tentative,' 'preliminary,' and 'suggest.' As a default, 'more research is needed' " (Kmetz, 2000, p. 60). It is not only a few students who are skeptical of the value of research. Clinical psychology practitioners surveyed by Beutler, R. Williams, Wakefield, and Entwistle (1995) indicated that the clinical research literature was not relevant for their work. Similar concerns about research relevance have been expressed in education (D. W. Miller, 1999). These unenthusiastic views of research are the antithesis of the attitudes that academic programs try to foster.
NHST DISCOURAGES REPLICATION Although I am unaware of data that supports this speculation, a survey would probably find just as many behavioral researchers as their natural science colleagues who would endorse replication as a critical activity. Nevertheless, there is a sense that replication is given short shrift in the social sciences compared to the natural sciences. There is also evidence that supports this concern. Kmetz (1998) used an electronic database to survey about 13,000 articles in the area of organizational science and about 28,000 works in economics. The rates of studies specifically described as replications in each area were .32% and .18%, respectively. Comparably low rates of nominal replications have also been observed in psychology and education journals (e.g., Shaver & Norton, 1980). The extensive use of NHST in the social sciences and resulting cognitive misdirection may be part of the problem. For example, if one believes that p < .01 implies that the result is likely to be repeated more than 99 times out of 100, why bother to replicate? A related cognitive error is the belief that statistically significant findings should be replicated, but not ones for which H0 was not rejected (F. Schmidt & Hunter, 1997). That NHST makes research literatures look inconclusive when power is low may also work against sustained interest in research topics. Perhaps replication in the behavioral sciences would be more highly valued if confidence intervals were reported more often. Then readers of empirical articles would be able to see the low precision with which many studies are conducted. That is, the widths of confidence intervals for behavioral data are often, to quote J. Cohen (1994, p. 1002), "so embarrassingly INTRODUCTORY CONCEPTS
75
large!" Relatively wide confidence intervals indicate that the study contains only limited information, a fact that is concealed when only results of statistical tests are reported (F. Schmidt & Hunter, 1997). This reality is acknowledged by the aspect of meta-analytic thinking that does not overemphasize outcomes of statistical tests in individual studies (see chap. 1, this volume).
NHST OVERLY AUTOMATES THE REASONING PROCESS Social science researchers and students alike seem to universally understand the importance of precise operationalization. The method of NHST offers many of the same apparent advantages in the realm of inference: It is a detailed, step-by-step procedure that spells out the ground rules for hypothesis testing (see chap. 2, this volume). It is also a public method in that its basic rules and areas for researcher discretion are known to all. One of the appeals of NHST is that it automates much of the decision-making process. It may also address a collective need in the social sciences to appear as objective as the natural sciences. However, some critics claim that too much of our decision making has been so automated. Some of the potential costs of letting statistical tests do our thinking for us are summarized next. 1. Use of NHST encourages dickotomous thinking. The ultimate outcome of a statistical test is dichotomous: HQ is either rejected or not rejected. This property may encourage dichotomous thinking in its users, and nowhere is this more evident than for p values. If a = .05, for instance, some researchers see a result where p = .06 as qualitatively different than one where p = .04. These two results lead to different decisions about HQ, but their p values describe essentially the same likelihood of the data (Rosnow & R. Rosenthal, 1989). More direct evidence of dichotomous thinking was described by Nelson et al. (1986), who asked researchers to rate their confidence in results as a function of p values. They found a relatively sharp decline in rated confidence when p values were just above .05 and another decline when p values were just above .10. These changes in confidence are out of proportion to changes in continuous p values. That NHST encourages dichotomous thinking may also contribute to the peculiar practice to describe results where
76
STATISTICAL TESTS
p is just above the level of a as "trends" or "approaching significance." These findings are also typically interpreted along with statistically significant ones. However, results with p values just lower than (X, such as p = .04 when a = .05, are almost never described as "approaching nonsignificance" and subsequently discounted. There is a related tendency to attribute the failure to reject HQ to poor experimental design rather than to the invalidity of the substantive hypothesis behind HI (Cartwright, 1973). 2. Use of NHST diverts attention away from the data and the measurement process. If researchers become too preoccupied with HO rejections, they may lose sight of other, more important aspects of their data, such as whether the variables are properly defined and measured. There is a related misconception that reliability is an attribute of tests rather than of the scores for a particular population of examinees (B. Thompson, 2003). This misconception may discourage researchers from reporting the reliabilities of their own data. Interpretation of effect size estimates also requires an assessment of the reliability of the scores (Wilkinson & the Task Force on Statistical Inference [TFSI], 1999). 3. The large investment of time to learn NHST limits exposure to other methods. There is a large body of statistical methods other than NHST that can deal with a wide range of hypotheses and data, but social science students generally hear little about them, even in graduate school. The almost exclusive devotion of formal training in statistics to NHST leaves little time for learning about alternatives. Those who become professional researchers must typically learn about these methods on their own or in workshops. 4. The method of NHST may facilitate research about fad topics that clutter the literature but have little scientific value. Meehl's (1990) observations on soft psychology research topics with short shelf lives were mentioned earlier. The automatic nature of NHST has been blamed by some authors as a contributing factor: With very little thought about a broader theoretical rationale, one can collect data from a sample of convenience and apply statistical tests. Even if the numbers are random, some of the results are expected to be statistically significant. The objective appearance and mechanical application of NHST may lend an air of credibility to studies with otherwise weak conceptual foundations.
INTRODUCTORY CONCEPTS
77
NHST IS NOT AS OBJECTIVE AS IT SEEMS The level of ot and the forms of HO (nil versus non-nil) and the alternative hypothesis (directional versus nondirectional) should be specified before the data are collected. This does not always happen in practice. Under a strict view, this is paramount to cheating. Even under a less demanding standard, the ability to change the rules to enhance the outcome makes the whole process seem more subjective than objective. Selective reporting of results, such as only those where HQ was rejected, presents a similar problem.
MANY NHST METHODS ARE MORE CONCERNED WITH GROUPS THAN INDIVIDUALS Statistical tests that analyze means, such as t and F, are concerned with group statistics. They provide little information about individuals within these groups. Indeed, within-groups variances contribute to the error terms of both t and F. However, there are times when it is crucial to understand the nature of individual differences within groups. For instance, it can happen that the group mean difference is statistically significant, but there is substantial overlap of the two frequency distributions. This suggests that the difference at the group level does not trickle down to the case level. Some methods of effect size estimation introduced in chapter 4 analyze differences at the case level.
NHST AND SCHOOLS OF PROBABILITY In the fields of mathematics, statistics, and philosophy of science, there are several different schools of thought about probabilities, including classical, frequentist, and subjective, among others. There are also deep and long-standing divisions between these schools about the exact meaning of probabilities and their proper interpretation. These debates are complex and highly nuanced, and whole books have been written on the subject (e.g., Hogben, 1957). For these reasons, these debates cannot be summarized in this section. However, readers should know that NHST is associated with only some of these schools of thought about probability; specifically, ones that view probabilities as relative frequencies of repeatable events that can be empirically observed or approximated with theoretical sampling distributions. The method of NHST also uses little previous knowledge other than to assume that H0 is true. But in no way does NHST represent a consensual view of probability either within or outside the social sciences. 78
STATISTICAL TESTS
CONTINUED USE OF NHST IS A RESULT OF INERTIA Several critics have described the continued use of NHST as an empty, ritualized practice, one carried out with little reflection. Education in social science statistics that fails to inform about alternatives may encourage the belief that there is no other way to test hypotheses (F. Schmidt & Hunter, 1997). This belief is unfounded. It is also worth noting that some of the most influential work in psychology, including that of Piaget, Pavlov, and Skinner, was conducted without rejecting null hypotheses (Gigerenzer, 1993). The natural sciences have thrived despite relatively little use of statistical tests. Others note the general difficulty of changing established methods in science. A familiar, well-entrenched method is like a paradigm, and changing paradigms is not quick or easy (Kuhn, 1996). Such change sometimes awaits the passing of an older generation of scholars and its replacement with younger colleagues who are not as set in their ways. Recall that the adoption of NHST as the standard for hypothesis testing in psychology took about 20 years (see chap. 1, this volume).
IS THERE ANYTHING RIGHT WITH NHST? The litany of criticisms of NHST reviewed in this chapter raise the question of whether there is anything right about NHST. However, NHST is not without its defenders. Some positive aspects of NHST are enumerated and discussed next. 1. If NHST does nothing else, it addresses sampling error. Sampling error is one of the core problems of behavioral research. For all the limitations of p values, they are at least derived taking account of sampling error. Accordingly, some behavioral researchers see NHST as addressing an important need and thus may be less like passive followers of tradition than supposed by critics. Any proposed alternative to NHST must deal with the problem of sampling error lest it be seen as irrelevant to the needs of these researchers. Critics of NHST rightly point out that confidence intervals convey more information about sampling error than test statistics and p values. They also suggest that excessive preoccupation with statistical tests is one reason why confidence intervals are not reported more often. However, confidence intervals are subject to some of the same kinds of inference errors as NHST. Abelson (1997a) made this point in a lighthearted way by describing the "law
INTRODUCTORY CONCEPTS
79
of diffusion of idiocy," which says that every foolish practice of NHST will beget a corresponding practice with confidence intervals. However, just because a confidence interval can be interpreted in some ways like a statistical test does not mean that it must be. Confidence intervals are not a magical alternative to NHST. However, interval estimation in individual studies and replication together offer a much more scientifically credible way to address sampling error than the use of statistical tests in individual studies. Consider again the data in Table 3.2 for six hypothetical replications. A 95% confidence interval about the observed mean contrast is reported for each replication. Each interval estimates sampling error, but itself is also subject to sampling error. The range of overlap among the six confidence intervals is 2.06 to 5.03. This information is more useful than knowing that a nil hypothesis was rejected in 3/6 studies. F. Schmidt (1996) and others have noted that even if our initial expectations regarding parameters are very wrong, we will eventually discover our error by plotting the related confidence intervals across studies. 2. Misinterpretations of NHST are not the fault of the method. Defenders of NHST generally acknowledge widespread misinterpretations. They also note that such misunderstandings are the responsibility of those who use it (Krantz, 1999). Critics may counter that any method with so much apparent potential to be misconstrued by so many intelligent and highly educated users must ultimately assume some of the blame. 3. More careful use of technical terms may avoid unwarranted connotations. An area of suggested reform concerns the language used to report the results of statistical tests (e.g., D. Robinson &. Levin, 1997). For example, some have suggested that the term significant should always be qualified by the word statistically—which may prompt readers to distinguish between statistical significance and substantive significance (B. Thompson, 1996)—and that exact p values should be reported instead of just whether they are less than or greater than (X, such as: t (20) = 2.40, p = .026
instead of
t (20) = 2.40, p < .05
80
STATISTICAL TESTS
The latter recommendation has some problems, however. The possibility that p values are incorrect in many behavioral studies was mentioned earlier, so their reporting to three- or fourdecimal accuracy may give a false impression. In large samples, p values are often very low, such as .000012, and reporting such small probabilities may actually encourage misinterpretation. It must also be said that these kinds of suggestions have been made many times over the past 50 years with little apparent impact. Critics would probably feel little conviction that any of the modifications just described would ameliorate the limitations of NHST for most applications in the social sciences. For them, the following expression may be pertinent: You can put candles in a cow pie, but that does not make it a birthday cake. 4. Some research questions require a dichotomous answer. The final outcome of NHST is the decision to reject or fail to reject HQ. There are times when the question that motivates the research is also dichotomous, including, for instance, should this intervention program be implemented? Is this drug more effective than placebo? The method of NHST addresses whether observed effects or relations stand out above sampling error, but it is not as useful for estimating the magnitudes of these effects (Chow, 1996). There are also times when theories predict directions of effects but not their specific magnitudes. One reading instruction method may be believed to be more effective than another by some unknown amount, for example. The testing of theories that predict directions but not amounts is also probably more typical in the social sciences than in the natural sciences. However, it is always useful to measure the magnitude of an effect. Indeed, if we cannot think about magnitudes, then we may never get to theories that predict magnitudes instead of just directions. Estimating the average size of an effect with meta-analysis instead of counting the numbers of HQ rejections is also a better way to synthesize results across a set of studies (chap. 8, this volume). 5. Nil hypotheses are sometimes appropriate. The criticism that nil hypotheses are typically false was discussed earlier. As noted by Frick (1995), D. Robinson and Wainer (2002), and others, there are cases when the assumption of a zero effect is justified. For example, there may be no reason in a complex study to predict an effect when just one independent variable is manipulated.
INTRODUCTORY CONCEPTS
81
6. The method of NHST is a gateway to statistical decision (utility) theory. In this approach—well known in fields such as engineering and environmental studies—probabilities of Type I and Type II errors are weighted by estimated costs of each kind of mistake. The net anticipated gains and losses are then evaluated to make rational decisions about alternative actions in the face of uncertainty. In contrast to NHST, the probability of a Type I error is not arbitrarily set to either .05 or .01 in statistical decision theory. The latter method may be able to detect long-term negative consequences of an intervention even while statistical tests are unable to reject the nil hypothesis of no short-term effect (Johnson, 1999). Statistical decision theory is a very powerful method if it is possible to estimate the costs of different decisions in dollars, life expectancy, or some other quantitative, objective metric. This is not usually possible in behavioral research.
VARIATIONS ON NHST This section identifies some specialized methods that are modifications of the basic NHST model. These methods may avoid some of the problems of traditional statistical tests and can be very useful in the right situation. It is possible to give only brief descriptions, but interested readers can look to the works cited next for more information. Range Null Hypotheses and Good-Enough Belts As mentioned, any point null hypothesis is probably false. Serlin (1993) described the specification of HQ as a range hypothesis that indicates the values of the population parameter considered equivalent and uninteresting. The alternative hypothesis is still a range hypothesis, but it specifies a minimum result based on substantive considerations that is necessary for additional analysis. These ranges for HQ and Hj are called good'enough belts, which implies that one hypothesis or the other is considered supported within predefined margins. The specification of range null hypotheses in the social sciences is relatively rare—a notable exception is the evaluation of model fit in structural equation modeling (e.g., Kaplan, 2000, chap. 6)—and there is some question whether this approach would make any practical difference (Cortina & Dunlap, 1997).
82
STATISTICAL TESTS
Equivalence Testing Equivalence testing is better known in pharmacological research and the environmental and biological sciences. It deals with the problem of establishing equivalence between two groups or conditions. For example, a researcher may wish to determine whether a generic drug can be substituted for a more expensive drug. In traditional NHST, the failure to reject HQ: (J-i = (J-2 is not evidence that the drugs are equivalent. In one form of equivalence testing, a single point null hypothesis is replaced by two range subhypotheses. Each subhypothesis expresses a range of |U,i — JJ-2 values that corresponds to substantive mean differences. For example, the pair of subhypotheses J H0l: fai - \12) < -10.00
I H02: (a, - ji 2 ) > 10.00 says that the population means cannot be considered equivalent if the absolute value of their difference is greater than 10.00. The complementary interval for this example is the equivalence hypothesis -10.00 < (ji! - (I2) ^ 10.00 which is a good-enough belt for the equivalence hypothesis. Standard statistical tests are used to contrast the observed mean difference against each of these one-sided null hypotheses for a directional alternative hypothesis. Only if both range subhypotheses are rejected at the same level of OC can the compound null hypothesis of nonequivalence be rejected. The same decision can also be reached on the basis of a confidence interval around the observed mean difference. In the approach just outlined, Type I error is the probability of declaring two populations or conditions to be equivalent when in truth they are not. In a drug study, this risk is the patient's (consumer's) risk. McBride (1999) showed that if Type I error risk is to be the producer's instead of the patient's, the null hypothesis appropriate for this example would be H0: -10.00 < fa - ji2) £ 10.00 and it would be rejected if either the lower end of a one-sided confidence interval about the observed mean difference is greater than 10.00 or the upper end of a one-sided confidence interval is less than -10.00. Rogers, K. Howard, and Vessey (1993) introduced equivalence testing to social
INTRODUCTORY CONCEPTS
83
scientists, and P. M. Dixon (1998) described its application in risk assessment. Inferential Confidence Intervals Tryon (2001) proposed an integrated approach to testing means for statistical difference, equivalence, or indeterminancy (neither statistically different or equivalent). It is based on inferential confidence intervak, which are modified confidence intervals constructed around individual means. The width of an inferential confidence interval is the product of the standard error of the mean (Equation 2.4) and a two-tailed critical t value reduced by a correction factor that equals the ratio of the standard error of the mean difference (Equation 2.8) over the sum of the individual standard errors. Because values of this correction factor range from about .70 to 1.00, widths of inferential confidence intervals are generally narrower than those of standard confidence intervals about the same means. A statistical difference between two means occurs in this approach when their inferential confidence intervals do not overlap. The probability associated with this statistical difference is the same as that from the standard t test for a nil hypothesis and a nondirectional alternative hypothesis. In other words, this method does not lead to a different conclusion than standard NHST, at least in difference testing. Statistical equivalence is concluded when the maximum probable difference between two means is less than an amount considered inconsequential as per an equivalence hypothesis. The maximum probable difference is the difference between the highest upper bound and the lowest lower bound of two inferential confidence intervals. For example, if the 10.00 to 14.00 and 12.00 to 18.00 are the inferential confidence intervals based on two different means, the maximum probable difference is 18.00 - 10.00 = 8.00. If this difference lies within the range set by the equivalence hypothesis, statistical equivalence is inferred. A contrast neither statistically different or equivalent is indeterminant, and it is not evidence for or against any hypothesis. Tryon claimed that this method is less susceptible to misinterpretation because (a) the null hypothesis is implicit instead of explicit, (b) the model covers tests for both differences and equivalence, and (c) the availability of a third outcome—statistical indeterminancy—may reduce the interpretation of marginally nonsignificant differences as "trends." It remains to be seen whether this approach will have a positive impact. Three-Valued Logic Kaiser (1960) may have been one of the first social science authors to suggest substituting three-valued logic for the standard two-valued (dichoto84
STATISTICAL TESTS
mous) logic of NHST. Briefly, three-valued logic allows split-tailed alternative hypotheses that permit statistically significant evidence against a substantive hypothesis if the direction of the observed effect is not as predicted. This is basically a simultaneous test of two directional alternative hypotheses, one for and the other against the research hypothesis. The third kind of test is for a standard nondirectional alternative hypothesis. Harris (1997b) provides a very clear, contemporary description of three-valued logic, but notes that it has not been used much.
WHAT DO WE DO NOW? BUILDING A BETTER FUTURE After considering criticisms of statistical tests, we can choose one of the following courses of action: 1. Do nothing; that is, continue using statistical tests just as we have for the past 50 years. 2. Stop using statistical tests entirely. Stop teaching them in university courses. Effectively ban their use by refusing to publish studies in which they are used. Although this option sounds hypothetical or even radical, some highly respected researchers have called for such a ban (e.g., Hunter, 1997; F. Schmidt, 1996). 3. Chart a course between the two extremes listed, one that calls for varying degrees of use of statistical tests-—from none to somewhat more pivotal, depending on the research context, but with strict requirements for their use. The first option is not acceptable because there are negative implications for the advancement of behavioral research that rule out doing nothing. A ban on statistical tests in psychology journals does not seem imminent in the short term, but the fact that some journals require the reporting of effect sizes is an effective ban on the use of statistical tests by themselves (see chap. 1, this volume). The first two options are thus excluded. Outlined next are recommendations based on the third option. They are intended as a constructive framework for change. It is assumed that reasonable people could disagree with some of the specifics put forward. Indeed, a lack of consensus has characterized the whole debate about NHST, so no single set of recommendations will satisfy everyone. Even if the reader does not endorse all the points outlined, he or she may at least learn new ways of looking at the controversy about statistical tests or, even better, data, which is the ultimate goal of this book. The main theme of the recommendations can be summarized like this: The method of NHST may have helped us in psychology and related INTRODUCTORY CONCEPTS
85
behavioral sciences through a difficult adolescence during which we struggled to differentiate ourselves from the humanities while at the same time we strived to become more like our primary role model, the natural sciences. However, just as few adults wear the same style of clothes, listen to the same types of music, or have the same values they did as teenagers, behavioral research needs to leave its adolescence behind and grow into new ways of doing things. Arrested development is the only alternative. Recommendations Specific suggestions are listed and then discussed afterward: 1. Only in very exploratory research where it is unknown whether effects exist may a primary role for NHST be appropriate. 2. If statistical tests are used, (a) information about power must be reported, and (b) the null hypothesis must be plausible. 3. In any kind of behavioral research, it is not acceptable anymore to describe results solely in terms of NHST outcomes. 4- Drop the word "significant" from our data analysis vocabulary. Use it only in its everyday sense to describe something actually noteworthy or important. 5. It is the researcher's responsibility to report and interpret, whenever possible, effect size estimates and confidence intervals for primary results. This does not mean to report effect sizes only for HO rejections. 6. It is also the researcher's responsibility to demonstrate the substantive (theoretical, clinical, or practical) significance of the results. Statistical tests are inadequate for this purpose. 7. Replication is the best way to deal with sampling error. 8. Education in statistical methods needs to be reformed, too. The role of NHST should be greatly deemphasized so that more time can be spent showing students how to determine whether a result has substantive significance and how to replicate it. 9. Researchers need more help from their statistical software to compute effect sizes and confidence intervals. A Primary Rok for NHST May Be Suitabk Only in Very Exploratory Research The ability of NHST to address the dichotomous question of whether relations are greater than expected levels of sampling error may be useful in some new research areas. Considering the many limitations of NHST discussed, the period of this usefulness should be brief. Given evidence that
86
STATISTICAL TESTS
an effect exists, the next steps should involve estimation of its magnitude and evaluation of its substantive significance, both of which are beyond the range of what NHST can tell us. More advanced study of the effect may require model-fitting techniques, such as structural equation modeling (e.g., Kline, 1998), hierarchical linear modeling (e.g., Raudenbush & Bryk, 2002), or latent class analysis (e.g., Hagenaars & McCutcheon, 2002), among other techniques that test models instead of just individual hypotheses. It should be the hallmark of a maturing research area that NHST is not the primary inference tool. Report Power for Any Use of Statistical Tests, and Test Only Plausible Null Hypotheses The level of power reported should be a priori power, not observed power (see chap. 2, this volume; also Wilkinson & TFSI, 1999). It is especially important to report power if most of the results are negative— that is, there were few HQ rejections. This is because readers of an empirical study should be able to tell whether the power of the study is so low (e.g., < .50) that negative results are expected. Knowing that HQ was rejected is useful only if that hypothesis is plausible. Also, one minus power is the probability of a Type II error, which can only occur if HQ is not rejected when there is a real effect. We probably see so few examples of reporting power in the research literature when the results are mainly negative because of bias toward only publishing studies with H0 rejections. In a less biased literature, however, information about power would be more relevant. Low p values that exaggerate the relative infrequency of the results are expected under implausible null hypotheses. If it is feasible to test only a nil hypotheses but a nil hypothesis is implausible, interpretation of the results of statistical tests should be accordingly modified. It Is Not Acceptable to Describe Results Only on the Basis of NHST Outcomes All of the shortcomings of NHST considered provide the rationale for this recommendation. For journal editors and reviewers, NHST outcomes should also not be the primary consideration for deciding whether to accept or reject submissions for publication. Stop Using the Word "Significant" in Connection With NHST In hindsight, the choice of the word "significant" to describe the event p < a was very poor. Although statisticians understand that significant in NHST does not imply a large or important effect, the use of this word may foster false beliefs among nonstatisticians. Accordingly, we in the behavioral sciences should "give" this word back to the general public and use it only INTRODUCTORY CONCEPTS
87
as does everyone else—to denote importance, meaningfulness, or substantialness. Use of just the word "statistical" when HO is rejected should suffice. For instance, rejection of the hypothesis H0: p = 0 could be described as evidence for a statistical association or correlation between the variables, and rejection of the hypothesis HQ: (J. i = (X 2 could be described as evidence for a statistical mean difference (Tryon, 2001). Calling an effect statistical implies that it was observed, but not also noteworthy. Of course, statistical effects may also be meaningful effects, but this is a not a question for NHST. The simple phrasing just suggested also seems preferable to the expression "statistically reliable" to describe HQ rejections. This is because one connotation of reliable is repeatable, but p values say nothing directly about the chances of replication. At the very least, if the word significant is used in an oral or written interpretation of the results, it should always be preceded by the qualifier "statistical" (B. Thompson, 1996). Whenever Possible, Researchers Should Be Obliged to Report and Interpret Effect Sizes and Confidence Intervals
That increasing numbers of journals require effect size estimates supports this recommendation (see chap. 1, this volume). Reporting confidence intervals for effect size estimates is even better: Not only does the width of the confidence interval directly indicate the amount of sampling error associated with an observed effect size, it also estimates a range of effect sizes in the population that may have given rise to the observed result. However, it is recognized that it is not always possible to compute effect sizes in certain kinds of complex designs or construct confidence intervals based on some types of statistics. However, effect size can be estimated and confidence intervals can be reported in most behavioral studies. Researchers Should Also Be Obliged to Demonstrate the Substantive Significance of Their Results
Null hypothesis rejections do not imply substantive significance. Thus, researchers need other frames of reference to explain to their audiences why the results are interesting or important. A quick example illustrates this idea. In a hypothetical study titled "Smiling and Touching Behaviors of Adolescents in Fast Food Restaurants," effects were statistically significant, but might not be deemed substantively important to many of us, especially if we are not adolescents, or do not frequent fast food restaurants. It is not easy to demonstrate substantive significance, and certainly much more difficult than using p values as the coin of the social scientific realm. Estimation of effect size gives a starting point for determining substantive significance; so does consulting meta-analytic works in the area (if they exist). It is even better for researchers to use their domain knowledge to inform the STATISTICAL TESTS
use of the methods just mentioned (Kirk, 1996). These ideas are elaborated in the next chapter. Replication Is the Best Way to Deal With Sampling Error
The rationale for this recommendation is also obvious. It would make a very strong statement if journals or granting agencies required replication. This would increase the demands on the researcher and result in fewer published studies. The quality of what would be published might improve, however. A requirement for replication would also filter out some of the fad social science research topics that bloom for a short time but then quickly disappear. Such a requirement could be relaxed for original results with the potential for a large impact in their field, but the need to replicate studies with unexpected or surprising results is even greater (D. Robinson & Levin, 1997). Education in Statistical Methods Should Be Much Less NHST-Centric and More Concerned With Replication and Determining Substantive Significance
The method of NHST is often presented as the pinnacle in many introductory statistics courses. This situation is reinforced by the virtually monolithic, NHST-based presentation in many undergraduate-level statistics textbooks. Graduate courses often do little more than inform students about additional NHST methods and strategies for their use (Aiken et al., 1990). The situation is little better in undergraduate psychology programs, which emphasize traditional approaches to analysis (i.e., statistical tests) and have not generally kept pace with changes in the field (Frederich, Buday, & Kerr, 2000). It is also true that many statistics textbooks still do not emphasize methods beyond traditional statistical tests, such as effect size (e.g., R. Capraro & M. Capraro, 2002). Some topics already taught in introductory courses should be given more prominence. Many effect size indexes are nothing more than correlations, proportions of standard deviations, or percentages of scores that fall at certain points. These are all basic kinds of statistics covered in many introductory courses. However, their potential application outside classical descriptive or inferential statistics is often unexplained. For example, students usually learn about the t test for comparing independent means. These same students often do not know about the point-biserial correlation, rpi,. In a two-sample design, rpb is the correlation between a dichotomous independent variable (group membership) and a quantitative dependent variable. It is easily derived from the t test and is just a special case of the Pearson correlation r. Less emphasis on NHST may also encourage students to choose simpler methods of data analysis (e.g., Wilkinson et al., 1999). Doing so may help INTRODUCTORY CONCEPTS
89
them appreciate that NHST is not necessary to detect meaningful or noteworthy effects, which should be obvious to visual inspection of relatively simple kinds of statistics or graphical displays (J. Cohen, 1994). The description of results at a level closer to the data may also help students develop better communication skills. This is important for students who later take up careers where they must explain the implications of their results to policy makers (McCartney & R. Rosenthal, 2000). We also need better integration between courses in research methods and statistics. In many undergraduate programs, these subjects are taught in separate courses, and there may be little connection between the two. The consequence is that students learn about data analysis methods without getting a good sense of their potential applications. This may be an apt time to rethink the partition of the teaching of research skills into separate statistics and methods courses. Statistical Software Should Be Better at Computing Effect Sizes and Confidence Intervals
Most general statistical software programs are still very NHST-centric. That more of them now optionally print at least some kinds of effect size indexes is encouraging. Considering these discussions, however, perhaps results of statistical tests should be the optional output. Literally dozens of effect size indexes are available (e.g., Kirk, 1996), and at least some of the more widely used indexes should be available in computer program output for every analytical choice. It should also be the case that for a given analytical choice, several different effect sizes are options. Many contemporary general statistical programs also optionally print confidence intervals for population means or regression coefficients, but they should also give confidence intervals for population effect sizes. It was mentioned that special computational methods required for exact confidence intervals for effect sizes have only recently become more widely available, but one hopes that these algorithms will soon be incorporated into general statistical packages. CONCLUSION Statistical tests have been like a collective Rorschach inkblot test for the social sciences: What we see in them has had more to do with wish fulfillment than what is really there. This collective magical thinking has impeded the development of psychology (and related areas) as a cumulative science. There is also a mismatch between the characteristics of many behavioral studies and what is required for results of statistical tests to be accurate. That is, if we routinely specified plausible null hypotheses, studied random samples, checked distributional assumptions, estimated power, and 90
STATISTICAL TESTS
understood the correct meaning of p values, there would be no problem with statistical tests as our primary inference tool. None of these conditions are generally true in the behavioral sciences. I offered several suggestions in this chapter, all of which involve a much smaller role—including none whatsoever—for traditional statistical tests. Some of these suggestions include the computation of effect sizes and confidence intervals for all effects of interest, not just ones in which a null hypothesis is rejected, and evaluation of the substantive significance of results, not just their statistical significance. Replication is the most important reform of all.
RECOMMENDED READINGS Cohen,]. (1994). The earth is round (p < .05). American Psychologist, 49, 997-1003. Nickerson, R. S. (2000). Null hypothesis significance testing: A review of an old and continuing controversy. Psychological Methods, 5, 241-301. Schmidt, F. L, & Hunter, J. E. (1997). Eight common but false objections to the discontinuation of significance testing in the analysis of research data. In L. L. Harlow, S. A. Mulaik, & ]. H. Steiger (Eds.), What if there were no significance tests? (pp. 37-64). Mahwah, NJ: Erlbaum.
INTRODUCTORY CONCEPTS
91
4 PARAMETRIC EFFECT SIZE INDEXES
Statistical significance is the least interesting thing about the results. You should describe the results in terms of measures of magnitude—not just, does a treatment affect people, but how much does it affect them. —Gene V. Glass (quoted in Hunt, 1997, pp. 29-30)
This chapter introduces effect size estimation in comparative studies with continuous outcome variables. It also reviews conceptual issues and potential limitations of effect size estimation in general. Research designs considered in this chapter compare only two independent or dependent samples. Readers more interested in methods for independent samples can skip the sections about dependent samples without difficulty. Supplemental readings about effect size estimation in two-group multivariate designs plus exercises with answers for this chapter are available on the Web site for this book.
CONTEXTS FOR EFFECT SIZE ESTIMATION There are five main contexts for effect size estimation. The first is when units of the outcome variable are arbitrary rather than meaningful. Examples of meaningful scales include salaries in dollars, athletic performance in seconds, and survival time in years. The substantive (theoretical, clinical, or practical) significance of group differences on variables with meaningful scales is usually more apparent than when the scale is arbitrary. An example of an arbitrary scale is the total score on a checklist of true-false items. Because item responses can be coded using any two different numbers, the total score is arbitrary. Even standard scores for such measures are 95
arbitrary because one score metric can be substituted for another. Standardized effect size statistics can be computed to interpret group differences when the scale of the outcome variable is arbitrary. A second context is the comparison of results across outcomes measured on different scales. Suppose that the same two conditions are compared in two different studies. The outcome variable in each study reflects the same construct, but the standard deviation is 10.00 in the first study and 100.00 in the second. The observed mean contrast—the unstandardized mean difference—is M! - M2 = 3.00 in both studies. This result actually represents a larger effect size in the first study than in the second. This is because a mean contrast of 3.00 corresponds to about a third of a standard deviation in the first study (3.00/10.00) but to only 3% of a standard deviation in the second (3.00/100.00). The ratios just given are standardized mean differences, and they express mean contrasts in a common metric, as the proportion of a standard deviation. Standardized mean differences and other standardized effect size indexes provide a common language for comparing results measured on different scales. A third context is a priori power analysis, which requires specification of the expected population effect size magnitude (see chap. 2, this volume). These estimates are often expressed as population versions of the effect size indexes introduced later. The fourth context is meta-analysis, which typically describes the central tendency and variability of standardized effect sizes across a set of studies. To understand power analysis or meta-analysis, one needs to know how effect size is measured. The fifth context involves statistical tests. The use of both methods together can help resolve two interpretational quandaries that can arise if statistical tests are used alone: Effects of trivial magnitude can lead to rejection of the null hypothesis when the sample size is large, and it may be difficult to reject the null hypothesis in small samples even for large effects (see chap. 2, this volume). The measurement of the magnitude of an effect apart from the influence of sample size distinguishes effect size estimation from statistical tests.
TERMS AND IDEAS ABOUT EFFECT SIZE Terminology about effect size estimation in the literature is not consistent: Different names or symbols for the same effect size index are sometimes used in different sources, and the same name or symbol may be used by different authors to refer to different effect size indexes. For example, the symbol d is used in some sources (including this book) to refer to a generic sample standardized mean difference, but in other sources it refers to a population parameter or to a particular kind of sample standardized mean
96
PARAMETRIC EFFECT SIZE INDEXES
difference. Indeed, the very term effect size is used with somewhat different connotations. These inconsistencies make it difficult for newcomers. Effect Size Versus Cause Size Effect size refers to the magnitude of the impact of the independent variable on the dependent variable. It can also be described as the degree of association or covariation between the two. The first description is more applicable in experimental designs, and the second is more suitable for nonexperimental designs. Regardless of the design, effect size is measured on the dependent variable. Cause size, on the other hand, refers to the independent variable and specifically to the amount of change in it that produces a given effect on the dependent variable (Abelson, 1997a). If levels of a factor represent drug dosage, for instance, the amount of increase in dosage associated with a certain behavior change is the cause size. The idea of cause size is most relevant when the factor is experimental and its levels quantitative. It also plays a role in deciding whether an effect size that seems small is actually important. Families of Effect Sizes There are two broad families of effect size indexes for comparative studies with continuous outcomes, standardized mean differences, and measures of association (Maxwell & Delaney, 1990). R. Rosenthal (1994) described these same two categories as, respectively, the d family and the r family when we are referring to sample statistics, and Huberty (2002) distinguished them as, respectively, group difference indexes and relationship indexes. Both families of indexes are metric-free effect sizes that can be used to compare results across different studies or variables measured in different units (B. Thompson, 2002b). The population parameter estimated by a sample standardized mean difference is
(4.1) where the numerator is the population mean contrast and the denominator is a population standard deviation. There is more than one possible population standard deviation for a comparative study. For example, O* could be the standard deviation in just one of the populations (e.g., CT* = Oi) or under the homogeneity of variance assumption it could be the common population standard deviation (i.e., <J* = Oi = GI = a). EFFECT SIZE ESTIMATION IN COMPARATIVE STUDIES
97
The form of a generic sample standardized mean difference is
d = ^^
(4.2)
where the numerator is the observed mean contrast and the denominator— also known as the standardizer—is an estimator of a* that is not the same in all kinds of d statistics. This is because there is more than one population standard deviation that can be estimated. In other words, specific types of d statistics differ in their standardizers, and a standardizer estimates a particular population standard deviation. To understand what a specific type of d statistic measures, one needs to know which population standard deviation its standardizer approximates. Putting aside for now the issue of how standardizers for specific kinds of d statistics are calculated, the basic interpretation of d is straightforward: If d = .50, for example, then MI is half a standard deviation higher than M2. The sign of d is arbitrary because the direction of the subtraction between the means is arbitrary. Always indicate the meaning of its sign when reporting d; also explain how its standardizer was derived. This need arises because of the absence of universal names and symbols for d. Note that d can exceed 1.00 in absolute value. For example, d = 4-00 says that the mean contrast is four standard deviations large. However, it is relatively rare in behavioral studies to find mean differences so large. Presented in the top part of Table 4-1 are the results of two hypothetical studies in which the same group contrast is measured on variables with different scales. The unstandardized mean difference is larger in the first study (75.00) than in the second (11.25), but the estimated population standard deviation is greater in the first study (100.00) than in the second (15.00). Because di = di = .75, we conclude equal effect size magnitudes in standard deviation units. Reported in the bottom part of the table are results of two other hypothetical studies with the same unstandardized mean difference, 75.00. Because the standard deviation in the third study (500.00) is greater than in the fourth (50.00), we conclude unequal effect sizes because dj = .15 and dq = 1.50. Specifically, the mean difference in the third study is one tenth the magnitude of that in the fourth study in standard deviation units. A measure of association describes the amount of the covariation between the independent and dependent variables. It is expressed in an unsquared metric or a squared metric. (The metric of d is unsquared.) An unsquared measure of association is typically a sample correlation. For instance, the Pearson correlation r indicates the observed strength of the relation between two continuous variables, and the square of r (r ) is the 98
PARAMETRIC EFFECT SIZE INDEXES
TABLE 4.1 Standardized Mean Differences for Two Different Sets of Hypothetical Group Contrasts Study
M,-M2
6*
d
1 2
Different mean contrasts, same effect size 75.00 100.00 11.25 15.00
.75 .75
3 4
Same mean contrast, different effect sizes 75.00 500.00 75.00 50.00
.15 1.50
proportion of explained (shared) variance. The latter estimates the parameter p2. A sample measure of association for a comparative study where two independent samples (e.g., treatment and control) are compared on a continuous outcome is the point-biserial correlation r^. (This coefficient is described later.) This statistic is a special case of the Pearson r, which is in turn a special case of the sample multiple correlation R. The latter can be calculated when there are two or more independent or dependent samples (see chap. 2, this volume). In comparative studies in which the analysis of variance (ANOVA) is used, the square of R (R 2 ) is often called the correlation ratio or estimated eta-squared (fj 2 ). The symbol fj2 is used below instead of R2, but do not forget that fj2 is just a squared sample correlation. The parameter estimated by fj2 is T|2, the proportion of total population variance accounted for by an effect of interest when all factors are fixed. The general form of T) is
(4.3)
where the denominator is the variance of the dependent variable computed about the population grand mean and the numerator is the variance due to the effect of interest. Because of capitalisation on chance, the statistic fj2 is a positively biased estimator of T|2, which means that the expected (average) value of fj2 is greater than that of T|2. When a sample correlation or squared correlation such as fj is calculated, its value reflects all possible predictive power. In doing so, it takes advantage of variability that may be idiosyncratic in the sample. This is a greater problem when the sample size is small. There are numerous methods for comparative studies that generate corrected estimates of T|2 that are generally functions of fj 2 , the number of conditions or their
EFFECT SIZE ESTIMATION IN COMPARATIVE STUDIES
99
variances, and group size. Two bias-adjusted estimators from the ANOVA literature for designs with fixed factors are estimated omega-squared (CO2) and estimated epsilon-squared (e2). Please note that some sources use the symbols T|2, CO2, and e2 to refer to sample statistics. This is potentially confusing because lowercase Greek letters without the hat symbol (") usually refer to population parameters (e.g., fi, 0). It is generally true for the same data that fj2 > £2 > CO2, but their values converge in large samples. Many other corrected estimates of p2 are described in the regression literature. Some of these shrinkage-corrected squared multiple correlations (R 2 ) adjust for bias not only in the present sample but also in future, hypothetical replications. Unfortunately, different methods for adjusting squared sample correlations for bias do not all yield identical estimates of the population proportion of explained variance for the same data. There is also limited consensus about which method is best for a particular case. Bias corrections are also unnecessary in large samples. For all these reasons, adjusted estimates of T|2 or p2 are not covered in great detail in this book. An exception is made for CO2, which next to fj2 is one of the most commonly reported measures of association in comparative studies where ANOVA is used and the factors are fixed. It is introduced in chapter 6. See Olejnik and Algina (2000) and Snyder and Lawson (1993) for more information about bias-adjusted estimates of T) or p . A squared sample correlation such as fj is in a squared metric, and it tells us the observed proportion of explained variance. A measure of association in a squared metric is also called a variancc'dccounted-far effect size. Unless a correlation is zero, its square is less than its original (unsquared) absolute value. For example, if r = .20, then r2 = .202 = .04. Because squared correlations can make some effects look smaller than they really are in terms of their substantive significance, some methodologists prefer unsquared correlations (e.g., R. Rosenthal et al., 2000). For example, it may not seem impressive to explain only 4% of the variance, but an effect so "small" in a squared metric can actually be important. Hunter and F. Schmidt (1990) and R. Rosenthal (1994) described several examples in medicine, education, and other areas where potentially valuable findings may have been overlooked because of misinterpretation of variance-accounted-for effect sizes. Some statistical properties of measures of association are easier to understand by referring to a squared metric, however. Kirk (1996) described a category of miscellaneous effect size indexes that include some statistics not described in this book, including the binomial effect size display and the counternull value of an effect size; see R. Rosenthal et al. (2000) for more information.
100
PARAMETRIC EFFECT SIZE INDEXES
LEVELS OF ANALYSIS The d and r families of indexes describe effect size at the group level. As a consequence, they do not directly reflect the status of individual cases, and there are times when effects at the group level do not tell the whole story. However, it is possible to evaluate group differences at the case level. This type of analysis involves comparison of the proportions of scores in different groups that fall above or below certain reference points. These proportions may be observed or predicted, and the reference points may be relative, such as the median of one group, or more absolute, such as a cutting score on an admissions test. Huberty (2002) referred to these statistics as group overlap indexes, and they are usually appropriate for communication with audiences who are not researchers. In contrast, one needs to know something about at least descriptive statistics to understand standardized mean differences or correlations. There is an old saying that goes, "The more you know, the more simply you should speak." Case-level analysis can help a researcher do just that for general audiences.
STANDARDIZED MEAN DIFFERENCES This section introduces particular standardized mean differences for comparing independent or dependent means. It also deals with interval estimation for standardized mean differences. Two Independent Samples Two different specific kinds of sample standardized mean differences for univariate group mean contrasts are described, Hedges's g and Glass's A. For reasons given, g may be the most generally useful. The population parameter estimated by g is 8 = (|ii - \LI)!G, where the denominator is the common population standard deviation; that is, it is assumed that (?i = 02 = G. The equation for g is
(4.4,
where the standardizer is the square root of the pooled within-groups variance, Sp. The latter is an unbiased estimator of a2 and assumes homogeneity of population variance. Its equation is
EFFECT SIZE ESTIMATION IN COMPARATIVE STUDIES
101
2_SSW^
**
d/\)j7
(ni- l ) s f + (n 2 - 1) s z HI + n2 - 2
where SS\^ and d/w are, respectively, the total within-groups sums of squares and degrees of freedom, HI and n2 are the group sizes, and sf and s2 are the group variances. Another way to compute g requires only the group sizes and the value of the independent samples t statistic for a nil hypothesis (see Equation 2.25):
(4.6) This equation is handy when working with secondary sources that do not report sufficient group descriptive statistics to use Equations 4-4 and 4.5. Solving Equation 4.6 for t represents this test statistic as the product of g, a standardized effect size index, and a function of sample size (see chap. 2, this volume). It is also possible to transform the correlation rpt to g for the same data:
Hedges's g is a positively biased estimator of 8. However, the magnitude of this bias is slight unless the group size is quite small, such as n < 20. Hedges (1982) gave the following approximate unbiased estimator of 8:
where the expression in parentheses in Equation 4-8 is a correction factor applied to g. For n = 10, for example, the correction factor equals .9578, but for n = 20 it is .9801. For even larger group sizes, the correction factor is close to 1.0, which implies little adjustment for bias. Before we can go further, we must deal with a notational problem about sample standardized mean differences. Many people use the term Cohen's d to refer to Hedges's g or other sample standardized mean differences. This association is probably based on J. Cohen's (1988) book about power analysis, but it is technically incorrect. This is because the symbol d in J. Cohen's book refers to 6, the population standardized mean difference, whereas the symbol d$ in the same work refers to the statistic g. To make matters even more confusing, some authors such as R. Rosenthal et al. (2000) use the term Cohen's d to refer to the sample statistic (Mj — M2)/Sp, where the
102
PARAMETRIC EFFECT SIZE INDEXES
denominator is the square root of SS\^/N. In contrast, the denominator of g is SP, the square root of SSw/dfw (see Equation 4.5). Because Sp is generally smaller than SP for the same data, it is also true that (Mj - M2)/Sp is generally larger than g = (Mj - M2)/sp in absolute value. However, values of the two statistics just mentioned are similar except in small samples, and they are asymptotically equal in large samples. For these reasons, we do not consider the statistic (M\ - M2)/Sp in later discussions. The parameter estimated by Glass's A is the ratio of the population mean contrast over the standard deviation of just one of the populations, usually that of the control condition. In this case A estimates 6 = (Ha - lizV^controb and the equation for A is
A = Ml^k
(4.9)
^control
Because the standardizer of A comes from only one group, homogeneity of variance is not assumed. Glass's A may be preferred over Hedges's g when a treatment is expected to affect both central tendency and variability. Suppose most treated cases improve, others show no change, but some get worse, perhaps because of the treatment itself. Such a pattern may increase the variability of treated cases compared to untreated cases. Glass's A based on the control group standard deviation describes in this case the effect of treatment only on central tendency. Suppose that the two groups do not correspond to treatment versus control and their variances are heterogeneous, such as s\ = 400.00 and $2 = 25.00. Rather than pool these dissimilar group variances for g, the researcher opts for A. Now, which group standard deviation goes in the denominator? The choice is critical because it determines the value of A. For example, given M! - M2 = 5.00, the two possible results for this example are AI = 5.00/400.001/2 = .25 and
A2 = 5.00/25.001/2 = 1.00 The statistic A2 indicates a mean difference four times larger in standard deviation units than Aj. However, both results are equally correct if there are no conceptual grounds to choose one group standard deviation or the other as the standardizer. It would be best in this case to report both possible values of A, not just the one that gives the most favorable result. When the group variances are reasonably similar, g is preferred over A. This is because the standardizer of g is based on more information, the EFFECT SIZE ESTIMATION IN COMPARATIVE STUDIES
103
TABLE 4.2 Means and Variances for Two Independent Samples Condition
M s2
13.00 7.50
11.00 5.00
variances of two groups instead of just one. If the ratio of the largest over the smallest group variance exceeds, say, 4-0, then pooling them makes less sense, so Glass's A may be preferred in this case. Olejnik and Algina (2000) noted that the denominators of g and A estimate the full range of variation for experimental factors, but perhaps not for individual-difference factors. Suppose that women and men are compared on a quantitative variable. If there is a gender effect, both the pooled within-groups variance SP and the separate group variances reflect a partial range of individual differences. The full range is estimated by the total variance sj- = SSj-/dfj-, where the numerator is the total sum of squares across both genders and the denominator is the total degrees of freedom, N - 1. Gender-mean contrasts standardized against ST would be smaller in absolute value than when the standardizer is Sp for g or the standard deviation of either women or men for A, assuming a gender effect. Although it is not common practice to compute standardized mean differences in two-group designs as (Mj - M2)/Sj, readers should be aware of this option. However, whether denominators of d estimate partial versus full ranges of variability is a crucial problem in factorial designs (chap. 7, this volume). Table 4.2 presents descriptive statistics for two independent samples, where MI - M.2 = 2.00 and Sp = 6.25. Table 4.3 reports results of the t test and values of the d statistics described previously for the data in Table 4.2 at three different group sizes, n = 5, 15, and 30. The t test clearly shows the influence of group size. In contrast, g = .80 for all three analyses and is in general invariant to group size, keeping all else constant, including the relative proportion of n\ to n2 in unbalanced designs. The approximate unbiased estimator 8 is generally less than g, but their values converge as n increases. The two possible values of A for these data are AI = .73 based on $1 = 7.501'2 = 2.74 from the first group and A2 = .89 based on $2 = 5.001/2 = 2.24 from the second group. Two Dependent Samples Recall from chapter 2 that the symbols (ip and Mp are used in this book to refer, respectively, to the population-dependent mean contrast and
104
PARAMETRIC EFFECT SIZE INDEXES
TABLE 4.3 Results of the f Test and Effect Size Indexes at Three Different Group Sizes for the Data in Table 4.2 Group size (n) Statistic
5
15
30
1.26 8 .243
2.19 28 .037
3.1 58 .003
Standardized mean differences g .80 5 .72 AT .73 A2 .89
.80 .78 .73 .89
.80 .79 .73 .89
Point-biserial correlation rpb
.38
.38_
ftest t dfw p
.41
Note. For all analyses, M-\ - Mz = 2.00 and sj; = 6.25, and p values are two-tailed for a nil hypothesis.
a sample estimator of U,j> Standardized mean differences in correlated designs are also called standardized mean changes or standardized mean gains. There are two different methods to standardize an observed mean contrast in these designs. The first method does so just as one would in a design with independent samples. For example, one possibility is to calculate Hedges's g. This statistic in a correlated design is computed as g = MD/SP, where the denominator is the pooled within-conditions standard deviation that assumes homogeneity of variance (Equation 4.5). The parameter estimated by g in a correlated design is 5 = |4,D/8, where the denominator is the common population standard deviation, just as in an independent samples design. However, the homogeneity assumption may not be tenable in a repeatedmeasures design when treatment is expected to appreciably change the variability among cases from pretest to posttest. A better alternative in this case is Glass's A, where the denominator in a correlated design is the standard deviation from the pretest condition, which estimates population variability before treatment. Please note that S. Morris (2000) referred to the statistic just described, MD/SI, as Becker's g instead of Glass's A. The second method to compute a standardized mean change in a correlated design is to divide Mp by SD, the standard deviation of the difference scores. This standard deviation takes account of the cross-conditions correlation r\i (Equation 2.15), but the standard deviations SP and s\ (or $2) do not. (They actually assume it is zero.) If r\i is reasonably high and positive, it can happen that SD is quite smaller than the other standard deviations just mentioned. This implies that the standardized mean change
EFFECT SIZE ESTIMATION IN COMPARATIVE STUDIES
105
based on SD can be quite larger than in absolute value than the standardized mean change based on either SP or s± (or 52) for the same contrast. The ratio MD/SD also estimates a different parameter compared to g and A. It is
8 =
. 0^/2(1-Piz)
fe
(4.10)
where O and p^ are, respectively, the common population standard deviation and cross-conditions correlation. Please note in this equation that the denominator is less than 0 when pu > -50. In contrast, g estimates the parameter (J-oM in a correlated design. A drawback to calculating standardized mean changes in correlated designs as MD/sD is that the scale of SD is that of the difference scores, not the original scores. An example from Gumming and Finch (2001, pp. 569-570) illustrates this problem: A verbal ability test is administered before and after an intervention to the same people. Standard scores on the test are based on the metric where in the general population the mean is 100.00 and the standard deviation is 15.00. The observed standard deviations in the study at both occasions are also 15.00 (i.e., sj = S2 = SP = 15.00). The standard deviation of the difference scores across the two occasions is SD = 7.70, about half that of the original scores. The observed mean change is MD = 4.10 in favor of the intervention. If our natural reference for thinking about scores on the verbal ability measure is their original standard deviation, it makes most sense to report a standardized mean change as 4.10/15.00 = .27 instead of as 4.10/7.70 = .53. This is true even though the latter standardized effect size estimate is about twice as large as the former. Glass, McGaw, and M. Smith (1981) and others suggested that the choice in correlated designs between a standardizer based on original scores versus difference scores should reflect substantive considerations in the research area. For example, a standardized mean change based on SD may be preferred in an intrinsically repeated-measures design where the emphasis is on the measurement of change. In contrast, Cortina and Nouri (2000) argued that d should have a common meaning regardless of the design, which implies that the standardizer in correlated designs should be in the metric of the original scores. This advice seems sound for nonintrinsically repeated-measures designs where the same factor could theoretically also be studied with unrelated groups. This is the approach emphasized in this book. With two exceptions, Equations 4-4 through 4.9 for standardized mean differences in independent samples designs can be used to calculate standardized mean changes in correlated designs. The first exception is Equation 4.6, which generates Hedges's g from the independent samples t statistic. Dunlap, Cortina, Vaslow, and Burke (1996) show that the corresponding equation in a correlated design is
106
PARAMETRIC EFFECT SIZE INDEXES
where the test statistic in Equation 4.11 is the dependent samples t statistic for a nil hypothesis (see Equation 2.26). For the special case where s\ = s\, Equation 4-11 reduces to g = t [2(1 - r^/ia]1 . The second exception is Equation 4.7, which coverts rpt to g, but rp(, is for independent samples. Other kinds of correlation effect sizes for correlated designs are discussed later. Table 4-4 presents a small data set, where MI - M2 = 2.00, SP = 6.25, and n = 5. If we assume that scores in each row come either from the same case or from matched cases, then r\i = .735 and SD = 3.50. The dependent samples t statistic for a nil hypothesis for these data is t (4) = 2.38. Hedges's g for these data is
g = 2.00/6.251/2 = 2.38 {[2 (3.50)]/[5 (7.50 + 5.00)]}1/2 = .80 which is the same result in Table 4.3 for the independent samples analysis of the same group means and variances for n = 5. The standardized mean change based on SD is 2.00/3.501/2 = 1.07, which as expected is greater than g for the same contrast. The following sections deal with interval estimation based on standardized mean differences. The first section covers traditional confidence intervals for 8, and the second section deals with exact confidence intervals for 5. The method of bootstrapping provides an alternative way to obtain confidence intervals based on observed effect sizes (see chap. 9, this volume).
TABLE 4.4 Raw Scores and Descriptive Statistics for Two Samples Condition
M s2
1
2
9 12 13 15 16
8 12 11 10 14
13.00 7.50
11.00 5.00
Note. In a dependent samples analysis, r12 = .735 and SD = 3.50.
EFFECT SIZE ESTIMATION IN COMPARATIVE STUDIES
107
Traditional Confidence Intervals for 8 Distributions of d are complex because these statistics estimate the ratio of two different parameters, the population mean contrast and a population standard deviation (Equation 4.1). Therefore, a traditional confidence interval for 8 is approximate. The width of a traditional confidence for 5 is the product of the appropriate two- tailed critical value of the central test statistic Z (i.e., the normal deviate) and an asymptotic standard error. The latter is the estimated standard error of d in a large sample. The general form of a traditional confidence for 8 is 2^il, a)
±
(4.12)
where sj is the asymptotic standard error of d and %-tail, a is the positive two-tailed critical value of z at the a level of statistical significance. Table 4.5 lists three equations for asymptotic standard errors of Hedges's g and Glass's A. The first two equations in the table assume independent samples, but the third equation for g takes account of the cross-conditions correlation ri2 when the means are dependent. Two examples of the use of these equations to construct approximate 95% confidence intervals for 8 are presented next. Suppose that n = 30 for each of two unrelated samples and g = .80 for the observed mean contrast. Using Equation 4.6, we can determine that t (58) = 3.10 for these data. We estimate the standard error of g with the first equation in Table 4.5 as:
sgl = [.802/(2 x 58) + 60/(30 x 30)]1/2 = .07221/2 = .2687 TABLE 4.5 Asymptotic Standard Errors for Standardized Mean Differences Statistic
Equation Means treated as independent
I g2 \2dfW
+
0 are positively skewed, and noncentral t distributions where ncp < 0 are negatively skewed (see chap. 2, this volume). Assuming an independent samples design, the value of ncp for noncentral t is related to the population effect size 8 = (|li - M^A? and the group sizes as follows:
n2
(4.13)
When the null hypothesis is true, 8 = 0 and ncp = 0; otherwise, 8^0 and ncp has the same sign as 8. Equation 4-13 can be rearranged to express the population effect size as a function of the noncentrality parameter and group size:
8 = ncp \P—^
(4-14)
Steiger and Fouladi (1997) showed that if we can obtain a confidence interval for ncp, then we can also obtain a confidence interval for 8 using the confidence interval transformation principle (see chap. 2, this volume). In theory, we first construct a 100 (1 - d)% confidence interval for ncp based on the data. The lower and upper bounds of this interval are in ncp units. Next we convert the lower and upper bounds of the interval for ncp using Equation 4.14 to 8 units. The resulting interval is the 100 (1 - tx)% confidence interval for 8. In practice, though, it is not straightforward to construct a confidence interval for ncp, at least not without a computer program. The lower bound of a 100 (1 - oc)% confidence interval for ncp, ncpi, is the value of the noncentrality parameter for the noncentral t distribution in which the observed t statistic (i.e., from the independent samples t test) falls at the 100 (1 -OC/2)th percentile. The upper bound, ncp\j, is the value of the noncentrality parameter for the noncentral t distribution in which the observed t falls at the 100 (ct/2)th percentile. If oc = .05, for example, then the observed t falls at the 97.5th percentile in the noncentral t distribution where the noncentrality parameter equals ncpL. The same observed t also falls at the 2.5th percentile in the noncentral t distribution where the noncentrality parameter equals ncp\j. However, we need to find which partic110
PARAMETRIC EFFECT SI2E INDEXES
ular noncentral t distributions are most consistent with the data, and it is this problem that can be solved with the right computer program. The use of three different programs to do so is demonstrated next. Suppose that n = 30 for each of two unrelated samples, g = .80 and t (58) = 3.10. (These are the same data for the first example in the previous section.) J. Steiger's Power Analysis module of STATISTICA (StatSoft Inc., 2003) has a distribution calculator for noncentral t, F, and %2 distributions. It is easy to use because of a relatively simple graphical user interface. To get the lower bound of the 95% confidence interval for ncp for this example, just enter observed t = 3.10, df = 58, and cumulative probability = .975 in the appropriate boxes under the parameters heading, click the "delta" radio button under the "compute" heading to specify estimation of the noncentral ity parameter, and then click the compute button to the far right. (Delta refers to the noncentrality parameter in this program.) The number 1.04844 will then appear in the box for delta. In other words, the observed statistic 3.10 falls at the 97.5th percentile in the noncentral t distribution, where df = 58 and the noncentrality parameter equals 1.04844. The latter is also the lower bound of the 95% confidence interval—that is, ncpi = 1.04844. To get the upper bound of the 95% confidence interval for ncp, repeat the previous steps, except enter .025 in the cumulative probability box under the parameters heading. After clicking on the compute button, the number 5.12684 will appear in the delta box. This result says that the observed statistic 3.10 falls at the 2.5th percentile in the noncentral t distribution where df = 58 and the noncentrality parameter is 5.12684The latter is also the upper bound of the 95% confidence interval— that is, ncpu = 5.12684. The 95% confidence interval for ncp for this example is thus 1.048445.12684. Equation 4.14 shows us that multiplying each of these endpoints by the following quantity [(30 + 30)/(30 x 30)]1/2 = .25820 converts them to 8 units. The resulting interval, .27071-1.32374—or .271.32 at two-decimal accuracy—is the exact 95% confidence interval for 8. Thus, the observed effect size of g = .80 is just as consistent with a population effect size as low as 8 = .27 as it is with one as high as 8 = 1.32, with 95% confidence. This rather wide range of imprecision is a result of the relatively small sample size (N = 60). The traditional 95% confidence for 8 calculated in the previous section for the same data is .47-1.13. The approximate interval is narrower, but it assumes a large sample. A second computer tool that is handy for constructing confidence intervals for 8 is the SAS noncentrality function TNONCT in the EFFECT S/2E ESTIMATION IN COMPARATIVE STUDIES
111
SAS/STAT program (SAS Institute, 2000). This function returns the value of the noncentrality parameter given the observed t, its df, and a specified percentile in a noncentral t distribution. Some programming in SAS syntax is required, but it is not too difficult for a two-group design. The top part of Table 4.6 presents the SAS syntax for calculation of the lower and upper bounds of exact 95% confidence intervals for ncp and 8 using the data from the earlier example. The bottom part of Table 4.6 reports the output from SAS/STAT after running the program listed in the top part of the table. The exact 95% confidence interval for 5 calculated by SAS/STAT for the example data, .27071—1.32374, is the same result we calculated earlier using a different computer tool. The SAS syntax in Table 4.6 can be reused by substituting the values in boldface with the appropriate values from a new sample. Two other computer tools do all the work for you—that is, they directly calculate endpoints of exact confidence intervals in 8 units. These programs include the STATISTICA Power Analysis module, which can also calculate noncentral confidence intervals for several different kinds of population
TABLE 4.6
SAS Syntax to Compute an Exact 95% Confidence Interval for 8 in Designs With Two Independent Samples and Output Syntax data noncentral_ci_for_delta; /* two-group design */ /* data */ t=3.10; df=58; nl=30; n2=30; /* lower, upper bounds for ncp */ ncp_lower=tnonct(t,df,.975); ncp_upper=tnonct(t,df,.025); /* lower, upper bounds for delta */ delta_lower=ncp_lower*sqrt((nl+n2)/(nl*n2)); delta_upper=ncp_upper*sqrt((nl+n2)/(nl*n2)); output; run; proc print; run; Output
Obs 1
112
t 3.1
df 58
nl 30
n2 30
ncp_ lower 1.04844
ncp_ upper 5.12684
PARAMETRIC EFFECT SIZE INDEXES
delta_ lower 0.27071
deltaupper 1.32374
effects sizes, including for 8 in one- and two-sample designs. Another program that calculates exact confidence intervals for 8 in the same designs is Exploratory Software for Confidence Intervals (ESC1; Gumming, 2002),2 which runs under Microsoft Excel. The ESCI program is also structured as a tool for teaching concepts about noncentral test statistics, confidence intervals, and meta-analytic thinking. Both programs just mentioned assume that the observed effect size is Hedges's g when there are two unrelated samples. In a correlated design, both programs calculate exact confidence intervals for 8 only when the mean contrast is standardized against SD, the standard deviation of the difference scores. Gumming and Finch (2001) noted that distributions of dependent-mean contrasts standardized against either SP, the pooled within-groups standard deviation, or against the standard deviation of one of the individual groups are complex and follow neither central nor noncentral t distributions. An approximate confidence interval is needed in this case (see the previous section). Limitations Possible limitations of d statistics considered next apply to all designs considered in this book, not just two-sample designs. Heterogeneity of within-conditions variances across studies can limit the value of d as a standardized effect size index. Suppose that MI - M.2 = 5.00 in two different studies with the same outcome variable. The pooled within-conditions variance in the first study is 625.00 but is only 6.25 in the second. As a consequence, Hedges's g for these two studies reflects the difference in their variances:
& = 5.00/625.001/2 = .20 and
g2 = 5.00/6.251/2 = 2.00 These results indicate a mean difference tenfold standard deviations greater in the second study than in the first, even though both statistics refer to the same mean contrast. In this case, the unstandardized result MI - M2 = 5.00 is a better statistic to compare across the two studies than d. This suggestion is also consistent with a preference for unstandardized statistics when comparing results of regression analyses across samples with appreciably unequal variances. 2
A trial version can be downloaded from http://www.latrobe.edu.au/psy/esci/index.html
EFFECT SIZE ESTIMATION IN COMPARATIVE STUDIES
11 3
The relative insensitivity of d statistics to sample size is a potential shortcoming. Suppose that Hedges's g = 2.00. According to interpretive conventions discussed later, a group mean difference of this magnitude may indicate a "large" difference. However, if we then learn that n = 5, we should not get too excited about this result until it is replicated, among other considerations. Other limitations of effect size indexes in general are considered later.
MEASURES OF ASSOCIATION The r family effect size indexes discussed next assume a fixed factor. In a squared metric they all estimate T\2 with positive bias. Later chapters introduce bias-adjusted measures of association and special indexes for random factors. Two Independent Samples The observed strength of the relation between a dichotomous factor and a continuous outcome is measured by the point-biserial correlation, rpt,. It can be derived using the standard equation for the Pearson correlation r if group membership is coded as 0 or 1 or any two different numbers. However, it may be more convenient to use one of the methods described next. A conceptual equation is (4.15) where (SSj/N)^2 is the standard deviation of the total dataset computed with the sample size in the denominator and p and q are the proportions of cases in each group (p + q = 1.0). Note that the expression in Equation 4.15 in parentheses is actually a d statistic, where the standardizer estimates the full range of variability on the outcome variable. It is the multiplication of this d statistic by the standard deviation of the dichotomous factor, (p <j) > that transforms the whole expression to correlation units. The sign of rpi-, is arbitrary because the direction of the subtraction between the two means is arbitrary. Always indicate the meaning of the sign of rpt,. It may be handier to compute rpj, from the independent samples t statistic for a nil hypothesis: (4.16)
114
PARAMETRIC EFFECT SIZE INDEXES
The absolute value of rpt can also be derived from the independent samples F test of the mean contrast: S$A
r b| = AF^ M = A^ = * p 'VF + dfo-'VssT
(4.i7)
Equation 4.17 shows rpb as a special case of f|, which is the square root of the ratio of the between-groups sums of squares, SS&, over the total sum of squares. (Equation 4.17 also shows that rpb = fj2 in a two-group design.) Unlike rpb, however, f| is an unsigned correlation, so it is insensitive to the direction of the mean difference. It is also possible to convert Hedges's g to rpb: 8 rpb = 2 Vg + dfw (1/ni +
(4.18)
Equation 4-18 is useful when a secondary source reports g in a two-sample design but a correlation effect size is desired. The population parameter estimated by rpb is T)2, which for a design with a single fixed factor A and a > 2 independent samples takes the form
(4.19)
where the numerator is the variance of the population means |4,i, (J-2, ••-. M^ around the grand mean (J,, and the denominator is the total variance of all scores around \l. The difference <s\ot - <S\ equals O^, the variance of the scores taken about their respective population means (the within-population variance); it is also the error variance. The parameter T|2 is thus the proportion of total variability that is accounted for by population means. The terms that make up T| are population variance components, and the whole ratio T| = OH/CTJO,. is estimated with positive bias by fj = SS^/SSj. We will see in later chapters that there are other estimators of the proportion of total explained variance besides fj that are adjusted for bias (e.g., CO ) or suitable for designs with random factors. In some sources it is said that the maximum absolute value of rpt, is about .80. However, this is true only if groups were formed by dichotomizing a continuous independent variable (Hunter & Schmidt, 1990). This practice is generally not a good idea—MacCallum, Zhang, Preacher, and Rucker (2002) showed that dichotomizing continuous predictors may lead to inaccurate estimates of their true relation with outcome. However, similar problems
EFFECT SIZE ESTIMATION IN COMPARATIVE STUDIES
115
can arise when continuous predictors are categorized to form more than just two levels. Quantitative predictors are better analyzed with regression than ANOVA (see chap. 2, this volume). If groups are formed by random assignment or by a characteristic of the cases, absolute values of rpt can approach 1.00. The correlation rpb is affected by the proportion of cases in one group or the other, p and q. It tends to be highest in balanced designs. As the design becomes more unbalanced, holding all else constant, rpb approaches zero. Suppose that MI - M2 = 5.00 and (SST/N)1/Z = 10.00 in each of two different studies. The first study has equal group sizes, or p\ = q\ = .50. The second study has 90% of its cases in the first group and 10% in the second group, or p2 = .90 and Mt for two unrelated groups. The expected average difference between pairs of random scores from the two groups equals the lower mean subtracted from the upper mean, M2 — Mj, and the variance of the differences is the sum of the within-groups variances, s\ + s\. If both distributions are normal, the theoretical differences are normally distributed, too. Within this theoretical distribution, one finds the z equivalent of a difference score of zero, which is
ZCL =
0 - (M2 - Mt) , —
(4.25)
Differences between pairs of random scores above the point marked by ZCL are au positive, which implies X2 > X\. Thus, the total proportion of observations to the right of ZCL in a normal curve is the probability that a random score from the upper group exceeds one from the lower group. EFFECT SIZE ESTIMATION IN COMPARATIVE STUDIES
127
Let us calculate ZCL f°r trie data from Maccoby and Jacklin (1974) described earlier, where Mw = 103.00, si = 219.00, MM = 100.00, and s& = 202.00: ZCL = -(103.00 - 100.00)/(219.00 + 202.00)1/2 = -3.00/421.001/2 = -.15 The proportion of scores to the right of z = —.15 in a normal curve is .5596, so CL = .56. Thus, in any random pairing of young people of different gender, the probability that the woman has the higher verbal ability score is .56. See McGraw and Wong (1992) for additional examples. McGraw and Wong (1992) studied the effects of skew, kurtosis, and heterogeneity of variance on the accuracy of CL values generated by the computational method described earlier. Given moderate skew or kurtosis and within-groups variances that differed by a factor of up to 4.0, they found that the absolute error in CL was generally less than .10. Of course, even more extreme departures from normality or homogeneity of variance may lead to even greater error. Error Rates in Classification Analysis Hess, Olejnik, and Huberty (2001) described the application of two different statistical methods that estimate the degree of group overlap through classification analysis. These methods for two-group univariate comparisons are univariate discriminant function analysis (DFA)—also known as predictive discriminant analysis or just discriminant analysis—and logistic regression (LR). Both methods can be extended to compare more than two groups across more than one variable (i.e., they are multivariate methods). It is beyond the scope of this section to describe these methods in detail, but the assumptions of DFA are generally more strict. These include normal distributions and homogeneity of population variances and covariances. See Silva and Stam (1995) and Wright (1995) for more information about DFA and LR. In both univariate DFA and LR, group membership is considered the criterion and the continuous variable the predictor, which is opposite of their usual status in techniques such as ANOVA. Both methods also optionally include a classification phase in which conditional probabilities of group membership are estimated for every case. These predicted probabilities are based in part on the degree of overlap between the group frequency distributions. Suppose that a particular case is estimated to be more similar to cases in its own group than to those in the other group. The observed and predicted group memberships for this particular case are the same, so the classification is correct. Two groups are perfectly distinct at the case level if the percentage of correct classification across all cases—the hit rate—is 100%. Perfect classi] 28
PARAMETRIC EFFECT SIZE INDEXES
fication also means an error rate of zero. As distribution overlap increases, there will be more and more cases where the observed and predicted group memberships disagree. Maximum overlap between two groups is indicated by a hit rate that is no higher than that expected by chance (random classification). Huberty and Lowman (2000) described the case-level statistic I that measures improvement over chance classification. Its general form is , _ (1 - He) - (1 - HQ) _ H0 - He
l-He
l - He
where H0 and 1 - H0 are, respectively, the observed cross-group hit rate and error rates, and He and 1 — He are, respectively, the corresponding rates expected by chance. That is, I estimates the proportionate reduction in the error rate compared to that of random classification. One definition of He given by Huberty and Lowman is the proportional chance criterion, which says that the chance hit rate equals the sum of the products of the prior probabilities of the group and their sizes divided by the total number of cases across all groups. Prior probabilities are the expected relative sizes of the populations from which the samples were drawn. They are expressed as proportions and sum to 1.0 across the groups. For a two-group design: He =
(4.27)
where pr^ and pr2 are the prior probabilities of the two groups. For example, given pr\ = .50, n\ = 100, pr2 = .50, and n2 = 75 and assuming random classification, the expected chance hit rate is He = [.50 (100) + .50 (75)]/175 = 87.50/175 = .50 and the expected chance error rate is also .50. If the observed cross-group classification hit rate is .60, then I = (.60 - .50)/.50 = .20 which says that the observed error rate of .40 is 20% less than that expected by random classification. Huberty and Lowman suggested that I < .10 may indicate a "low" (smaller) effect, whereas I > .35 may indicate a "high" (larger) effect, both at the case level. Some cautions about guidelines for interpreting qualitative effect size magnitudes are discussed momentarily. EFFECT SIZE ESTIMATION IN COMPARATIVE STUDIES
129
RELATION OF GROUP-LEVEL EFFECT SIZE TO CASE-LEVEL PROPORTIONS Under the assumptions of normality, homogeneity of variance, and large and equal group sizes, the case-level proportions described earlier are functions of effect size magnitude at the group level. The first column in Table 4.8 shows selected values of d in the range 0-4.00. (Because Hedges's g and Glass's A are asymptotically equal under these assumptions, no distinction is made between them.) Listed in the remaining columns of the table are values of rpt, and case-level proportions that correspond to d in each row under the conditions stated earlier. Reading each row of the table gives a case-level perspective on a group mean difference of a particular magnitude. For example, if d = .50, the expected value of rpb is .24 (6% explained variance). For the same effect size, we expect at the case level that: 1. About one third of all scores are not in the area of overlap between the two frequency distributions (Ui = .33). 2. The upper 60% of the scores in the group with the highest mean exceeds the same proportion in the other group (L/2 = .60). 3. The typical score in the upper group is higher than about 70% of the scores in the lower group (L/3 = .69). 4. A random score from the upper group will exceed a random score from the other group about 64% of the time (CL = .64). 5. A score from the upper group is a little more than twice as likely to fall more than one standard deviation above the grand mean than a score from the lower group (RTR = 2.17). However, the relations summarized in Table 4.8 hold only under the assumptions of normality, homogeneity of variance, and a balanced design with large samples. Otherwise it can happen that the group statistics d or rpb tell a different story than case-level proportions. Consider the situation illustrated in Figure 4.4 for two symmetrical distributions. The distributions have the same central tendency, so d = rp^ = 0. However, the tail ratios are not also generally 1.00. Because the first distribution is more variable than the second, scores from it are overrepresented in both extremes of the combined distribution. If the researcher wants only to compare the central tendencies, this disagreement between the tail ratios and the group statistics d and rpt may not matter. In a selection context where a cutting point is based on the combined distribution, the tail ratios would be of critical interest. 130
PARAMETRIC EFFECT SIZE INDEXES
TABLE 4.8 Relation of Selected Values of the Standardized Mean Difference to the Point-Biserial Correlation and Case-Level Proportions Case level
Group level
M, 0 .10 .20 .30 .40 .50 .60 .70 .80 .90
1.00 1.25 1.50 1.75 2.00 2.50 3.00 3.50 4.00
0 .05 .10 .15 .20 .24 .29 .33 .37 .41 .45 .53 .60 .66 .71 .78 .83 .87 .89
0
.007 .148 .213 .274 .330 .382 .430 .474 .516 .554 .638 .707 .764 .811 .882 .928 .958 .977
.500 .520 .540 .560 .579 .599 .618 .637 .655 .674 .691 .734 .773 .809 .841 .894 .933 .960 .977
.500 .540 .579 .618 .655 .691 .726 .758 .788 .816 .841 .894 .933 .960 .977 .994 .999
a a
CL
RTR
.500 .528 .556 .584 .611 .638 .664 .690 .714 .738 .760 .812 .856 .892 .921 .961 .983 .993 .998
1.00 1.16 1.36 1.58 1.85 2.17 2.55 3.01 3.57 4.25 5.08 8.14 13.56 23.60 43.04
b b b b
Note. CL = common language effect size; RTR = right tail ratio for a cutting point one standard deviation above the grand mean. a b > .999. > 99.99.
Group 2
Group 1
Ml =M2 Figure 4.4. Two distributions with the same central tendency but different variances.
EFFECT SIZE ESTIMATION IN COMPARATIVE STUDIES
131
INTERPRETIVE GUIDELINES FOR EFFECT SIZE MAGNITUDE AND CAUTIONS This section provides guidelines for interpreting effect size indexes and also some possible shortcomings of these guidelines. I also consider how to avoid fooling yourself in effect size estimation. Questions When researchers first learn about effect size indexes such as d or rpb, some of the questions they ask are, What is a large effect? A small effect? A substantive (important) effect?]. Cohen (1988) devised what are probably the best known guidelines for describing qualitative effect size magnitudes that seem to answer the first two questions. The descriptor medium in these guidelines corresponds to a subjective average effect size magnitude in the behavioral science literature. The other two descriptors are intended for situations where neither theory nor previous empirical findings differentiate between small versus large effects. These guidelines are also fraught with the potential problems noted by J. Cohen and mentioned later. Table 4.9 presents J. Cohen's interpretive guidelines for absolute values of d and rp(, assuming normality, homogeneity of variance, and large and equal group sizes. To summarize, 1. A small-sized mean contrast corresponds to d = .20 or rpb = .10 (1% explained variance); 2. A medium-sized difference corresponds to d = .50 or rp\, = .25 (6% explained variance); and 3. A large-sized difference corresponds to d = .80 or rpb = .40 (16% explained variance). For the sake of comparison, J. Cohen's interpretive guidelines for the Pearson correlation r are also shown in Table 4-9. Cautions Cautions about the interpretive guidelines in Table 4-9 are summarized next: 1. These guidelines are not empirically based. This is why J. Cohen encouraged researchers to look first to the empirical literatures in their areas before using them. 2. The descriptors small, medium, and large are not intended to be applied rigidly. For example, it would be silly to refer to d = .49 in one study as a small-sized effect but to d = .51 in 132
PARAMETRIC EFFECT SIZE INDEXES
TABLE 4.9
J. Cohen's Interpretive Guidelines for Standardized Mean Differences and Correlations Qualitative description Small Medium Large
3.
4.
5.
6.
7.
Statistic
d
rpb
r
.20 .50 .80
.10 .25 .40
.10 .30 .50
another study as a medium-sized effect. Rigid thinking about effect-size magnitudes should be avoided. If the group sizes are unequal or the distributions have different shapes, the relation between d and rp), assumed in Table 4.9 may not hold. For example, it is possible to find d = .50 and rpt, = .10 for the same mean contrast. The former corresponds to a medium-sized effect under J. Cohen's guidelines, but the latter corresponds to a small-sized effect. However, both statistics describe the same result. The definitions do not apply across all behavioral research areas. This is because what may be considered a large effect in one area may be modest in another. The definitions in Table 4.9 may be more suitable for nonexperimental studies than experimental studies. Typical effect size magnitudes may be greater in experimental studies because of lower error variance. In more mature research areas, meta-analytic studies offer the most convenient and systematic way to operationally define smaller versus larger effect sizes (chap. 8, this volume). If no meta-analytic studies are available, the researcher may be able to compute effects sizes indexes for published studies. Only in new areas with few published studies may there be little choice other than to use generic interpretive guidelines. The real benefit from reporting standardized effect sizes comes not from comparing them against arbitrary guidelines but instead from comparing effect sizes directly with those reported in previous studies (B. Thompson, 2002b; Wilkinson & TFSI, 1999). This is part of meta-analytic thinking.
What Is a Substantive Effect? The third question about effect size magnitude listed at the beginning of this section—what is a substantive result?—is probably the toughest. EFFECT SIZE ESTIMATION IN COMPARATIVE STUDIES
133
This is because demonstration of an effect's significance, whether theoretical, practical or clinical, calls for more discipline-specific expertise than the estimation of its magnitude (Kirk, 1996). For example, an effect that could be described as large according to the guidelines in Table 4.9 may not also have substantive significance. For example, the average gender difference in height is about two standard deviations in magnitude (d = 2.00). Is this large difference also a substantive one? The answer clearly depends on the research context. In terms of general psychological adjustment, the large gender difference in height is probably irrelevant. In the context of automobile safety, however, the gender difference in height may be critical. Remember a problem with the front air bags in automobiles manufactured before the late 1990s: Their deployment force could injure or kill a small-stature driver or passenger, which presents a greater risk to women. In cars with "intelligent" air bag systems that vary deployment force according to driver weight, a large gender difference in height is less important. By the same logic, effects gauged to be small according to Table 4-9 are not necessarily unimportant. Prentice and D. T. Miller (1992) described contexts for when small effects may be noteworthy. These include situations where minimal manipulation of the independent variable results in some change in the outcome variable—that is, a small cause size nevertheless produces an observable effect size—or an effect is found for an outcome variable that is theoretically unlikely to be influenced by the factor. It can also happen that effect sizes in early stage research are larger than in later research. This may occur as researchers shift their attention from determining whether an effect exists to study of more subtle mechanisms of the effect at boundary conditions (Fern &. Monroe, 1996). Recall the concern that variance-accounted-for effect sizes (measures of association in a squared metric) can make some effects look smaller than they really are in terms of real importance. It is not uncommon for some health-related effects, such as that of taking aspirin daily to reduce the risk of a cardiac condition, to explain only about 2% of the total variance. Some important and beneficial public health policies have been made on the basis of such "weak" effects (Gage, 1978). In general, effect size magnitudes that are "unimportant" may be ones that fall within the margins of measurement error. Even this general definition does not always hold, however. For example, the difference in vote totals for the two major candidates in the 2000 presidential election in the United States was within the margin of error for vote counting in certain key precincts, but these small differences determined the outcome. In contrast, effect sizes magnitudes that are important should not only stand out from measurement error, they must also have theoretical, practical, or clinical implications given the research context. Unfortunately, just as there is no absolute standard for discriminating between small versus large effects, there
134
PARAMETRIC EFFECT SIZE INDEXES
is also none for determining whether a particular effect size is important applicable across different research areas. Part of the challenge of a new research area is to develop benchmarks for theoretical or practical significance. An awareness of typical effect size magnitudes in one's research area helps as does an appreciation of the need to examine effects at both the group and case levels. The idea of clinical significance needs some elaboration. There is a specific set of methods for evaluating clinical significance. As the name suggests, the term ciinica! significance refers to whether an intervention makes a meaningful difference in an applied setting. A related idea is whether, after treatment, a typical afflicted case is indistinguishable from a typical nonafflicted case (P. Kendall & Grove, 1988). Clinical significance can be evaluated at both the group and case levels. There are specific statistical conventions for describing clinical significance at the group level. They involve criterion contrasts between two groups that represent a familiar difference on an outcome variable of interest, such as patients with the same illness who have the most severe symptoms versus those with the least severe symptoms or patients who require inpatient treatment versus outpatient treatment (Lipsey & Wilson, 2000). A variation is a normative contrast where a clinical group is compared with a nonclinical (normal) group. The magnitude of the difference between the two criterion groups is measured with a standardized mean difference. The numerator of this criterion contrast effect size is typically computed by subtracting the mean in the lowest functioning group from the mean in the highest functioning group. The criterion contrast effect size can be used as a benchmark against which to compare observed effect sizes for a treatment. Suppose that the criterion groups are patients with the same illness who have the least versus most severe symptoms, and the criterion contrast effect size is d = .80 before any treatment is given. Some treatment for the illness is evaluated, and the magnitude of the effect of treatment relative to control is d = .40. The observed effect size for treatment is one half the magnitude of the criterion contrast effect size, or .40/.80 = .50. That is, the treatment effect is equivalent to closing half the gap between the most severe and least severe patients. Please note that a treatment can have clinical significance but not statistical significance or vice versa. See Ogles, M. Lambert, and Masters (1996) for more information about the evaluation of clinical significance. Kirk (1996) noted that the evaluation of practical significance is ultimately a qualitative judgment. This judgment should be based on the researcher's knowledge of the area, but it will also reflect the researcher's personal values and societal concerns. This is not unscientific because the evaluation of all findings in science involves some degree of subjectivity. It is better to be open about this fact, however, than to base such decisions solely on "objective" statistical tests, which are unsuited to evaluate practical
EFFECT SIZE ESTIMATION IN COMPARATIVE STUDIES
135
significance. See B. Thompson (2002a) for additional discussion of these issues. HOW TO FOOL YOURSELF WITH EFFECT SIZE ESTIMATION Some ways to mislead yourself with effect size estimation were mentioned earlier but are summarized altogether in this section. There are probably other paths to folly, but one hopes the major ones are included below; see Fern and Monroe (1996) and Lenth (2001) for more information: 1. Measure effect size magnitude only at the group level (ignore the case level). 2. Apply generic definitions of effect size magnitude without first looking to the empirical literature in one's area. 3. Believe that an effect size judged as large according to generic interpretive conventions must be an important result and that a small effect is unimportant. 4. Ignore the critical question of how theoretical or practical significance should be gauged in one's research area. 5. Conduct effect size estimation only for results that are statistically significant. 6. Believe that effect size estimation somehow lessens the need for replication. 7. Report values of effect size indexes only as point estimates; that is, forget that effect size indexes are subject to sampling error, too. 8. Forget that effect size for fixed factors is specific to the particular levels selected for study. Also forget that effect size is in part a function of the design of the study. 9. Forget that standardized effect sizes encapsulate other quantities or characteristics, including the unstandardized effect size, error variance, and experimental design. These are all crucial aspects in the planning of the study and must not be overlooked. 10. As a journal editor or reviewer, substitute effect size magnitude for statistical significance as a criterion for whether a work is published. SOFTWARE FOR EFFECT SIZE ESTIMATION Many effect size indexes can be computed with a hand calculator given a few descriptive statistics. This is fortunate because software programs for 136
PARAMETRIC EFFECT SIZE INDEXES
general statistical analyses are still not as helpful as they should be for effect size estimation. There is also a small but growing number of specialized programs designed as tools for effect size estimation. Some of these programs were mentioned earlier, including the Power Analysis module of STATISTICA, ESCI, R2, and the Smithson (2001) scripts for SPSS. Another software tool described in more detail in chapter 6 is PSY by Bird, HadziPavlovic, and Isaac (2000), a freely available program that calculates approximate confidence intervals based on unstandardized or standardized contrasts in factorial designs with continuous outcome variables.5 Other programs that compute effect sizes are intended for researchers who conduct metaanalyses. These programs often feature the capabilities to estimate, record, document, and organize effect size indexes computed for large numbers of studies. An example of a recent program of this type is Effect Size (ES) by Shadish, Robinson, and Lu (1999). The ES program accepts many different forms of input data and computes for all a common effect size index, d. However, the ES program does not calculate confidence intervals for 8. RESEARCH EXAMPLES Examples of effect size estimation at both the group and case levels in three actual empirical studies are presented next. The first two examples concern the comparison of independent groups and the third concerns a repeated-measures design. Demographic and Referral Status Effects on Teacher Ratings Data for this example are from Wingenfeld, Lachar, Gruber, and Kline (1998), who collected teacher ratings on the Student Behavior Survey (SBS) within samples of regular education students (n = 1,173; 49% boys; 50% younger than 12 years old) and students referred to school or clinical psychologists (n = 601; 69% boys; 47% younger than 12 years old). The SBS has 11 primary scales, including four that assess academic strengths and seven that reflect adjustment problems. Wingenfeld et al. estimated the relative magnitudes of gender, age, and referral status effects on SBS scores within and across both samples. Because of relatively large group sizes, virtually all of the C tests had low p values. Wingenfeld et al. instead reported Hedges's g for all contrasts. Results are summarized in Table 4.10 for selected SBS scales. Overall magnitudes of demographic effects on teacher ratings are about .20 to .30 standard deviations in absolute value. Within both samples, 5 6
http://www.psy.unsw.edu.au/research/PSY.htm A trial version can be downloaded from http://www.assess.com/Software/ES.htm
EFFECT SIZE ESTIMATION IN COMPARATIVE STUDIES
137
TABLE 4.10
Standardized Mean Differences for Selected Scales on the Student Behavior Survey by Gender, Age, and Referral Status Contrasts3
Age
Gender Scale
Reg
Positive adjustment Academic Performance Academic Habits Social Skills Poor adjustment Health Concerns Social Problems Physical Aggression Behavior Problems
Ref
Reg
Ref
Referral status
.18 .34 .32
.20 .42 .46
.26 -.04 .06
.15 -.06 .06
1.46 .92 .73
.15
.08 -.42 -.54 -.13
-.34 -.17 -.36 -.16
.17 .02
-.41 -.76 -.63 -.72
-.25 -.36 -.44
-.05 .15
Note. Reg = regular education sample; Ref = referred sample. From "Development of the TeacherInformant Student Behavior Survey," by S. A. Wingenfeld, D. Lachar, C. P. Gruber, and R. B. Kline, 1998, Journal of Psychoeducational Assessment, 16, p. 236. Copyright 1998 by The Psychoeducational Corporation. Reprinted with permission. a Directions of subtraction are MGir|S - Afe.^; M212 yrs - M, but (^ preserves the sign of the contrast and can test non-nil hypotheses, too. When the samples are independent, one can compute a standardized mean difference or a correlation effect size from either t^ or F^ for a nil hypothesis. This makes these test statistics useful even if a nil hypothesis is probably false. The form of the t statistic for a contrast between independent means in either a balanced or unbalanced one-way design is t$(dfw) = (\j/ - \|/o)/Sjj», where dfw is the total within-conditions degrees of freedom N — a, \|/o is value of the contrast specified in the null hypothesis, and s$ is the standard error of the contrast. The latter is s, • ^MSW ^J
(6.7)
where MS\^ is the pooled within-conditions variance (see also Equation 2.30). The form of the F statistic for a contrast between independent means is F^(l, dfw) = SS,j»/MSw where the numerator equals
(6.8)
The statistical assumptions of the £ and F tests for contrasts between independent means are described in chapter 2. The situation is more complicated when the samples are dependent. The omnibus error term — which may be designated MS^xS for a nonadditive model or MSres for an additive model — assumes sphericity, which may be unlikely in many behavioral studies (see chap. 2, this volume). Error terms of tjj> or F<j, printed by statistical software programs that analyze data from correlated designs may be based on scores from just the two conditions involved in the contrast (e.g., Keppel, 1991, pp. 356-361). These tests are actually forms of the dependent samples t test, which does not require sphericity because only two conditions are compared. The form of this t statistic for a contrast in a correlated design is tq(n - 1) = (\ff - X|/o)/5<jr, where the standard error in the denominator is
(6.9)
168
EFFECT SI2E ESTIMATION IN ONE-WAY DESIGNS
In Equation 6.9, SD is the variance of the contrast difference scores and n is the group size. A difference score D^ can be computed for each contrast and for every case in a repeated-measures design or set of matched cases in a matched-groups design. Each difference score is a linear combination of the original scores across the levels of the factor weighted by the contrast coefficients. Suppose in a one-way design with three levels of a repeatedmeasures factor A that the coefficients for \j/2 are (l/2 -1, l/i). The scores across the levels of A for a particular case are 17, 20, and 25. The difference score for this case on this contrast equals Djz = 0/2) 17 - (1) 20 + (Vi) 25 = 1
Difference scores for the other cases on the same contrast are computed the same way, and their average for the whole sample equals ifoThe variance SD takes account of the cross-conditions correlation for that contrast (e.g., Equation 2.15). In general, this variance decreases as the correlations increase. If the cross-conditions correlations are reasonably positive, the contrast standard error may be smaller than that which may be found for the same contrast in a between-subjects design with the same factor and outcome variable. Control of Type I Error With the caveats given next, it is useful to know something about methods to control experimentwise Type I error across multiple comparisons. Methods for planned comparisons assume a relatively small number of a priori contrasts, but methods for unplanned comparisons anticipate a larger number of post hoc tests, such as all possible pairwise contrasts. A partial list of methods is presented in Table 6.2 in ascending order by degree of protection against experimentwise Type I error and in descending order by power. These methods generally use t$ or F^ as test statistics but compare them against critical values higher than those from standard tables (i.e., it is more difficult to reject H0). For example, the adjusted level of statistical significance for an individual comparison (a*) in the Dunn-Bonferroni methods equals CXEW/k, where the numerator is the rate of experimentwise rate of Type I (see chap. 2, this volume) and k is the number of contrasts. If (XEW = -05 and k = 10, the level of statistical significance for each individual contrast is a* = .05/10 = .005 in the Dunn-Bonferroni method. In unprotected tests of the same 10 contrasts, the level of Ot would be .05 for each contrast. The methods listed in the table are also associated with the construction of simultaneous confidence intervals for Vj/ (defined later). EFFECT SIZE ESTIMATION IN COMPARATIVE STUDIES
J 69
TABLE 6.2 Partial List of Methods That Control Experimentwise Type I Error for Multiple Comparisons Method
Nature of protection against experimentwise type I error
Planned comparisons Unprotected None; uses standard critical values for ^ and F9 Dunnett Across pairwise comparisons of a single control group with each of a - 1 treatment groups Bechhofer-Dunnett Across a maximum of a - 1 orthogonal a priori contrasts Dunn-Bonferroni Across a priori contrasts that are either orthogonal or nonorthogonal Unplanned comparisons Newman-Keuls,3 Across all pairwise comparisons Tukey HSDb Scheffe Across all pairwise and complex comparisons "Also called Student-Newman-Keuls. "HSD = honestly significant difference; also called Tukey A.
See Winer et al. (1991, pp. 140-197) for more information about methods to control for Type 1 error across multiple comparisons in single-factor designs. It was mentioned earlier that there is not a clear consensus that control of experimentwise Type I error is desirable if the power of the unprotected tests is already low (see chap. 3, this volume). There is also little need to worry about experimentwise Type I error if a relatively small number of contrasts is specified. Wilkinson and the Task Force on Statistical Inference (1999) noted that the tactic of testing all pairwise comparisons following rejection of HQ in the test of the omnibus effect is typically wrong. Not only does this approach make the individual comparisons unnecessarily conservative when a classical post hoc method such as the Newman-Keuls procedure is used, but it is rare that all such contrasts are interesting. The cost for reducing Type I error across all comparisons is reduced power for the specific tests the researcher really cares about. Confidence Intervals for i|i Distributions of sample contrasts are simple, and correct confidence intervals for \|/ can be constructed with central test statistics. The general form of an individual 100 (1 - oc)% confidence interval for \|/ is \jf ± s^ [t^,^
170
a
(d/error)]
EFFECT SIZE ESTIMATION IN ONE-WAY DESIGNS
(6.10)
The standard error of the contrast, Sq, is defined by Equation 6.7 when the samples are independent and by Equation 6.9 when they are dependent. The term in brackets is the positive two-tailed critical value of t at the oc level of statistical significance with degrees of freedom equal to those of the corresponding analysis of variance (ANOVA) error term for the same contrast. It is also possible to construct simultaneous confidence intervals—also known as joint confidence intervals—based on more than one observed contrast. The width of a simultaneous confidence interval for \\f is typically wider than that of the individual confidence interval for \|/ based on the same contrast. This is because simultaneous confidence intervals take account of multiple comparisons—that is, they control for experimentwise Type I error. For example, the level of a* for a simultaneous confidence interval in the Dunn-Bonferroni method equals Upy//k where k is the number of contrasts. If OL^y/ = .05 and k = 10, the level of statistical significance for the critical t statistic in Equation 6.10 is a* = .05/10 = .005. The resulting simultaneous 99.5% confidence interval based on t$ will be wider than the corresponding 95% individual confidence interval based on £ 1, then f^ is the multiple correlation between the omnibus effect of factor A and outcome. If the samples are independent, fJA can also be computed in a one-way design as
where FA is the test statistic for the omnibus effect with d/A and dfa degrees of freedom (Equation 2.27). The form of estimated-eta for a contrast is f\y = (SS^/SSj)1^2, which is the absolute value of the bivariate correlation between the contrast and outcome. Within the same data set, f|<j, < fjA- It is also true that the sum 180
EFFECT SIZE ESTIMATION IN ONE-WAY DESIGNS
of the TI^ values in a set of all possible orthogonal contrasts equals TJA (Equation 6.6). To preserve the sign of the contrast, one can compute the bivariate correlation r$ in a one-way design with independent samples as 1
if.
+
(6.17)
The correlation between the outcome variable and all noncontrast sources of between-conditions variability is fjn0n-<j/ = (SSnon^/SSj)^2, where SSnon.<j/ = (SSA - SS<j,). Comparison of fjq, and T)non,<j, indicates the relative importance of a contrast versus all noncontrast effects analyzed together. Suppose that SSA = 200.00, dfA = 3, SS^ = 5.00, and SST = 500.00. Given these data: fy = (5.00/500.00)1/2 = .10 *W» = [(200.00 - 5.00)/500.00]1/2 = .62 In words, the predictive power of the contrast is limited compared to that of both noncontrast effects evaluated together. We can also say that at least one of the noncontrast effects must have a higher bivariate correlation with outcome than \j/. The general form of the squared correlation between an effect and outcome after removing all noneffect sources of between-conditions variation from total variance is CO
partial fj2ffect =
J
•^effec
f?
(6.18) -error •^•-'e
where SSerror is the sums of squares for the effect ANOVA error term. For the omnibus effect in a one-way design with independent samples, fjA = partial f|A. This is concretely true because the sums of squares for the error term of FA is SS\y, and SSA + SSw = SSj. Conceptually, there is no systematic effect besides the omnibus effect that can be removed from total variance. In a correlated design, however, partial flA can be substantially higher than f|A. This is because the former removes the subjects effect from total variance (see chap. 4, this volume). The parameter estimated by partial fjeffect ls partial T\l(fea = ^IffectK^lfiea + Ge)i the proportion of partial population variance explained by the effect. In designs with independent samples, partial T\$ is the absolute value of the correlation between the contrast and outcome controlling for all noncontrast effects. In a correlated design, partial fj^ also controls for the subjects effect. For the same contrast, partial fj^ can be substantially higher than fjty and more similar in magnitude to f\A for the omnibus effect. This EFFECT SIZE ESTIMATION IN COMPARATIVE STUDIES
181
is especially true if neither the effect of the contrast nor all noncontrast effects are relatively small. The square of partial fj^ is the proportion of residual variance explained by the contrast. These proportions are not generally additive over a set of contrasts, orthogonal or not, because each proportion may refer to a different subset of the total variance. For designs with unrelated samples, the sign of the contrast is preserved by the following partial correlation: partial i> = ^\-2 - —
(6.19)
Refer back to Table 6.4 and review the results of an independent samples analysis of the data in Table 6.3. Computing correlations from results in Table 6.4, we obtain f|A = (10.00/76.00)1'2 = .36 i\^ = (2.50/76.00)1/2 = .18 %2 = (7.50/76.00)1'2 = .31 That is, the multiple correlation between factor A and the outcome variable is .36. The bivariate correlation between \j/2 (which compares with M2 with the average of MI and M3) and outcome is nearly as large, .31. The bivariate correlation for \jfi (which compares MI with M3) is .18. Because the contrasts are orthogonal,
fJA = T$! + T$2 = -362 = .182 + .312 = .03 + .10 = .13 Thus, of the 13% total variance explained by the omnibus effect, 3% is due to tyi and the rest, 10%, is due to ifo- Partial correlation effect sizes for the same contrasts are partial f^ = [2.50/(2.50 + 66.00)]1/2 = .19 partial fj^ = [7.50/(7.50 + 66.00)]1/2 = .32 which are only slightly larger than the respective values of fj^ for the same contrasts, . 1 8 and .3 1 . This happens for these data because the effect of \j/] is relatively small compared to that of \}f2, so removing the effects of one contrast from total variance makes little difference in the correlation of the other with outcome. Refer back to Table 6.5 to scan the results of a dependent samples analysis of the same data. The corresponding values of f| and its square for 1 82
EFFECT SIZE ESTIMATION IN ONE-WAY DESIGNS
the omnibus effect, \j/i, and xfo are all the same in both the independent and dependent samples analyses (see Table 6.4). However, the partial correlation between the omnibus effect and outcome in Table 6.5 is partial f\A = [10.00/(10.00 + 11.33)]1/2 = .68 which is substantially higher than the correlation that does not remove the subjects effect, fj^ = .36. For the same reason, partial fj^ is quite a bit larger than fity for the same contrast in the dependent samples analysis: fyj = (2.50/76.00)1/2 = .18 and partial %, = [2.50/(2.50 + 11.33)]1/2 = .43 fy2 = (7.50/76.00)1/2 = .31 and partial fyz = [7.50/(7.50 + 11.33)]1/2 = .63 Inferential Measures The parameters estimated by the inferential measures of association CO2 and pi are, respectively, CO2 and P[. To understand these parameters and their estimators, it helps to know something about ANOVA structural models. A structural model expresses a hypothetical score as the sum of population parameters that correspond to sources of variation. The classical ANOVA structural model in a single-factor design with independent samples and either a fixed or random factor is
X,, = \L + Of + EH
(6.20)
where Xjj is the jth score in the
B, AB = £ In i = i j• = i
(M s - M T ) 2
(7.3)
where n is the size of all cells, My is the mean for the cell at the ith level of A and the jth level of B, and MT is the grand mean for the whole design. It is also only in balanced two-way designs that the total between-conditions sums of squares can be broken down into unique and additive values for the individual effects:
This relation can also be expressed in terms of variance-accounted-for effect sizes measured by the correlation ratio: T\A, B, AB = T& + TJB + T|AB
EFFECT S7ZE ESTIMATION IN COMPARATIVE STUDIES
(7.5)
207
Equations 7.4 and 7.5 define orthogonality of the main and interaction effects in two-way designs. Effects in Balanced Two-Way Designs The representation in Table 7.1 shows the observed cell means and variances and marginal means in a balanced 2x3 factorial design. Because the cell sizes are equal, the marginal means are just the arithmetic averages of the corresponding row or column cell means. Each marginal mean can also be computed as the average of the individual scores in the corresponding row or column. In other words, the marginal means for each factor are calculated by collapsing across the levels of the other factor. The grand mean for the whole design is the arithmetic average of all six cell means. It can also be computed as the average of the row or column marginal means or as the average of the abn individual scores. Conceptual equations for sample main and interaction sums of squares in balanced two-way designs are presented in Table 7.2. A main effect is estimated by the difference between the observed marginal means for the same factor, and the sample sums of squares for that effect is the total of the weighted squared deviations of the associated marginal means from the grand mean. For example, if MAl = M^2 in Table 7.1, then the estimated main effect of A is zero and SSA = 0; otherwise, SSA > 0, as is the estimated main effect. Because marginal means are computed by collapsing over the levels of the other factor, main effects are single-factor effects. Simple main effects—also called just simple effects—are another kind of single-factor effect, but they correspond to cell means in the same row or column. There are as many simple effects of each factor as levels of the other factor. For example, there are two estimated simple effects of factor B represented in Table 7.1. One is the simple effect of B at AI, and it corresponds to the three cell means in the first row, MH, M12, and M^. If any two of these means are different, then the estimate of the simple effect of B at this level of A is not zero. The other estimated simple effect of this factor, B at A2, corresponds to the cell means in the second row, M 2 i, M22, and A^. The
TABLE 7.1 General Representation of a Balanced 2x3 Factorial Design A, ^
B,
Bz
63
M,, (s?,)
M 12 (s? 2 )
Mis (s?a)
M2, (s|,)
M22(s|2)
W23 (sia)
MB,
M&,
M^
Column means A/ote. The size of all cells is n.
208
EFFECT SIZE ESTIMATION IN MULTIFACTOR DESIGNS
Row means
M7
TABLE 7.2 Equations for Main and Interaction Effect Sums of Squares in Balanced Two-Way Designs Source SS cff X bn(MAi-MT)2
1= 1 b
B AB
X an (M ei -M r ) 2 1)
£ Z n(Mf-M,, ; -M S y -
Note. The size of all cells is n.
estimated simple effects of factor A correspond to the pair of cell means in each of the three columns, such as MH versus M2i for the estimated simple effect of A at BI. Sums of squares for simple effects have the same general form as for main effects (Table 7.2) except that the former are the total of the weighted squared deviations of row or column cell means from the corresponding marginal mean, not the grand mean. The estimated two-way interaction, AB, corresponds to the cell means (see Table 7.2). An interaction effect can be understood in a few different ways. It is a combined or joint effect of the factors on the outcome variable above and beyond their main effects. It also a conditional effect that, if present, says that the simple effects of each factor are different across the levels of the other factor. Interaction effects are also called moderator effects, and the factors involved in them are moderator variables. Both terms emphasize the fact that each factor's influence on the outcome variable changes across the levels of the other factor when there is interaction. Do not confuse a moderator effect with a mediator effect, which refers to the indirect effect of one variable on another through a third (mediator) variable. Mediator effects can be estimated in structural equation modeling and meta-analysis (chap. 8, this volume), but not in the ANOVA models discussed in this chapter; see Shrout and Bolger (2002) for more information. Suppose we observe the following cell means in a 2 X 3 design:
B1
D *^2
D £M
20.00
20.00
20.00
10.00
20.00
30.00
Note that the estimated simple effect of B at A] is zero, because the three cell means in the first row are equal. However, the estimated simple effect EFFECT S7ZE ESTIMATION IN COMPARATIVE STL/DIES
209
of B at AI is not zero, because the cell means in the second row are not equal. It is also true that the three estimated simple effects of A at B are all different. The equation for MSAB in Table 7.2 estimates the overall interaction as residual variability of the cell means weighted by their sizes after the main effects have been removed. It is true in balanced two-way designs that S S A a t B j = SSA + SSAB
(7.6)
SS BatA; = SSB + SSAB
(7.7)
j= 1 i= 1
In words, the total of the sum of squares for all simple effects of each factor equals the total of the sum of squares for the main effect of that factor and the interaction. Equations 7.6 and 7.7 also say that when all simple effects of a factor are analyzed, it is actually the interaction effect and the main effect of that factor that are analyzed. Given their overlap in sums of squares, it is usually not necessary to analyze both sets of simple effects, A at B and B at A. The choice between them should be made on a rational basis, depending on the perspective from which the researcher wishes to describe the interaction. Just as in one-way ANOVA, we can distinguish in factorial ANOVA between omnibus comparisons where d f > 2 and single-df focused comparisons (contrasts). We must in factorial ANOVA also distinguish between single-factor contrasts and interaction contrasts. A single-factor contrast involves the levels of just one factor while we are controlling for the other factors. There are two kinds, main comparisons and simple comparisons (Keppel, 1991). The former compares two subsets of average marginal means, and the latter compares two subsets of average cell means. For example, the observed contrast MH - M12 in Table 7.1 is a simple comparison within the B at At simple effect, but the contrast MBj - MBz is a main comparison within the B main effect. Because factor A is dichotomous in this design, its main and simple effects are also contrasts. If the levels of a quantitative factor are equally spaced, trend components can be specified instead of mean difference contrasts. Single-factor comparisons in factorial designs are specified with contrast coefficients just as they are in one-way designs (see chap. 6, this volume). An interaction contrast is specified by a matrix of coefficients the same size as the original design that are doubly centered, which means that they sum to zero in every row and column. This property makes the resulting single-df interaction effect independent of the main effects. The weights for a two-way interaction contrast can be assigned directly or taken as the
210
EFFECT SIZE ESTIMATION IN MULTIFACTOR DESIGNS
product of the corresponding weights of two single-factor comparisons, one for each independent variable. If the interaction contrast should be interpreted as the difference between a pair of simple comparisons (i.e., mean difference scaling), the sum of the absolute value of the contrast coefficients must be 4-0 (Bird, 2002). This can be accomplished by selecting coefficients for the comparison on each factor that are a standard set (i.e., their absolute values sum to 2.0) and taking their corresponding products. Some examples follow. In a 2 x 2 design where all effects are contrasts, a set of weights that defines the interaction effect directly as a "contrast between [mean difference] contrasts" (Abelson & Prentice, 1997) is presented in the cells of the left-most matrix:
B2
B, A
Note that the weights are doubly centered and the sum of their absolute values is 4.0. We can get the same set of weights for this interaction contrast by taking the corresponding products of the weights (1, —1) for factor A and the weights (1, -1) for factor B. After applying these weights to the corresponding cell means in the above right-most matrix, we get
M22
VAB = Mu - M12 -
(7.8)
Rearranging the terms shows that ^AB equals (a) the difference between the two simple effects of A at each level of B and (b) the difference between the two simple effects of B at each level of A: = V A a t B , - V A a t B 2 = (Mil
~ M 21 )
- (M12
-
M 22 )
= VB at A! - VB ,. A2 = (Mn - M 12 ) - (M21 - M 22 )
(7.9)
In two-way designs where at least one factor has three or more levels, an interaction contrast may be formed by ignoring or collapsing across at least two levels of that factor. For example, the following coefficients define a pairwise interaction contrast in a 2 X 3 design:
B1
D t>7
D D^
A!
1
0
-1
A2
-1
0
1
EFFECT SIZE ESTIMATION IN COMPARATIVE
STUDIES
211
In the contrast specified, the simple effect of A at B! is compared with the simple effect of A at 83. (It is equivalent to say that these weights specify the contrast of the simple comparison of BI with 83 across the two levels of A.) The weights for the complex interaction contrast represented compare BI with the average of BI and 83 across the levels of A:
Al A2
!/2
-!/2
-1 1
!/2
-!/2
It is left for the readers as an exercise on this book's Web site to show for a balanced 2x3 design that (a) the above two interaction contrasts are orthogonal, and (b) the sums of squares for the omnibus interaction can be uniquely decomposed into the sums of squares for each interaction contrast. The following equation for a balanced design will be handy for this exercise: (7.10)
If at least one factor is quantitative with equally spaced levels, contrast weights for an interaction trend may be specified. Suppose in a 2 x 3 design that factor A represents two different groups of patients and the levels of factor B are three equally spaced dosages of a drug. The weights for the interaction contrast presented below
A!
B,
B7
1
-2
1
-1
2
-1
compare the quadratic effect of the drug across the groups. That the sum of the absolute values of the weights is not 4.0 is not a problem because a differential trend hypothesis is tested. However, it is still necessary to adjust the scale of the resulting weighted sum of means if the effect size of the interaction trend is to be estimated with a standardized mean difference. Abelson and Prentice (1997) recommend multiplying an unstandardized interaction contrast in a two-way design by the term
212
EFFECT SIZE ESTIMATION IN MULTIFACTOR DESIGNS
(7.11)
which corrects for the absolute sizes of the contrast weights before standardizing it. (How to standardize contrasts in factorial designs is discussed later.) See Abelson and Prentice (1997) for several examples of tests for differential trends. Unlike simple effects, interaction contrasts are not confounded with the main effects in balanced designs. For this reason, researchers may prefer to analyze interaction contrasts instead of simple effects when the main effects are relatively large. It is also possible to test a priori hypotheses about specific facets of an omnibus interaction through the specification of interaction contrasts. It is not usually necessary to analyze both simple effects and interaction contrasts in the same design, so either one or the other should be chosen as a means to understand an interaction. If the reader gets the impression that there are numerous effects that can be analyzed in two-way designs—main, simple, interaction, and contrasts for any of the aforementioned effects that are omnibus—you are correct. This is even more true in designs with three or more factors. One can easily get lost by estimating every possible effect in a factorial design. It is thus crucial to have a plan that minimizes the number of analyses while still respecting the essential research hypotheses. Some of the worst misuses of statistical tests are seen in factorial designs where all possible effects are tested and sorted into two categories, those found to be statistical and subsequently discussed at length versus those found to be nonstatistical and subsequently ignored. These misuses are compounded when power is ignored. This is because power can be different for all omnibus effects in a factorial design. This happens because the (a) degrees of freedom of the F statistic for different effects can be different and (b) numbers of scores that contribute to different means vary. In a balanced 2x3 design where n = 10, for example, the two means for the A main effect are each based on 30 scores, but the three means for the B main effect are each based on 20 scores. The power for the test of the A main effect may be different for the power of the test of the B main effect, and the power for the test of the AB effect may be different still. Estimating a priori power and effect size magnitude can help to sort substantive wheat from statistical chaff in factorial designs. It also helps to realize that as the magnitude of interaction effects become larger compared to those of the main effects, detailed analysis of the latter becomes increasingly fruitless.
EFFECT SIZE ESTIMATION IN COMPARATIVE STUDIES
213
Tests in Balanced Two-Way Designs Table 7.3 presents raw scores and descriptive statistics for balanced 2x3 designs, where n = 3. The data in the top part of the table are arranged in a layout consistent with a completely between-subjects design, where each score comes from a different case. The same layout is also consistent with a mixed within-subjects (split-plot) design, where the three scores in each row are from the same case; that is, A is a group factor and B is a repeated-measures factor. The same data are presented in the bottom part of the table in a completely within-subjects layout, where the six scores in each row are from the same case. The following results are obtained after applying Equations 7.1 and 7.3 and those in Table 1.2 to the data in Table 7.3 in either layout: SSW = 64.00
SSA> B, AB = SSA + SSB + SSAB = 18.00 + 48.00 + 84.00 = 150.00 SST = 64.00 + 150.00 = 214.00 The results of three different factorial analyses of variance for the data in Table 7.3 assuming fixed factors are reported in Table 7.4- Results in the top of Table 7.4 are from a completely between-subjects analysis, results in the middle of the table come from a split-plot analysis, and the results in the bottom of the table are from a completely within-subjects analysis. Note that only the error terms, F ratios, and p values depend on the design. The sole error term in the completely between-subjects analysis is MS^, and the statistical assumptions for tests with it are described in chapter 2. In the split-plot analysis, SS\^ and dfw are partitioned to form two different error terms, one for between-subjects effects (A) and another for repeated-measures effects (B, AB). Tests with the former error term, designated in the table as S/A for "subjects within groups under A," assume homogeneity of variance for case average scores across the levels of the repeated-measures factor. The within-subjects error term, B X S/A, assumes that both withinpopulations covariance matrices on the repeated-measures factor are not only spherical but equal; see Kirk (1995, chap. 12) and Winer et al. (1991, pp. 512-526) for more information. A different partition of SS^ in the completely within-subjects analysis results in sums of squares for three different error terms for repeated-measures effects, A X S, B X S, and AB X S, and a sum of squares for the subjects effect, S. Factorial ANOVA generates the same basic source tables when either one or both factors are considered random instead of fixed. The only difference is that main effects may not have the same error terms in a random-
214
EFFECT SIZE ESTIMATION IN MULTIFACTOR DESIGNS
TABLE 7.3 Raw Scores and Descriptive Statistics for Balanced 2x3 Factorial Designs Completely between-subjects or mixed within-subjects layout3
B,
62
ft
8 7 12
10 11 15
9 7 11
9.00 (7.00)b 12.00 (7.00) 3 5 7
5.00 (4.00)
10.00
9.00 (4.00) 10 14 15
5 5 8
8.00
6.00 (3.00) 13.00(7.00) 11.00
9.00
3 5 7
5 5 8
10 14 15
5.00 (4.00)
6.00 (3.00)
13.00(7.00)
7.00
9.00
Completely within-subjects layout
AS,
8 7 12
62 10 11 15
A, 63
9 7 11
9.00 (7.00) 12.00(7.00) 9.00 (4.00) a
Assumes A is the between-subjects factor and B is the repeated measures factor. "Cell mean (variance).
effects model as in a fixed-effects model. For example, the error term for the main effects in a completely between-subjects design with two random factors is MSAB, not MSv^. However, MS\^ is still the error term for the AB effect. Tabachnick and Fidell (2001) gave a succinct, nontechnical explanation: Because levels of both factors are randomly selected, it is possible that a special interaction occurred with these particular levels. This special interaction may confound the main effects, but the ratios
FA = MSA/MSAB
and
FB = MSB/MSAB
are expected to cancel out these confounds in statistical tests of the main effects. See Tabachnick and Fidell (2001, p. 665) for error terms for twoway designs of the kind analyzed in Table 7.4 when at least one factor is random. Maximum likelihood estimation as an alternative to traditional AN OVA can also be used in factorial designs with random factors (see chap. 6, this volume).
EFFECT SIZE ESTIMATION IN COMPARATIVE STUDIES
215
TABLE 7.4 Analysis of Variance Results for the Data in Table 7.3 Source
SS
df
MS
F
P
Completely between-subjects analysis Between-subjects effects A B AB Within cells (error)
18.00 48.00 84.00
1 2 2
18.00 24.00 42.00
64.00
12
5.33
3.38 4.50 7.88
.091 .035 .007
Mixed within-subjects analysis Between-subjects effects ts A
18.00
1
18.00
1.27
.323
Within-subjects effects B AB
48.00 84.00
2 2
24.00 42.00
26.17 45.82
1 is given in the table only for a design in which both factors are fixed. This is because measures of association are usually computed only for omnibus effects when the corresponding factor(s) is (are) random. To derive w o
O 1^ CO CO Cft CO ^" OO CD C) T^ OJ T-
1- T- O
T TTT o in CM en i- 00 CO 00
1T^o CMo oin"oiri CO
CD
b
O CVI 00 *fr
LO en in co C\j T^ T^
T^
a.
11 U_
a 3,
a c
CM 8 T-cq CO co in ' CO CO 00 8 o oo
"~T"T"~
O O
c o
±; .a
en o § 00 CO ^ O5
in o co r~-- co C5>
eo o
i= ._
Q
V* 73 CO
CM ® 0) 0) HI CO
T- ^
1 I ^I T—1
O TT1™ CD i-
CM -i- O CO in T-; r~ CO ^° ^D ^3 C) i- i— -i—
1-
CD 0- (0 L "^ "co cB Q
0 O OO
|