MEMBRANE SEPARATIONS TECHNOLOGY Principles and Applications
MEMBRANE SEPARATIONS TECHNOLOGY Principles and Applications
M e m b r a n c e S c i e n c e and T e c h n o l o g y S e r i e s , 2
MEMBRANE SEPARATIONS TECHNOLOGY Principles and Applications Edited
by
Richard D. Noble Department of Chemical Engineering, University of Colorado, Boulder, CO 80309-0424,USA and
S. Alexander Stern Chemical Engineering and Materials Science Department, Syracuse University, Syracuse, NY 13244-1190, USA
ELSEVIER Amsterdam
- Boston
- Heidelberg
San Diego - San Francisco
- London
- Singapore
- New
- Sydney
York - Tokyo
- Oxford
- Paris
ELSEVIER SCIENCE B.V. Sara Burgerhartstraat 25 P.O. Box 21 I, 1000 AE Amsterdam, The Netherlands
© 1995 Elsevier Science B.V. All rights reserved.
This work is protected under copyright by Elsevier Science, and the following terms and conditions apply to its use: Photocopying Single photocopies of single chapters may be made for personal use as allowed by national copyright laws. Permission of the Publisher and payment of a fee is required for all other photocopying, including multiple or systematic copying, copying for advertising or promotional purposes, resale, and all forms of document delivery. Special rates are available for educational institutions that wish to make photocopies for non-profit educational classroom use. Permissions may be sought directly fi'omEisevier's Science & Technology Rights Department in Oxford, UK: phone: (+44) 1865 843830, fax: (+44) 1865 853333, c-mail:
[email protected]. You may also complete your request on-line via the Elsevier Science homepage (http://www.elsevier.com), by selecting 'Customer Support' and then 'Obtaining Permissions'. In the USA, users may clear permissions and make payments through the Copyright Clearance Center, Inc., 222 Rosewood Drive, Danvers, MA 01923, USA; phone: (+ I) (978) 7508400, fax: (+ I) (978) 7504744, and in the UK through the Copyright LicensingAgency Rapid Clearance Service (CLARCS), 90 Tottenham Court Road, London WIP 0LP, UK; phone: (+44) 207 6315555; fax: (+44) 207 631 5500. Other countries may have a local reprographic rights agency for payments. Derivative Works Tables of contents may be reproduced for internal circulation, but permission of Elsevier Science is required for external resale or distribution of such material. Permission of the Publisher is required for all other derivative works, including compilations and translations. Electronic Storage or Usage Permission of the Publisher is required to store or use electronically any material contained in this work, including any chapter or part of a chapter. Except as outlined above, no part of this work may be reproduced, stored in a retrieval system or transmitted in any form or by any means, electronic, mechanical, photocopying, recording or otherwise, without prior written permission of the Publisher. Address permissions requests to: Elsevier's Science & Technology Rights Department, at the phone, fax and e-mail addresses noted above. Notice No responsibility is assumed by the Publisher for any injury and/or damage to persons or property as a matter of products liability, negligence or otherwise, or from any use or operation of any methods, products, instructions or ideas contained in the material herein. Because of rapid advances in the medical sciences, in particular, independent verification of diagnoses and drug dosages should be made.
First edition 1995 Second impression 1999 Third impression 2003 Library of Congress Cataloging in Publication Data A catalog record from the Library of Congress has been applied for.
British Library Cataloguing in Publication Data A catalogue record from the British Library has been applied for.
ISBN: 0 444 81633 X
The paper used in this publication meets the requirements of ANSI/NISO Z39.48-1992 (Permanence of Paper). Printed in The Netherlands.
Preface The field of membrane separation technology is presently in a state of rapid growth and innovation. Many different membrane separation processes have been developed during the past half century and new processes are constantly emerging from academic, industrial, and government laboratories. Microfiltration, which is very similar to conventional filtration, is probably the oldest and still the most widely used of these processes. Almost all other membrane separation processes found significant industrial applications only after the 'breakthrough' development of asymmetric polymer membranes by Loeb and Sourirajan in the early 1950s. Thus, ultrafiltration and reverse osmosis (sometimes called hyperfiltration) reached maturity in the 1960s, whereas membrane processes for the separation of gas mixtures started to be used on an industrial scale in the late 1970s and in the 1980s. Huge membrane plants for the separation of the uranium isotopes 235Uand 23813by 'gaseous diffusion' were built in the United States much earlier, during the 1940s. However, the products of these plants were intended for military purposes. Pervaporation and vapor permeation are the latest membrane separation processes to become economically competitive for some industrial applications. The first large-scale industrial pervaporation plant started operation in 1985 in Karlsruhe-Maxau (Germany) and another shortly thereafter in Betheniville (France). Both plants are being used for the dehydration of 94% ethanol. The first commercial vapor permeation plant, also designed for ethanol dehydration, became operative in September 1989 in Heilbron (Germany). Promising new applications are expected in future years for facilitated-transport membranes and catalytic membrane reactors. While new membrane separation processes are being conceived with remarkable frequency, existing processes are also being constantly improved in order to enhance their economic competitiveness. Significant improvements are currently being made in many aspects of membrane separation technology: in the development of new membrane materials with higher selectivity and/or permeability, in the fabrication methods for high-flux asymmetric or composite membranes (whether in fiat-sheet, hollow fiber, or tubular form), in membrane module construction and in process design (e.g., of hybrid separation processes). Membrane separation technology is presently being used in an impressive variety of applications and has generated businesses totalling over one billion U.S. dollars annually. It is not surprising, therefore, that it has been the subject
vi of many monographs, books and review papers, and that an entire journal, the Journal of Membrane Science (Elsevier), is dedicated to it. The main objective of the present text is to present the principles and applications of a variety of membrane separation processes from the unique perspectives of investigators who have made important contributions to their fields. Another objective is to provide the reader with an authoritative resource on various aspects of this rapidly growing technology. The text can be used by someone who wishes to learn about a general area of application as well as by the knowledgeable person seeking more detailed information. The various chapters differ significantly in length, emphasis, and detail. No uniformity has been sought in the presentation of the subject matter or in nomenclature in order to preserve the perspective and personal style of the contributors. Also, very little editing has been done on the chapters whose authors used English as a second language, in order to avoid possible errors of interpretation or changes in emphasis. The chapters in this text cover a wide variety of topics. Some of the authors have chosen to cover all aspects of certain membrane separation processes. Other authors have preferred to discuss specific topics in greater detail, such as process and module design, process economics, special applications of industrial or biotechnological interest, and emerging applications. It is hoped that the present text will not only provide readers interested in membrane separation technology with useful data and information, but also with the insights of well-known investigators who have contributed to its development and promise.
vii
Contents Preface .
.
.
.
.
.
.
.
List of contributors
•
•
•
•
•
•
•
*
•
•
•
•
•
•
•
•
•
•
*
•
•
•
•
•
•
•
•
......................................
•
•
•
•
•
•
•
•
•
•
•
V
xix
Chapter I. MICROFILTRATION AND ULTRAFILTRATION WllUam E y k a m p 1.1 Introduction ....................................... 1.1.1 Historical .................................... 1.2 The M e m b r a n e F i l t r a t i o n Process . . . . . . . . . . . . . . . . . . . . . . . . . . .
1.2.1 1.2.2 1.2.3 1.2.4 1.2.5 1.2.6 1.2.7 1.2.8 1.2.9 1.2.10 1.2.11 1.2.12
1.3
1.4
1.5
Crossflow .................................... Throughput and Driving Force ....................... Conventional Filtration ............................ Crossflow Filtration .............................. Mass Transfer ................................. Turbulent Mass Transfer ........................... Turbulent Boundary Layer ......................... Effect of F l o w o n F l u x . . . . . . . . . . . . . . . . . . . . . . . . . . . . Pressure Drop ................................ Energy Consumption ............................ Laminar Mass Transfer ........................... Other Depolarization Schemes ....................... 1.2.12.1 T a y l o r V o r t e x . . . . . . . . . . . . . . . . . . . . . . . . . . . 1.2.12.2 V i b r a t o r y . . . . . . . . . . . . . . . . . . . . . . . . . . . . . Separation Membranes ............................... 1.3.1 Membrane Ratings ............................. 1.3.1.1 Microfiltration .......................... 1.3.1.2 Ultrafiltration ........................... 1.3.1.3 Complications from Fouling .................. Membrane Modules ................................. 1.4.1 Background ................ .................. 1.4.2 Spiral W o u n d ................................ 1.4.3 Capillary ................................... 1.4.4 Plate and Frame ............................... 1.4.5 Cartridges .................................. Fouling ......................................... 1.5.1 Prompt Fouling ............................... 1.5.2 Cumulative Fouling ............................. 1.5.3 Destructive Fouling ............................. 1.5.4 F r e q u e n c y of F o u l i n g . . . . . . . . . . . . . . . . . . . . . . . . . . . .
1 2 5
5 6 7 7 8 9 11 12 13 14 14 15 15 15 16 19 20 21 26 27 27 28 28 28 29 29 29 30 30
viii 1.6
Applications ...................................... 1.6.1 Microfiltration ................................ 1.6.2 Ultrafiltration ................................ 1.7 Economics ....................................... 1.7.1 Energy ..................................... References ..........................................
31 31 35 38 38 40
Chapter 2. POLARIZATION PHENOMENA AND MEMBRANE FOULING M.H.V. Mulder 2.1 2.2 2.3 2.4 2.5 2.6 2.7 2.8 2.9 2.10 2.11
Introduction ...................................... Adsorption ...................................... Concentration Polarization ............................. M o d e l D e s c r i p t i o n of C o n c e n t r a t i o n P o l a r i z a t i o n . . . . . . . . . . . . . . . . Resistance Models .................................. Gel Polarization Model ............................... Osmotic Pressure Model ............................... C o n c e n t r a t i o n P o l a r i z a t i o n in P e r v a p o r a t i o n . . . . . . . . . . . . . . . . . . . Membrane Fouling .................................. Fouling Models .................................... C o n t r o l of F o u l i n g a n d C o n c e n t r a t i o n P o l a r i z a t i o n . . . . . . . . . . . . . . . 2.11.1 P r e t r e a t m e n t . . . . . . . . . . . . . . . . . . . . . . . . . . . . . . . . . 2.11.2 M e m b r a n e p r o p e r t i e s . . . . . . . . . . . . . . . . . . . . . . . . . . . . 2.11.3 C l e a n i n g . . . . . . . . . . . . . . . . . . . . . . . . . . . . . . . . . . . 2.11.3.1 H y d r a u l i c C l e a n i n g . . . . . . . . . . . . . . . . . . . . . . . 2.11.3.2 M e c h a n i c a l C l e a n i n g . . . . . . . . . . . . . . . . . . . . . . . 2.11.3.3 C h e m i c a l C l e a n i n g . . . . . . . . . . . . . . . . . . . . . . . . 2.11.3.4 Electric C l e a n i n g . . . . . . . . . . . . . . . . . . . . . . . . . 2.11.4 I m p r o v e m e n t of O p e r a t i n g C o n d i t i o n s . . . . . . . . . . . . . . . . . . 2.11.4.1 S o l u t i o n H y d r o d y n a m i c s . . . . . . . . . . . . . . . . . . . . 2.11.4.2 M o d u l e - r e l a t e d M e t h o d s . . . . . . . . . . . . . . . . . . . . Symbols ............................................ References ..........................................
45 48 49 54 55 59 61 63 65 70 73 73 74 75 75 75 75 76 76 76 77 81 82
Chapter 3. VAPOR PERMEATION Y. Cen and R.N. LIchtenthaler 3.1 3.2
3.3
3.4
Introduction ...................................... Basic P r i n c i p l e s a n d Classification . . . . . . . . . . . . . . . . . . . . . . . . . 3.2.1 V a p o r P e r m e a t i o n in C o m p a r i s o n w i t h G a s P e r m e a t i o n a n d Pervaporation ................... . ............ 3.2.2 C l a s s i f i c a t i o n of V a p o r P e r m e a t i o n . . . . . . . . . . . . . . . . . . . . Material Transport through Membranes ..................... 3.3.1 Porous Membranes ............................. 3.3.2 Nonporous Membranes ........................... Specific I n v e s t i g a t i o n s a n d A p p l i c a t i o n s . . . . . . . . . . . . . . . . . . . . . 3.4.1 R e m o v a l of V a p o r s f r o m G a s / V a p o r M i x t u r e s . . . . . . . . . . . . .
85 86 86 87 87 88 89 92 93
ix 3.4.1.1 Specific I n v e s t i g a t i o n s . . . . . . . . . . . . . . . . . . . . . . 3.4.1.2 Industrial Applications . . . . . . . . . . . . . . . . . . . . . 3.4.2 S e p a r a t i o n of V a p o r M i x t u r e s . . . . . . . . . . . . . . . . . . . . . . . 3.4.2.1 Specific I n v e s t i g a t i o n s of the Effect of O p e r a t i n g Parameters ............................ 3.4.2.2 Engineering Aspects . . . . . . . . . . . . . . . . . . . . . . 3.4.2.3 Industrial Applications . . . . . . . . . . . . . . . . . . . . 3.5 Conclusions ..................................... 3.6 Final r e m a r k . . . . . . . . . . . . . . . . . . . . . . . . . . . . . . . . . . . . . Acknowledgement ..................................... References . . . . . . . . . . . . . . . . . . . . . . . . . . . . . . . . . . . . . . . . .
93 95 95 97 104 106 108 108 108 109
Chapter 4. REVERSEOSMOSIS C.J.D. Fell 4.1
Introduction .....................................
4.2 4.3
Reverse Osmosis Membranes . . . . . . . . . . . . . . . . . . . . . . . . . . . T h e o r y of R e v e r s e O s m o s i s . . . . . . . . . . . . . . . . . . . . . . . . . . . . 4.3.1 Membrane Transport ........................... 4.3.2 Concentration Polarisation . . . . . . . . . . . . . . . . . . . . . . . . 4.4 D e s i g n of R e v e r s e O s m o s i s M o d u l e s . . . . . . . . . . . . . . . . . . . . . . . 4.4.1 Conventional Module Types ..... .................. 4.4.2 Optimal Module Design . . . . . . . . . . . . . . . . . . . . . . . . . 4.4.3 Spacer D e s i g n in Spiral W o u n d M o d u l e s . . . . . . . . . . . . . . . . 4.5 A s s e m b l y of R e v e r s e O s m o s i s P l a n t . . . . . . . . . . . . . . . . . . . . . . . 4.5.1 Module Arrangement ........................... 4.5.2 M i n i m i z i n g E n e r g y Costs b y E n e r g y R e c o v e r y . . . . . . . . . . . . . 4.5.3 P l a n t Process C o n tr o l . . . . . . . . . . . . . . . . . . . . . . . . . . . 4.6 O p e r a t i o n of R e v e r s e O s m o s i s P l a n t . . . . . . . . . . . . . . . . . . . . . . . 4.6.1 Feed Pretreatment . . . . . . . . . . . . . . . . . . . . . . . . . . . . . 4.6.2 Plant Operation . . . . . . . . . . . . . . . . . . . . . . . . . . . . . . 4.6.3 Membrane Fouling . . . . . . . . . . . . . . . . . . . . . . . . . . . . 4.7 Major R e v e r s e O s m o s i s D e s a l i n a t i o n Plants . . . . . . . . . . . . . . . . . . 4.7.1 Major Installations ' 4.7.2 E c o n o m i c s of D e s a l i n a t i o n . . . . . . . . . . . . . . . . . . . . . . . . 4.8 Applications Other than Desalination . . . . . . . . . . . . . . . . . . . . . . 4.9 Conclusions ..................................... S o m e Useful C o n v e r s i o n Factors . . . . . . . . . . . . . . . . . . . . . . . . . . . . Nomenclature ....................................... References . . . . . . . . . . . . . . . . . . . . . . . . . . . . . . . . . . . . . . . . .
113
115 119 119 120 121 121 125 127 127 127 129 129 129 131 132 132 133 134 135 136 138 139 139 140
Chapter 5. PERVAPORATION J. N6el 5.1 5.2
Introduction ..................................... C h a r a c t e r i z a t i o n of P e r v a p o r a t i o n M e m b r a n e s . . . . . . . . . . . . . . . . . 5.2.1 P e r v a p o r a t i o n Flux a n d Selectivity . . . . . . . . . . . . . . . . . . .
143 149 149
5.2.2 Concentration D e p e n d e n c e of Pervaporation Flux and Selectivity 5.2.3 Average Characteristics of Operating Pervaporation Membranes 5.2.4 Expected Performance of a Continuous-flow Pervaporator . . . . . 5.2.5 Influence of D o w n s t r e a m Pressure on M e m b r a n e P e r f o r m a n c e . . . 5.3 Mechanism of Pervaporation Mass Transport . . . . . . . . . . . . . . . . . 5.3.1 Mass Transport T h r o u g h an Unevenly Swollen Polymer Film . . 5.3.2 Sorption and Diffusion Selectivities . . . . . . . . . . . . . . . . . . . 5.3.3 Modeling of Pervaporation Mass Transport . . . . . . . . . . . . . . 5.3.3.1 V a c u u m Pervaporation Transport of Pure Liquids . . . . 5.3.3.2 V a c u u m Pervaporation of Binary Liquid Mixtures . . . . 5.3.3.3 The Stefan-Maxwell Approach . . . . . . . . . . . . . . . . 5.3.3.4 Pervaporation Mass Transport T h r o u g h Semicrystalline Polymer Films . . . . . . . . . . . . . . . . . . . . . . . . . 5.3.3.5 Coupling Effects in Pervaporation . . . . . . . . . . . . . . 5.3.3.6 Origin of D o w n s t r e a m Diffusion Selectivity . . . . . . . . 5.4 Engineering of Pervaporation . . . . . . . . . . . . . . . . . . . . . . . . . . . 5.4.1 Equations Governing Continuous-flow Pervaporation . . . . . . . . 5.4.2 Application to a Typical Case: Dehydration of Ethanol . . . . . . . 5.4.3 Side Effects in Pervaporation Engineering . . . . . . . . . . . . . . . 5.4.3.1 Concentration Polarization in Pervaporation . . . . . . . . 5.4.3.2 Residence Time Distribution in Pervaporation Modules 5.4.3.3 Pressure Loss in Pervaporation Modules . . . . . . . . . . 5.4.3.4 Pervaporation and Vapor Permeation . . . . . . . . . . . . 5.4.3.5 Integrated Systems Involving Pervaporation . . . . . . . . 5.5 Manufacture of Pervaporation Membranes . . . . . . . . . . . . . . . . . . . 5.5.1 Hydrophilic Pervaporation Membranes . . . . . . . . . . . . . . . . 5.5.2 Organophilic Pervaporation m e m b r a n e s . . . . . . . . . . . . . . . . 5.5.3 Pervaporation Membranes for Organic-Organic Separation . . . . . 5.6 Present State of Art of Pervaporation . . . . . . . . . . . . . . . . . . . . . . References . . . . . . . . . . . . . . . . . . . . . . . . . . . . . . . . . . . . . . . . .
Chapter 6. ELECTRODIALYSlS AND RELATED PROCESSES H. Strathmann 6.1 6.2
6.3
6.4
Introduction: Historical Development . . . . . . . . . . . . . . . . . . . . . . F u n d a m e n t a l s of Electromembrane Processes . . . . . . . . . . . . . . . . . 6.2.1 Principle of Electrodialysis a n d Related Processes . . . . . . . . . . 6.2.2 Properties of Ion-Exchange Membranes . . . . . . . . . . . . . . . . 6.2.3 Mass Transfer in Electrodialysis . . . . . . . . . . . . . . . . . . . . . 6.2.4 M e m b r a n e Permselectivity . . . . . . . . . . . . . . . . . . . . . . . . 6.2.5 Energy Requirements in Electrodialysis . . . . . . . . . . . . . . . . Preparation and Characterization of Ion-exchange M e m b r a n e s . . . . . . . 6.3.1 Preparation of Ion-Exchange Membranes . . . . . . . . . . . . . . . 6.3.2 Characterization of Ion-Exchange M e m b r a n e s . . . . . . . . . . . . Electrodialysis Process and E q u i p m e n t Design . . . . . . . . . . . . . . . . . 6.4.1 Electrodialysis Stack Design . . . . . . . . . . . . . . . . . . . . . . .
. 150 . 154 155 156 158 . 158 159 165 165 166 169 172 176 178 180 181 183 185 185 . 188 188 189 190 193 193 197 199 201 204
213 215 215 217 221 224 224 231 233 242 249 249
xi
6.4.2 The Process Design . . . . . . . . . . . . . . . . . . . . . . . . . . . . 251 6.4.3 Process P a r a m e t e r E v a l u a t i o n a n d O p e r a t i o n a l P r o b l e m s . . . . . . 253 6.4.4 Process D e s i g n a n d Economics . . . . . . . . . . . . . . . . . . . . . 258 6.5 A p p l i c a t i o n of Electrodialysis . . . . . . . . . . . . . . . . . . . . . . . . . . . 262 6.5.1 Desalination of Brackish W a t e r b y Electrodialysis . . . . . . . . . . 263 6.5.2 P r o d u c t i o n of Table Salt . . . . . . . . . . . . . . . . . . . . . . . . . 263 6.5.3 Electrodialysis in W a s t e W a t e r T r e a t m e n t . . . . . . . . . . . . . . . 263 6.5.4 C o n c e n t r a t i o n of Reverse O s m o s i s Brines . . . . . . . . . . . . . . . 264 6.5.5 Electrodialysis in the Chemical, the F o o d a n d the D r u g I n d u s t r y . . 264 6.5.6 P r o d u c t i o n of U l t r a p u r e W a t e r . . . . . . . . . . . . . . . . . . . . . 265 6.6 O t h e r E l e c t r o - m e m b r a n e Processes . . . . . . . . . . . . . . . . . . . . . . . 266 6.6.1 Diffusion Dialysis . . . . . . . . . . . . . . . . . . . . . . . . . . . . . 266 6.6.2 D o n n a n Dialysis . . . . . . . . . . . . . . . . . . . . . . . . . . . . . . 267 6.6.3 Chlorine--Alkaline E l e c t r o l y s i s . . . . ................ . . 268 6.6.4 Acids a n d Base P r o d u c t i o n b y Electrodialytic W a t e r Dissociation . 269 6.7 Conclusions . . . . . . . . . . . . . . . . . . . . . . . . . . . . . . . . . . . . . 275 Notation ............................................ 275 References . . . . . . . . . . . . . . . . . . . . . . . . . . . . . . . . . . . . . . . . . 277
Chapter 7. LIQUID MEMBRANES (LIQUID PERTRACTION) L. Boyadzhlev and Z. Lazarova 7.1
7.2
7.3
7.4
7.5
Introduction ..................................... 7.1.1 Principle of Liquid Pertraction . . . . . . . . . . . . . . . . . . . . . . 7.1.2 C o m p a r i s o n of Liquid M e m b r a n e s a n d Solid M e m b r a n e s . . . . . . 7.1.3 C o m p a r i s o n of Liquid Pertraction a n d L i q u i d - L i q u i d E x t r a c t i o n . . Transfer m e c h a n i s m s . . . . . . . . . . . . . . . . . . . . . . . . . . . . . . . 7.2.1 Simple Transfer M e c h a n i s m s . . . . . . . . . . . . . . . . . . . . . . 7.2.2 Facilitated Transfer M e c h a n i s m s . . . . . . . . . . . . . . . . . . . . 7.2.3 O t h e r Transfer M e c h a n i s m s . . . . . . . . . . . . . . . . . . . . . . . Pertraction Techniques . . . . . . . . . . . . . . . . . . . . . . . . . . . . . . . 7.3.1 Techniques W i t h o u t P h a s e Dispersion . . . . . . . . . . . . . . . . . . 7.3.1.1 Bulk (Two-cell) T e c h n i q u e s . . . . . . . . . . . . . . . . . . 7.3.1.2 S u p p o r t e d Liquid M e m b r a n e s (SLM) . . . . . . . . .... 7.3.1.3 Liquid Film Pertraction (LFP) . . . . . . . . . . . . . . . . . 7.3.2 M e t h o d s w i t h Phase Dispersion . . . . . . . . . . . . . . . . . . . . . 7.3.2.1 E m u l s i o n Liquid M e m b r a n e M e t h o d (ELM) . . . . . . . . 7.3.2.2 O t h e r M e t h o d s w i t h P h a s e Dispersion . . . . . . . . . . . 7.3.3 C o m p a r i s o n of Various Pertraction T e c h n i q u e s . . . . . . . . . . . . M a t h e m a t i c a l M o d e l l i n g of Pertraction Processes . . . . . . . . . . . . . . . 7.4.1 M o d e l l i n g of SLM Processes . . . . . . . . . . . . . . . . . . . . . . . 7.4.2 M o d e l l i n g of ELM Processes . . . . . . . . . . . . . . . . . . . . . . . 7.4.3 M o d e l l i n g of LFP Processes . . . . . . . . . . . . . . . . . . . . . . . A p p l i c a t i o n of Liquid Pertraction . . . . . . . . . . . . . . . . . . . . . . . . 7.5.1 S e p a r a t i o n of H y d r o c a r b o n s . . . . . . . . . . . . . . . . . . . . . . . 7.5.2 Pertraction of Metals . . . . . . . . . . . . . . . . . . . . . . . . . . .
283 284 284 285 285 286 287 288 288 289 289 290 293 294 295 296 298 299 300 302 304 305 305 308
xii 7.5.2.1 Alkaline a n d Earth Alkaline Metals . . . . . . . . . . . . . 7.5.2.2 N o b l e Metals . . . . . . . . . . . . . . . . . . . . . . . . . . 7.5.2.3 R a r e - e a r t h a n d Radioactive Metals . . . . . . . . . . . . . . 7.5.2.4 Copper .............................. 7.5.2.5 O t h e r V a l u a b l e or Toxic Metals . . . . . . . . . . . . . . . . 7.5.3 P e r t r a c t i o n of I n o r g a n i c Substances . . . . . . . . . . . . . . . . . . . 7.5.4 P e r t r a c t i o n of O r g a n i c Substances . . . . . . . . . . . . . . . . . . . . 7.5.5 Biotechnological a n d Medical A p p l i c a t i o n s . . . . . . . . . . . . . . 7.5.5.1 Special Case: L i q u i d - M e m b r a n e E n z y m e Reactors 7.5.6 Process Economics a n d I n d u s t r i a l A p p l i c a t i o n of Liquid Pertraction . . . . . . . . . . . . . . . . . . . . . . . . . . . . . . . . . 7.6 Conclusion ..................................... List of S y m b o l s a n d A b b r e v i a t i o n s . . . . . . . . . . . . . . . . . . . . . . . . . . . References . . . . . . . . . . . . . . . . . . . . . . . . . . . . . . . . . . . . . . . . .
....
Chapter 8. MEMBRANE BIOSEPARATIONS Stephen L. Matson 8.1
8.2
8.3
Introduction
. . . . . . . . . . . . . . . . . . . . . . . . . . . . . . . . . . . . .
8.1.1 Historical P e r s p e c ti v e s . . . . . . . . . . . . . . . . . . . . . . . . . . 8.1.2 C u r r e n t Status . . . . . . . . . . . . . . . . . . . . . . . . . . . . . . . 8.1.3 Chapter Organization ........................... B i o t e c h n o l o g y a n d Bioseparations: A n O v e r v i e w . . . . . . . . . . . . . . . 8.2.1 Representative Bioproducts . . . . . . . . . . . . . . . . . . . . . . . 8.2.1.1 Low-Molecular-Weight Products ............... 8.2.1.2 Macromolecular Products . . . . . . . . . . . . . . . . . . . 8.2.1.3 Cell Biomass . . . . . . . . . . . . . . . . . . . . . . . . . . 8.2.2 Principal B i o p r o d u c t i o n S y s t e m s . . . . . . . . . . . . . . . . . . . . 8.2.2.1 Fermentation .......................... 8.2.2.2 Cell C u l t u r e . . . . . . . . . . . . . . . . . . . . . . . . . . . I m p l i c a t i o n s for M e m b r a n e Bioseparations . . . . . . . . . . . . . . . . . . . 8.3.1 F e e d s t r e a m Characteristics a n d Process C o n s t r a i n t s . . . . . . . . . 8.3.1.1 Diluteness . . . . . . . . . . . . . . . . . . . . . . . . . . . . 8.3.1.2 Mixture Complexity . . . . . . . . . . . . . . . . . . . . . . 8.3.1.3 M o l e c u l a r C o m p l e x i t y a n d Instability . . . . . . . . . . . . 8.3.1.4 H i g h In-Process Value . . . . . . . . . . . . . . . . . . . . . 8.3.1.5 Scale of Bioprocessing . . . . . . . . . . . . . . . . . . . . . 8.3.1.6 N a t u r e of Bioreactor O p e r a t i o n . . . . . . . . . . . . . . . . 8.3.1.7 Purity Requirements ...................... 8.3.1.8 N a t u r e of Bioprocess D e v e l o p m e n t a n d R e g u l a t o r y Issues . . . . . . . . . . . . . . . . . . . . . . . . . . . . . . . 8.3.1.9 Contamination Control and Containment . . . . . . . . . 8.3.1.10 Economic C o n s i d e r a t i o n s . . . . . . . . . . . . . . . . . . . 8.3.2 B i o s e p a r a t i o n Process D e s i g n . . . . . . . . . . . . . . . . . . . . . . 8.3.2.1 Process F l o w s h e e t s . . . . . . . . . . . . . . . . . . . . . . . 8.3.2.2 G e n e r a l Principles a n d G u i d e l i n e s . . . . . . . . . . . . . .
308 309 310 313 318 323 326 329 332 334 336 337 339
353 353 354 355 355 357 357 358 359 359 360 363 366 366 367 367 368 369 370 370 371 371 372 372 373 373 374
xiii 8.4
M i c r o f i l t r a t i o n a n d U l t r a f i l t r a t i o n in Cell H a r v e s t i n g a n d C l a r i f i c a t i o n . . . 8.4.1 General Considerations .......................... 8.4.1.1 R a t i o n a l e for C r o s s - F l o w F i l t r a t i o n . . . . . . . . . . . . . 8.4.1.2 Membrane Characteristics ................... 8.4.2 S e p a r a t i o n of M i c r o b i a l Cells . . . . . . . . . . . . . . . . . . . . . . . 8.4.2.1 Microfiltration ......................... 8.4.2.2 Ultrafiltration .......................... 8.4.3 S e p a r a t i o n of M a m m a l i a n Cells . . . . . . . . . . . . . . . . . . . . . 8.4.4 Generalizations and Design Guidance ................. 8.5 Protein Recovery and Concentration by UF ................... 8.5.1 Design Equations ............................. 8.5.1.1 Concentration by Ultrafiltration ............... 8.5.1.2 Purification by Ultrafiltration ................. 8.5.1.3 Purification by Diafiltration . . . . . . . . . . . . . . . . . . 8.5.2 Typical Applications ........................... 8.6 F l u x - l i m i t i n g P h e n o m e n a in M e m b r a n e B i o s e p a r a t i o n s . . . . . . . . . . . . 8.6.1 C o n c e n t r a t i o n P o l a r i z a t i o n in M F a n d U F . . . . . . . . . . . . . . . 8.6.2 Membrane Fouling ............. • ............... 8.7 Other Membrane Bioseparations ......................... 8.7.1 Microsolute Concentration and Purification .............. 8.7.2 Sterile F i l t r a t i o n a n d C o n t a m i n a n t R e m o v a l . . . . . . . . . . . . . . 8.7.3 Affinity M e m b r a n e s . . . . . . . . . . . . . . . . . . . . . . . . . . . . List of S y m b o l s . . . . . . . . . . . . . . . . . . . . . . . . . . . . . . . . . . . . . . . References .........................................
375 375 375 377 378 378 381 383 391 392 393 393 393 394 395 399 399 401 403 403 405 405 407 408
Chapter 9. FOOD AND BEVERAGE INDUSTRY APPLICATIONS Munir C h e r y a n a n d Jose R. Alvarez 9.1 9.2
9.3
Introduction . . . . . . . . . . . . . . . . . . . . . . . . . . . . . . . . . . . . . Dairy Industry ................................... 9.2.1 Milk ..................................... 9.2.1.1 Concentration by Reverse Osmosis ............. 9.2.1.2 Milk Fractionation by Ultrafiltration . . . . . . . . . . . . . 9.2.1.3 Milk Microfiltration ...................... 9.2.2 Cheese Whey ................................ 9.2.2.1 Concentration by Reverse Osmosis ............. 9.2.2.2 Whey Fractionation by Ultrafiltration ............ 9.2.2.3 M i c r o f i l t r a t i o n of "Whey . . . . . . . . . . . . . . . . . . . . 9.2.2.4 Demineralization ........................ F r u i t Juices a n d Extracts . . . . . . ........................ 9.3.1 Clarification . . . . . . . . . . . . . . . . . . . . . . . . . . . . . . . . 9.3.1.1 A p p l e Juice . . . . . . . . . . . . . . . . . . . . . . . . . . . 9.3.1.2 O t h e r Juices . . . . . . . . . . . . . . . . . . . . . . . . . . . 9.3.2 Concentration ............................... 9.3.2.1 A p p l e Juice . . . . . . . . . . . . . . . . . . . . . . . . . . .
415 416 419 419 424 435 439 440 441 444 445 446 446 448 451 452 452
xiv 9.3.2.2 O r a n g e Juice . . . . . . . . . . . . . . . . . . . . . . . . . . 9.3.2.3 T o m a t o Juice . . . . . . . . . . . . . . . . . . . . . . . . . . 9.3.2.4 Maple Syrup .......................... 9.3.2.5 O t h e r Juices . . . . . . . . . . . . . . . . . . . . . . . . . . . 9.3.3 Electrodialysis . . . . . . . . . . . . . . . . . . . . . . . . . . . . . . . 9.4 Pigments and Colorants . . . . . . . . . . . . . . . . . . . . . . . . . . . . . . 9.5 Conclusions . . . . . . . . . . . . . . . . . . . . . . . . . . . . . . . . . . . . . References . . . . . . . . . . . . . . . . . . . . . . . . . . . . . . . . . . . . . . . . .
452 457 458 458 459 459 460 460
Chapter 10. MEMBRANE CONTACTORS Bradley W. Reed, Mlchael J. Semmens and Edward L. Cussler 10.1 10.2
10.3
10.4 10.5
W h a t A r e M e m b r a n e Contactors? . . . . . . . . . . . . . . . . . . . . . . . . Q u a n t i t a t i v e Description of Contractors . . . . . . . . . . . . . . . . . . . . . 10.2.1 Key E q u a t i o n s . . . . . . . . . . . . . . . . . . . . . . . . . . . . . . . 10.2.2 Mass-Transfer Correlations . . . . . . . . . . . . . . . . . . . . . . . . Past Efforts . . . . . . . . . . . . . . . . . . . . . . . . . . . . . . . . . . . . . 10.3.1 A d v a n t a g e s of M e m b r a n e Contactors . . . . . . . . . . . . . . . . . . 10.3.2 D i s a d v a n t a g e s of Contactors . . . . . . . . . . . . . . . . . . . . . . . Specific E x a m p l e s . . . . . . . . . . . . . . . . . . . . . . . . . . . . . . . . . . B i b l i o g r a p h y of M e m b r a n e Contactor Applications . . . . . . . . . . . . . .
467 470 470 472 477 477 481 484 496
Chapter 1 I. ANALYSIS AND DESIGN OF MEMBRANE PERMEATORS FOR GAS SEPARATION Amltceta Sengupta and Kamalesh K. Slrkar 11.1 I n t r o d u c t i o n . . . . . . . . . . . . . . . . . . . . . . . . . . . . . . . . . . . . . 11.2 Scope of This C h a p t e r . . . . . . . . . . . . . . . . . . . . . . . . . . . . . . . 11.3 G o v e r n i n g E q u a t i o n s a n d Useful Definitions . . . . . . . . . . . . . . . . . . 11.4 Process Design O p t i o n s a n d Separation Schemes . . . . . . . . . . . . . . . 11.5 I m p o r t a n t C o n s i d e r a t i o n s in P e r m e a t i o n Analysis . . . . . . . . . . . . . . . 11.6 Literature R e v i e w of P e r m e a t o r Analysis a n d Design . . . . . . . . . . . . . 11.7 C o m p l e t e l y Mixed Flow for a M u l t i c o m p o n e n t S y s t e m . . . . . . . . . . . . 11.8 C o m m o n A s s u m p t i o n s in Analysis a n d Design . . . . . . . . . . . . . . . . 11.9 H o l l o w - f i b e r P e r m e a t o r s for Binary S y s t e m . . . . . . . . . . . . . . . . . . 11.10 Spirally W o u n d P e r m e a t o r s for Binary S y s t e m . . . . . . . . . . . . . . . . . 11.11 D e s i g n A p p r o a c h e s for Hollow-fiber P e r m e a t o r s . . . . . . . . . . . . . . . 11.12 H o l l o w - f i b e r P e r m e a t o r s for M u l t i c o m p o n e n t S y s t e m s . . . . . . . . . . . . 11.13 P e r m e a t i o n in Presence of S w e e p Gas . . . . . . . . . . . . . . . . . . . . . . 11.14 N u m e r i c a l T e c h n i q u e s for Solution . . . . . . . . . . . . . . . . . . . . . . . 11.15 M u l t i m e m b r a n e M o d u l e C o n f i g u r a t i o n s . . . . . . . . . . . . . . . . . . . . 11.16 Recycle a n d Reflux . . . . . . . . . . . . . . . . . . . . . . . . . . . . . . . . . 11.17 Shortcut Analysis a n d Design M e t h o d s . . . . . . . . . . . . . . . . . . . . . 11.18 G e n e r a l C o m m e n t s o n Separation Behavior . . . . . . . . . . . . . . . . . . 11.19 N o t a t i o n . . . . . . . . . . . . . . . . . . . . . . . . . . . . . . . . . . . . . . . References . . . . . . . . . . . . . . . . . . . . . . . . . . . . . . . . . . . . . . . . .
499 500 501 504 508 514 516 518 519 529 531 532 534 535 537 540 541 545 546 550
XV
Chapter 12. GAS SEPARATION USING INORGANIC MEMBRANES Klaas Kelzer, Robert J.R. Uhlhom and Ton J. Burggraaf 12.1 12.2
Introduction ..................................... M e m b r a n e Structure, P r e p a r a t i o n a n d M o d i f i c a t i o n . . . . . . . . . . . . . . 12.2.1 M e m b r a n e S t r u c t u r e . . . . . . . . . . . . . . . . . . . . . . . . . . . 12.2.2 M e m b r a n e P r e p a r a t i o n . . . . . . . . . . . . . . . . . . . . . . . . . . 12.2.3 M e m b r a n e M o d i f i c a t i o n . . . . . . . . . . . . . . . . . . . . . . . . . 12.3 T r a n s p o r t of G a s e s T h r o u g h M e m b r a n e s . . . . . . . . . . . . . . . . . . . . 12.3.1 P o r e size dp > 50 n m . . . . . . . . . . . . . . . . . . . . . . . . . . . . 12.3.2 P o r e Size 2 n m < dp < 50 n m . . . . . . . . . . . . . . . . . . . . . . . 12.3.3 P o r e Size dp < 2 n m . . . . . . . . . . . . . . . . . . . . . . . . . . . . 12.3.4 D e n s e M e m b r a n e s ; P o r e Size d p = 0 n m . . . . . . . . . . . . . . . . . 12.4 G a s S e p a r a t i o n U s i n g I n o r g a n i c M e m b r a n e s . . . . . . . . . . . . . . . . . . 12.4.1 T y p e s of G a s S e p a r a t i o n . . . . . . . . . . . . . . . . . . . . . . . . . 12.4.2 S e p a r a t i o n of P e r m a n e n t G a s e s at R o o m T e m p e r a t u r e . . . . . . . . 12.4.3 S e p a r a t i o n of C o n d e n s a b l e G a s e s at R o o m T e m p e r a t u r e . . . . . . . 12.4.4 S e p a r a t i o n of C o n d e n s a b l e G a s e s at T e m p e r a t u r e s b e t w e e n 100 a n d 300°C . . . . . . . . . . . . . . . . . . . . . . . . . . . . . . . . . . . 12.4.5 S e p a r a t i o n of H2 or 0 2 at T e m p e r a t u r e s A b o v e 250°C . . . . . . . . 12.4.6 N o n s e p a r a t i v e A p p l i c a t i o n s in H i g h - T e m p e r a t u r e M e m b r a n e Reactors ................................... 12.5 C o n c l u s i o n s a n d E v a l u a t i o n . . . . . . . . . . . . . . . . . . . . . . . . . . . List of S y m b o l s . . . . . . . . . . . . . . . . . . . . . . . . . . . . . . . . . . . . . . . . References .........................................
553 556 556 557 560 561 562 564 569 572 576 576 577 577 578 578 580 581 583 584
Chapter 13. ECONOMICS OF GAS SEPARATION MEMBRANE PROCESSES Robert Spillman 13.1
Introduction . . . . . . . . . . . . . . . . . . . . . . . . . . . . . . . . . . . . . .
589
13.2
Applications and Technology Background ................... 13.3.1 C o m m e r c i a l A p p l i c a t i o n s a n d S u p p l i e r s . . . . . . . . . . . . . . . . 13.2.2 G a s S e p a r a t i o n M e m b r a n e T e c h n o l o g y . . . . . . . . . . . . . . . . . . 13.2.2.1 M e m b r a n e C l a s s e s . . . . . . . . . . . . . . . . . . . . . . . 13.2.2.2 P r i n c i p l e s . . . . . . . . . . . . . . . . . . . . . . . . . . . . 13.2.2.3 M o d u l e C o n f i g u r a t i o n s . . . . . . . . . . . . . . . . . . . . P r i n c i p l e s of M e m b r a n e P r o c e s s D e s i g n . . . . . . . . . . . . . . . . . . . . . 13.3.1 Basic P e r f o r m a n c e P r i n c i p l e s . . . . . . . . . . . . . . . . . . . . . . . 13.3.1.1 P r o d u c t is t h e R e s i d u e G a s s t r e a m . . . . . . . . . . . . 13.3.1.2 P r o d u c t is the P e r m e a t e S t r e a m . . . . . . . . . . . . . . . 13.3.1.3 G e n e r a l C o n c l u s i o n s . . . . . . . . . . . . . . . . . . . . . . . 13.3.2 D e s i g n T r a d e - o f f s . . . . . . . . . . . . . . ' ............... Membrane Process Designs ............................ 13.4.1 D e f i n i t i o n s . . . . . . . . •. . . . . . . . . . . . . . . . . . . . . . . . . 13.4.2 A s s u m p t i o n s . . . . . . . . . . . . . . . . . . . . . . . . . . . . . . . . . 13.4.3 S i n g l e - S t a g e M e m b r a n e P r o c e s s e s . . . . . . . . . . . . . . . . . . . . . 13.4.3.1 S i n g l e - S t a g e w i t h F e e d C o m p r e s s i o n . . . . . . . . . . . .
591 591 592 592 594 595 596 596 596 599 601 602 603 603 604 607 607
13.3
13.4
. .
xvi
13.5
13.4.3.2 Single-Stage w i t h P e r m e a t e V a c u u m or Diluent Gas . . . 608 13.4.3.3 Single-Stage w i t h Recycling . . . . . . . . . . . . . . . . . . 609 13.4.3.4 Single- vs. Multistage Processes . . . . . . . . . . . . . . . 611 13.4.4 Two-Stage M e m b r a n e Processes . . . . . . . . . . . . . . . . . . . . . 611 13.4.4.1 Two-Stage M e m b r a n e Series . . . . . . . . . . . . . . . . . 611 13.4.4.2 Two-Stage M e m b r a n e Series with Recycling . . . . . . . . 614 13.4.4.3 Two-Stage M e m b r a n e Cascade . . . . . . . . . . . . . . . . 615 13.4.4.4 Two-Stage Cascade w i t h Recycling . . . . . . . . . . . . . 615 13.4.4.5 Ideal Two-Stage Cascade with Recycling . . . . . . . . . . 617 13.4.5 Three-Stage . . . . . . . . . . . . . . . . . . . . . . . . . . . . . . . . . 617 13.4.5.1 Two-Stage Recycle Cascade with P r e m e m b r a n e . . . . . . 617 13.4.5.2 Two-Stage Cascade w i t h P o s t m e m b r a n e . . . . . . . . . . 617 13.4.6 O t h e r M e m b r a n e Process Designs . . . . . . . . . . . . . . . . . . . . 619 13.4.6.1 C o n t i n u o u s M e m b r a n e C o l u m n s . . . . . . . . . . . . . . . 619 13.4.6.2 Designs Utilizing Different M e m b r a n e s . . . . . . . . . . . 619 13.4.7 H y b r i d Systems . . . . . . . . . . . . . . . . . . . . . . . . . . . . . . 621 13.4.7.1 M e m b r a n e / S o l v e n t Treating . . . . . . . . . . . . . . . . . 621 13.4.7.2 M e m b r a n e / Cryogenic Distillation . . . . . . . . . . . . . . 621 13.4.7.3 M e m b r a n e / P r e s s u r e Swing A d s o r p t i o n (PSA) . . . . . . . 622 13.4.7.4 M e m b r a n e / C o n d e n s e r s . . . . . . . . . . . . . . . . . . . . 622 13.4.7.5 M e m b r a n e / I n e r t Gas C o m b u s t o r s . . . . . . . . . . . . . . 622 13.4.7.6 O t h e r . . . . . . . . . . . . . . . . . . . . . . . . . . . . . . . 623 13.4.8 M e m b r a n e Process O p t i m i z a t i o n . . . . . . . . . . . . . . . . . . . . 623 Case Studies of M e m b r a n e Applications . . . . . . . . . . . . . . . . . . . . 623 13.5.1 O v e r v i e w . . . . . . . . . . . . . . . . . . . . . . . . . . . . . . . . . . 623 13.5.2 O x y g e n / N i t r o g e n Separation . . . . . . . . . . . . . . . . . . . . . . 624 13.5.2.1 N i t r o g e n P r o d u c t i o n . . . . . . . . . . . . . . . . . . . . . . 625 13.5.2.2 O x y g e n P r o d u c t i o n . . . . . . . . . . . . . . . . . . . . . . 629 13.5.3 H y d r o g e n Separations . . . . . . . . . . . . . . . . . . . . . . . . . . 632 13.5.3.1 A m m o n i a Purge Gas . . . . . . . . . . . . . . . . . . . . . . 633 13.5.3.2 Refinery H y d r o g e n Recovery . . . . . . . . . . . . . . . . . 635 13.5.3.3 Petrochemical Applications . . . . . . . . . . . . . . . . . . 640 13.5.3.4 H y d r o g e n P r o d u c t i o n . . . . . . . . . . . . . . . . . . . . . 642 13.5.4 C a r b o n Dioxide Separations . . . . . . . . . . . . . . . . . . . . . . . 644 13.5.4.1 N a t u r a l Gas Treating . . . . . . . . . . . . . . . . . . . . . . 644 13.5.4.2 C a r b o n Dioxide E n h a n c e d Oil Recovery . . . . . . . . . . 649 13.5.4.3 Landfill Gas a n d Digester Gas U p g r a d i n g . . . . . . . . . 652 13.5.4.4 Flue Gas Recovery . . . . . . . . . . . . . . . . . . . . . . . 653 13.5.5 Water Vapor R e m o v a l . . . . . . . . . . . . . . . . . . . . . . . . . . 654 13.5.5.1 Air Dehumidification . . . . . . . . . . . . . . . . . . . . . 654 13.5.5.2 D r y e r Exhaust Dehumidification . . . . . . . . . . . . . . . 654 13.5.5.3 N a t u r a l Gas Dehumidification . . . . . . . . . . . . . . . . 655 13.5.5.4 Vehicle Exhaust Moisture Recovery . . . . . . . . . . . . . 656 13.5.6 O t h e r Applications . . . . . . . . . . . . . . . . . . . . . . . . . . . . 656 13.5.6.1 H e l i u m Separations . . . . . . . . . . . . . . . . . . . . . . 656
xvii
13.6
13.5.6.2 S o l v e n t V a p o r R e c o v e r y . . . . . . . . . . . . . . . . . . . . 13.5.6.3 H y d r o c a r b o n D e w P o i n t i n g . . . . . . . . . . . . . . . . . . 13.5.6.4 H y d r o c a r b o n C o n d e n s a t i o n . . . . . . . . . . . . . . . . . 13.5.6.5 O t h e r S e p a r a t i o n s . . . . . . . . . . . . . . . . . . . . . . . 13.5.7 O t h e r I n f o r m a t i o n S o u r c e s . . . . . . . . . . . . . . . . . . . . . . . . Summary and conclusions ............................
References
.........................................
657 660 660 660 661 661 663
Chapter 14. CATALYTIC MEMBRANE REACTORS John L. Falconer, Richard D. Noble and Davld P. Sperry 14.1
Introduction
. . . . . . . . . . . . . . . . . . . . . . . . . . . . . . . . . . . . .
14.2
Membranes
. . . . . . . . . . . . . . . . . . . . . . . . . . . . . . . . . . . . .
669 674
14.2.1 N o n p o r o u s Metallic M e m b r a n e s . . . . . . . . . . . . . . . . . . . . 14.2.2 N o n p o r o u s O x i d e M e m b r a n e s . . . . . . . . . . . . . . . . . . . . . . 14.2.3 P o r o u s C e r a m i c a n d G l a s s M e m b r a n e s . . . . . . . . . . . . . . . . . 14.2.4 Z e o l i t e M e m b r a n e s . . . . . . . . . . . . . . . . . . . . . . . . . . . . 14.3 S e p a r a t i o n M e c h a n i s m s . . . . . . . . . . . . . . . . . . . . . . . . . . . . . . 14.3.1 N o n p o r o u s M e m b r a n e s . . . . . . . . . . . . . . . . . . . . . . . . . . 14.3.2 P o r o u s M e m b r a n e s . . . . . . . . . . . . . . . . . . . . : ....... 14.3.2.1 K n u d s e n D i f f u s i o n . . . . . . . . . . . . . . . . . . . . . . . 14.3.2.2 Surface D i f f u s i o n . . . . . . . . . . . . . . . . . . . . . . . . 14.3.2.3 C a p i l l a r y C o n d e n s a t i o n . . . . . . . . . . . . . . . . . . . . 14.3.2.4 M o l e c u l a r Sieve S e p a r a t i o n . . . . . . . . . . . . . . . . . . 14.4 E x p e r i m e n t a l S t u d i e s of C M R s . . . . . . . . . . . . . . . . . . . . . . . . . . 14.4.1 E q u i l i b r i u m - L i m i t e d R e a c t i o n s . . . . . . . . . . . . . . . . . . . . . 14.4.1.1 O r g a n i c R e a c t i o n s . . . . . . . . . . . . . . . . . . . . . . . 14.4.1.2 I n o r g a n i c R e a c t i o n s . . . . . . . . . . . . . . . . . . . . . . 14.4.1.3 C o n t r o l l e d A d d i t i o n of R e a c t a n t s . . . . . . . . . . . . . . 14.4.2 S i m u l t a n e o u s R e a c t i o n s . . . . . . . . . . . . . . . . . . . . . . . . . . 14.4.3 Z e o l i t e M e m b r a n e R e a c t o r s . . . . . . . . . . . . . . . . . . . . . . . 14.5 T h e o r e t i c a l A n a l y s i s a n d O p e r a t i o n of C M R s . . . . . . . . . . . . . . . . . 14.5.1 A n a l y s i s . . . . . . . . . . . . . . . . . . . . . . . . . . . . . . . . . . . 14.5.2 A d d i t i o n a l Factors Affecting C M R O p e r a t i o n . . . . . . . . . . . . . 14.6 S u m m a r y . . . . . . . . . . . . . . . . . . . . . . . . . . . . . . . . . . . . . . Acknowledgments ..................................... Notation ........................................... References . . . . . . . . . . . . . . . . . . . . . . . . . . . . . . . . . . . . . . . . .
675 676 676 677 678 680 683 683 685 687 688 689 689 690 692 694 698 699 700 700 706 707 708 708 709
Subject I n d e x
713
. . . . . . . . . . . . . . . . . . . . . . . . . . . . . . . . . . . . . . . .
xix
List of contributors Jose R. Alvarez Department of Chemical Engineering, University of Oviedo, Oviedo, Spain L. Boyadzhiev Institute of Chemical Engineering, Bulgarian Academy of Sciences, Sofia, Bulgaria Ton J. Burggraaf University of Twente, Faculty of Chemical Technology, Laboratory of Inorganic Chemistry, Materials Science and Catalysis, P.O. Box 217, 7500 AE Enschede, The Netherlands Y. Cen Physikalisch-Chemisches Institut, Universit/it Heidelberg, Im Neuenheimer Feld 253, 69120 Heidelberg, Germany Munir Cheryan Department of Food Science, 103 Agricultural Bioprocess Laboratory, University of Illinois, Urbana, IL 61801, USA Edward L. Cussler Chemical Engineering and Materials Science Department, University of Minnesota, 421 Washington Ave. SE, Minneapolis, MN 55455, USA William Eykamp 246 Pleasant Street, Arlington, MA 02174, USA John L. Falconer Department of Chemical Engineering, UDJversity of Colorado, Boulder, Colorado 80309-0424, USA
C.J.D. Fell Centre for Membrane and Separation Technology, University of New South Wales, Kensington 2033, Australia Klaas Keizer University of Twente, Faculty of Chemical Technology, Laboratory of Inorganic Chemistry, Materials Science and Catalysis, P.O. Box 217, 7500 AE Enschede, The Netherlands Z. Lazarova Institute of Chemical Engineering, Bulgarian Academy of Sciences, Sofia, Bulgaria
XX
R.N. Lichtenthaler
Physikalisch-Chemisches Institut, Universit/it Heidelberg, Im Neuenheimer Feld 253, 69120 Heidelberg, Germany Stephen L. Matson
Arete Technologies Inc., 15 Withington Lane, Harvard, MA 01451, USA M.H.V. Mulder University of Twente, Faculty of Chemical Technology, P.O. Box 217, 7500 AE Enschede, The Netherlands J. N~el
Ecole Nationale Sup~rieure des Industries Chimiques, B.P. 451,1 rue Grandville, 54001 Nancy Cedex, France Richard D. Noble
Department of Chemical Engineering, University of Colorado, Boulder, Colorado 80309-0424, USA Bradley W. Reed
Hoechst Celanese Corporation, Separations Products Division, Charlotte, NC 28273, USA Michael J. Semmens
Civil Engineering Department, University of Minnesota, Minneapolis, MN 55455, USA Amitava Sengupta
Hoechst Celanese Corporation, 13800 South Lakes Drive, Charlotte, NC 28273, USA Kamalesh K. Sirkar
Chemical Engineering, Chemistry and Environmental Science Department, New Jersey Institute of Technology, Newark, NJ 07102, USA David P. Sperry
Department of Chemical Engineering, University of Colorado, Boulder, Colorado 80309-0424, USA Robert Spillman
Amicon, Inc., 72 Cherry Hill Drive, Beverly, MA 01915, USA H. Strathmann
University of Twente, Faculty of Chemical Technology, P.O. Box 217, 7500 AE Enschede, The Netherlands Robert J.R. Uhlhorn
University of Twente, Faculty of Chemical Technology, Laboratory of Inorganic Chemistry, Materials Science and Catalysis, P.O. Box 217, 7500 AE Enschede, The Netherlands
Membrane Separations Technology. Principles and Applications Edited by R.D. Noble and S.A. Stern 9 1995, Elsevier Science B.V. All rights reserved
Chapter 1
Microfiltration and ultrafiltration William Eykamp 246 Pleasant Street, Arlington, MA 02174, USA
1.1 INTRODUCTION Membrane separation is practised on feed streams ranging from gases to colloids. Microfiltration (MF) membranes are used to retain colloidal particles as large as several micrometers. MF overlaps conventional filtration for separation of small particles. Gas separation membranes operate at the other extreme of molecular size. Molecules with a size of 0.3 nm, with a resolution in diameter of 0.02 nm are separated. Tb.e range of effective separation diameters of membrane applications is thus a ratio of about 10 4. Microfiltration membranes have the largest pores, and ultrafiltration (UF) membranes the next largest. To the newcomer, UF and MF look similar, and in fact they are more alike than they are different. Because of their very different historical background, however, they remain very distinct to practitioners and to equipment and membrane manufacturers. Membrane mediated fractionation, the separation of a stream into two fractions on the basis of molecular or particulate size, is the primary use of UF and is a significant application of MF. Both processes work primarily by size exclusion, permitting smaller species to pass through a membrane while larger ones are retained. Both processes were developed for, and find the vast preponderance of their applications in, aqueous separations. Microfiltration is also used in gas-phase filtration, and both processes have some non-aqueous liquid uses. Membranes also compete with processes such as centrifugation and chromatography. There are other membrane processes closely related to UF and MF. Hemodialysis, the artificial kidney, is the largest by far of all membrane applications.
1 -- MICROFILTRATION AND ULTRAFILTRA~ON
2
Psuedomonils dlmlnuta influenza 0.28p
NIl+ 0.71)
0
I
Sucrose
o
0
Hemoglobin
~Stil~Ylct~176
virus
(IOX)
1
o
0
i
t
UtmflltmUon
"
I MlcroflltraUon
II
Conventional
filtration
Reverse
o,nlo, m lJL
101
l~X
l~g l~m dlilm~W
I IJ
~o ~
~oo IJ
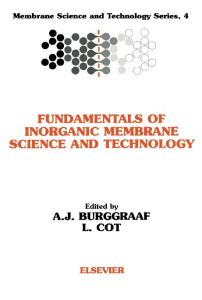
Fig. 1.1. Reverse osmosis, ultrafiltration, microfiltration and conventional filtration are all related processes differing principally in the average pore diameter of the membrane. Reverse osmosis membranes are so dense that discrete pores may not exist. In many ways, the dialysis membrane is akin to a UF membrane, but the driving force for mass transfer is a concentration difference, while in UF and MF, the driving force is pressure. Hemodialysis is a relatively young separations application, but it is fully mature commercially. Membrane dialysis is established as a treatment for kidney failure in all industrialized countries. Prices and costs have dropped progressively; the industry has been "shaken out", and it is possible to purchase sterile membrane cartridges ready to attach to dialysis water and a patient for less than $14/m 2. Although the market for hemodialysis membranes is larger than the market for all other membrane separation processes combined, whether measured by area or by value, hemodialysis is outside the scope of this work. Interested readers may find more information in a recent book [1]. 1.1.1 Historical
Microfiltration membranes are second only to dialysis as the oldest membrane application stiK practised commercially. Microfiltration grew out of the
1 ~ MICROFILTRATION AND ULTRAFILTRATION
3
discovery of nitrocellulose in 1846. Cellulose nitrate membranes were reported by Frick in 1855. Early cellulose nitrate membranes were prepared by dipping a test tube in a collodion solution [2]. Surprisingly, some of these early materials are still used today. Membrane development continued for decades, mostly in Germany. Bechhold published means to vary pore size by varying polymer concentration in 1906. In 1918, Zsigmondy and Bachmann published means to make small quantifies of "parchment-like" MF membrane, including a description of how to vary pore size. Zsigmondy, in 1922, got a U.S. patent on his invention made by exposing a thin coating of a nitrocellulose solution to humid air [3]. Sartorius started producing membranes commercially in 1927 [4]. Commercial development was very slow until shortly after World War II. The discovery that propelled MF into large-scale commercial production was one attributed to Gertrude Mueller at the Hygiene Institute, University of Hamburg, that the micro flora from a large volume of water could be deposited intact on a small disk of microfiltration membrane. By culturing the membrane and counting the colonies, rapid and accurate determinations of the safety of drinking water could be made. This discovery was particularly important in post-war Germany, where much of the civil infrastructure was damaged [5]. Microfiltration technology was investigated by the U.S. Joint Intelligence Objectives Agency in their post-war assessment of German science and technology. The leading investigator was Alexander Goetz [6], who later developed his findings under contract with the U.S. Army. In 1950, the Lovell Chemical Company won a contract to develop Goetz' work further. A series of reports ranging from November 1950 through April 1954 chronicles the difficult transition of MF membranes from the laboratory to semicommercial production. The report of September 1951 is particularly interesting because it despairs of ever making large sheets of MF membrane. Glass plates, it says, are "too plastic" in large sizes to be kept fiat. Membranes require a "precisely fiat surface". Glass is subject to "cold flow". "Controls of great precision and nicety are so prerequisite to the making of a satisfactory MF that we strongly urge upon the Chemical Corps the concept that microfilters should not (and cannot) be a cheap item of manufacture comparable to filter paper. The day that expensive controls are abandoned for even normally careful standard production, the MF functional characteristics will be wholly undependable and the output will be rendered worthless as a reliable quantitative bacteriological tool." The report was signed by John R. Bush, who later bought the technology from Lovell and founded MiUipore Corporation, now the world leader in microfiltration. Reverse osmosis and ultrafiltration came much later in time. Curiously enough, neither developed from microfiltration. UF membranes were attempted in microfiltration firms, and some were made, but UF clearly is derived from RO in almost all important respects. The differences in the route of develop-
4
1 - MICROFILTRATION AND ULTRAFILTRATION
ment of MF and UF continues to divide the two fields to this day; firms outstanding in one field have little presence in the other, even though the two disciplines are now closely related technically. The major problem that prevented microfiltration membrane technology from being extended to smaller and smaller pores was the one of throughput. As pore size decreases, so does the amount of fluid that may be pushed through the membrane. The problem may be illustrated by considering the equation for flow through a cylindrical pore in a membrane of a certain thickness: lt AP d 4
q = 128, t
(1.1)
where q is the volumetric flowrate through the pore (m 3 s-l), &P is pressure drop, pascals, d is pore diameter (m), ~t is viscosity (Pa s m-2), and t is the membrane thickness (m). The throughput of a membrane, referred to as its flux, is the sum of the outputs of its pores. Flux, the symbol for which is usually J, is a velocity with units m s-1 but in practice it is more easily measured in ~rn s-1. It is the average velocity for the entire membrane surface. In practice, flux is almost always reported as volume per area and time, with common units of I m -2 h -1 or gal ft -2 day -1. For a membrane, N ]=q A
(1.2)
where N is the number of pores in area A m 2. From geometry, the number of uniform circular pores that will fit in a square is proportional to the inverse square of pore diameter. N o~ d -2 A
(1.3)
So, for constant pressure drop, fluid viscosity and membrane thickness, j o, d -2
(1.4)
The pore size suitable for UF is of magnitude 10 nm; for MF, it is of magnitude 200 nm. Thus, a microfiltration membrane with high throughput will, if made as an UF membrane, have a throughput much less than 1% of the MF value. The UF throughput problem was trivial compared to that for reverse osmosi6. Insofar as it is reasonable to speak of "pores" in an RO membrane, they would be smaller than those in a UF membrane by another order of magnitude. The problem was solved for RO with the invention of the skinned membrane (see below). The solution was quickly copied for UF, for it solved the UF flux problem. The RO membrane, not the MF membrane, is the direct predecessor of the UF membrane [7].
1 -- M I C R O F I L T R A T I O N
AND ULTRAFILTRATION
5
The RO membrane breakthrough occurred in 1959, with the invention at UCLA of the Loeb-Sourirajan membrane. Working with cellulose acetate, which Reid [8] had reported as having superior salt rejection properties, the inventors found a way to make an asymmetric m e m b r a n e - - a very thin skin integrally attached to an otherwise porous backing. In effect, they found a way to make the factor t in Eq. (1.1) very small without a negative impact on mechanical toughness or durability. High flux membranes thereby became possible. While the group at UCLA pursued RO membranes as their principal thrust, a group under Alan Michaels, first at MIT, later at Amicon Corp., went after ultrafiltration membranes. Although many materials were tried for UF membranes, grades of cellulose acetate similar to those useful in RO would produce membranes with fairly good properties as ultrafilters. Because cellulosic polymers have chemical properties that limit their industrial suitability, Dorr-Oliver began a search for other polymers from which asymmetric UF membranes could be prepared - - initially by sponsoring research at Amicon. The decade beginning in 1965 was one of explosive development activity in UF, both in membranes and in processes. Cellulose acetate membranes were soon displaced by a variety of noncellulosic membranes invented independently by several investigators within a short time span. Polyacrylordtrile UF membranes were discovered in a failed attempt to prepare an RO membrane, as described in a 1965 report [9]. Polysulfone membranes were first made as support films for RO membranes [10]. Polyvinylidene fluoride membranes were first made by accident [11]. 1.2 THE M E M B R A N E FILTRATION PROCESS
1.2.1 Crossflow Conventional filtration processes operate in dead-end flow. That is the familiar filtration procedure, used for filtering a precipitate with filter paper or for straining spaghetti; the flow is normal to the face of the filter. Ultrafiltration is conventionally done in cross flow, with the principal flow parallel to the surface of the filter medium. Microfiltration is practised both ways. Crossflow operation is neither obvious nor difficult, and a good understanding of the reasons for its use is necessary for an understanding of membrane filtration. One major difference in the operation of these two schemes is conversion per pass. In dead-end filtration, essentially all of the fluid entering the filter is either retained by the cake or emerges as permeate, so the conversion can approach 100%, all occurring in the first pass. For a crossflow filter, far more of the feed passes past the membrane than passes through it, and conversion per pass for a long string of filter elements in series is generally > dip Deposition
CASE D" I SELECTIVE PLUGGING OF LARGER PoREs ]
d>dp
Fig. 1.6. Fouling Schematics (after Belfort). Case A: Particles plug smaller pores and narrow larger ones. Case B: Particles plug narrow pores. Case C: Particles form a layer on the membrane. Case D" Particles or debris plug largest pores.
Case A: Adsorption causes all pores to become smaller, and may result in the smallest pores plugging. In the case of a protein probe present in dilute solution, this fouling error would cause the test to understate the size of all pores, and could truncate the distribution on the low pore size end. Case B: Pore plugging. In the absence of any adsorption, particles may plug pores. For the example shown, smaller pores would be expected to suffer disproportionately. Remember, the drawing is an artistic simplification. Pores are not created by precision drills in uniform materials. The entrance to a pore may be fairly sharp in a mica membrane exposed to radiation and etched by chemicals prepared by a careful chemist, but in the real world of membranes, pore openings are considerably less precise. Pore openings may be conical, they may be other shapes, and for many materials, "pore" is a tenuous concept. Nonetheless, to some degree the small openings are more susceptible to being plugged by small particles. Case C represents the deposition of a material that supersedes the porous structure of the membrane. The membrane now becomes analogous to a precoat filter. Fouling is irreversible to the extent that the layer nearest the membrane
1 ~ MICROFILTRATION AND ULTRAFILTRATION
25
is probably adsorbed onto it. Throughout the layer, the binding may or may not be irreversible. At the fluid interface, quite a degree of dynamic reversibility remains. One may assume that in all cases, the effect is to shift the effective pore size downwards. Case D is peculiar to membranes with small pores filtering particles much larger than the pores. An example is UF membranes processing electrodeposition paint, all of whose particles are much larger than most membrane pores. The effect is to plug the large holes, leaving the smaller ones. It is case B in reverse. The effect is to reduce the average pore diameter by affecting only the high end of the distribution. Case D is familiar to operators of industrial equipment who often find that macroscopic seal leaks are effectively plugged by the gross debris in a feed stream. 1.3.1.3.1 Effects on Flux Fouling affects flux dramatically. The pure water flux through a virgin UF membrane is commonly tenfold greater than the water flux after the membrane has been exposed to protein. Flow will be laminar through a cylindrical pore because of the size. To summarize Eqs. (1.1)-(1.3), flux through a given area containing N cylindrical pores each having diameter d, oo
n AP
N i
J= 128 g----'~~ -A- d4
(1.29)
0
Reviewing the four cases of pore narrowing, Case B, in which smaller pores are plugged and larger ones are tmaffected, will have the least impact on flux. Case A, narrowing of all pores and plugging of some of the smallest, will have a greater impact, because loss of some pore dimension is particularly important given the fourth power of diameter. Case C is a guess, as the porosity of a cake layer on the membrane can be anything. Case D results in a dramatic loss of throughput, because that form of plugging takes out the most productive pores. 1.3.1.3.2 Overall Effect on Retention Passage of material through a pore obviously depends on how much is flowing and what that pore will pass. Big pores pass large quantifies, but their retention is different from smaller pores. As a membrane fouls, the retention characteristics worked out for the virgin membrane will change, often dramaticaUy. A few general rules apply. Fouling processes that plug the smallest pores have little effect on retention. In theory they would be expected to lower retention somewhat, as the most retentive pores are plugged leaving the larger
26
1 ~ MICROFILTRATION A N D ULTRAFILTRATION
less retentive ones, but the contribution of the smallest pores to overall output is normally low anyway. When fouling lowers retention it is probably because of the artifact resulting in the definition of retention: bulk concentration may be constant but concentration at the membrane may rise considerably due to fouling and the resulting impediment to back diffusion. Fouling by almost any other mechanism raises retention. Either it substitutes a cake layer on top of the membrane, or it narrows pores, or it selectively plugs larger ones. It is poorly kept secret that many membranes do not do the job they are sold to do until they are a little bit fouled. In an ideal world, membranes would contain a very high density of fully uniform cylindrical pores. It is perhaps instructive that in spite of the very creative effort invested in "sharp" membranes, their share of the overall membrane market is very small. Practically speaking, "ordinary" membranes have proven to be adequate for most separations.
1.4 M E M B R A N E M O D U L E S
In the discussion of the importance of the boundary layer, we saw that the output of a UF or MF membrane device is controlled by mass transfer at the membrane surface. There are special cases in which this generalization is not followed. One is the case where the solvent being processed is almost devoid of retained material. A second is the much more important case of fouling. Nevertheless, the way in which feed material is presented to the membrane is of critical importance. Ways to incorporate membrane area into subassemblies efficiently and economically is the objective of module design. A requirement of a module is that it be easily removed and replaced. Membranes have finite lives. They still fall short of perfection in their manufacture. Module size must balance the probability of including a defective membrane, which naturally rises with module size, with the economy of installation and replacement which, up to a practical limit, improves with module size. As membrane manufacture became more sophisticated, the probability of failure per unit area dropped dramatically. Therefore, the economics of module manufacture have pushed the membrane area per module up. Physical handling must be manageable, and the cost of special equipment for module replacement is an added capital cost, putting an upward limit on module size. More important is how the module manages the fluid flow of the feed. Most crossflow membrane devices operate in turbulent flow, so designing for low energy consumption (important for both operating economics and capital cost) requires avoiding sudden expansions and contractions in conduit diameter, and avoiding small radius bends. Both these requirements are very demanding, and pose major challenges to the designer. For modules designed for laminar
1 -- MICROFILTRATION
AND ULTRAFILTRATION
27
flow, sudden changes in conduit diameter are far less important than the diameter of the smallest passage through which the fluid must flow. For any module, reliability is increased if stagnation points, where fibrous material and debris will accumulate, are minimized. In spite of all their obvious shortcomings, spiral modules (see below) are widely used in both MF and UF, and their importance is both major and increasing.
1.4.1 Background Because the demands are stringent, and because of the high rate of innovation in the membrane industry, module design diverged considerably before it started to converge on certain winning designs. Early designs were 25 mm diameter tubes with the membrane cast inside (Abcor-Koch), capillaries (Amicon-Romicon) parallel plate designs (Dorr Oliver) and plate and frame devices (DDS). All of these had advantages, and each remains in the market. All have undergone development and refinement. While 25 m m tubes are still sold, the dominant polymeric tubular systems have 12 m m tubes. Ceramic devices usually have smaller channels, 4-6 m m diameter, and one new ceramic device has square cross section channels 1.9 m m on a side. Large tubular membranes illustrate the extreme case of attention to fluid mechanics. The membranes were designed to have a diameter change only at the manifold, and then to have 50 m of tubular membrane joined by large radius return bends before the feed passed into the exit manifold. There were no stagnation points, and seals were made on the ends of the tubes to avoid diameter changes in the fluid path. The devices had wonderful hydraulic efficiency, about 90% of all the pressure drop occurred at a membrane surface, and they were remarkably resistant to fibres and debris. They were also bulky and expensive. Membrane cassettes were at the other extreme. The fluid undergoes numerous direction reversals in very short radius turns. Significant pressure drop occurs in the inlet and outlet ports. But they are very compact and capable of automated manufacture. Evolved versions of these extremes persist, but over 50% of the membrane area sold in crossflow applications is in spiral wound modules.
1.4.2 Spiral Wound Spirals were not an early entry in UF or MF, they were invented in the early days of reverse osmosis [33] and found unsuitable for general UF. The unsatisfactory features were gradually designed out of the spiral, while the attractive attributes - - compactness, ease and economy of manufacture and ease of
28
1~
MICROFILTRATION
AND ULTRAFILTRATION
replacement ~ were maintained. The truly successful UF spiral required over a decade of constant improvement. Success inspired imitation, and there are now a number of manufacturers of spiral membranes offering a wide variety of membrane types, resulting in a competitive market for replacements and a decline in user's costs. For almost any new application, the spiral design must be inadequate in order for another design to prevail.
1.4.3 Capillary Capillary devices, designed so that the process fluid flows inside the hollow fibre with the permeate flowing through the wall into a module housing seem a natural for process applications, but difficulties in the manufacture of modules plagued them for years. Their chief market niche today is in ultrapure water UF, where the open path for permeate is an advantage. Capillaries are used in many other applications. In addition to the large volume capillary modules, there are two special variants. One, sold by Memtec (Australia) feeds the process stream on the shell side of the module with permeate exiting in the hollow fibre. This turns general design logic on its head, but it succeeds because of the innovation of pushing off the boundary layer accumulation of solids every few minutes with a blast of air pushed backwards through the membrane. The other variant (Mitsubishi Rayon Engineering) lets the fibres flop in the process stream because only the two ends are potted leaving numerous hairpin shaped membranes free to move in the fluid as it passes by. 1.4.3 Plate and Frame
Plate and frame devices are used in several applications. For most equipment, almost any fiat sheet stock may be fit into a plate and frame device, which can have a favorable influence on the economics of membrane replacement.
1.4.4 Cartridges For the applications where dead-end flow is appropriate, pleated cartridges are the usual answer. One firm reports a spiral run in dead-end flow, where in the early stages of filtration, some of the membrane area actually operates in cross flow. A strong movement towards compact and energy-efficient design is apparent. Economics dictate that membrane equipment be compact to reduce the "footprint" on expensive industrial floor space, and improvements in design and membrane reliability make that possible.
1 m MICROFILTRATION A N D ULTRAFILTRATION
29
1.5 FOULING Fouling is the term used to describe the loss of throughput of a membrane device as it becomes chemically or physically changed by the process fluid (often by a minor component or a contaminant) [34]. Fouling is different from concentration polarization. Both reduce output, and their resistances are additive. Fouling can be thought of as the effect causing a loss of flux which cannot be reversed while the process is running. An increase in concentration or viscosity, or a decrease in fluid velocity, or, in some operating ranges, pressure, will cause a flux decline. Any of the declines from these causes are reversible by restoring concentration, velocity, etc. to prior values. Restoring prior conditions will not restore flux if a membrane is fouled. That is the best test of fouling. Fouling is also distinct from membrane compaction, primarily a phenomenon resulting from irreversible creep in a membrane as a response to stress. This phenomenon is found in some reverse osmosis membranes, but at the pressures used in UF and MF, it may usually be ignored.
1.5.1 Prompt Fouling There are several types of fouling. Promptfouling is an adsorption phenomenon. It may occur so rapidly in an extreme case, that it may be observed by wetting a membrane with a process fluid without applying pressure. A marked decrease in water flux of the rinsed membrane indicates a strong likelihood of prompt fouling. It is thought to be caused by some component in the feed - protein is the most common cause--- adsorbing on the surface of, and partially obstructing the passages through, the membrane. The effect occurs in the first seconds of an ultrafiltration, making it difficult to spot. In addition to lowering the flux of the membrane, this type of fouling raises the retention. The effect is very common, although not always recognized as such. Often, membranes are characterized after it has occurred [35]. In fact, some membranes are not commercially useful until prompt fouling has taken place. In principle, and usually, it is a negative effect.
1.5.2 Cumulative Fouling Cumulativefouling is the slow degradation of membrane flux during a process run. It can reduce the flux to half its original value in minutes, or in months. It may be caused by minute concentrations of a poison, but is commonly the result of the slow deposition of some material in the feed stream onto the membrane. Usually, the deposition is followed by a rearrangement into a stable layer harder to remove. It is often related to prompt fouling, because the prompt fouling layer provides the foothold for a subsequent accumulation of foulant.
30
1 -- MICROFILTRATION AND ULTRAFILTRATION
1.5.3 Destructive Fouling Some fouling is totally irreversible. A substance present in the feed at low concentration having an affinity for the membrane is the usual culprit. Especially troublesome is a sparingly soluble substance at or near its saturation concentration. Such a material can slowly sorb in the membrane, and in the worst case, change the membrane's structure irreversibly. Antifoams are examples of a class of material responsible on occasion for destructive fouling. With the chemically robust membranes in use today, this effect is very unusual, unless a membrane feed has been contaminated with a damaging solvent.
1.5.4 Frequency of Fouling Virtually all membranes in all commercial applications foul: "how fast" is an important economic issue. Proper cleaning generally restores output. Membrane producers and purveyors of cleaning agents devote considerable effort to finding safe, effective and economical means of returning the membranes to full productivity. Frequently, cleaning agents slowly damage membranes, making them more susceptible to future fouling. While there are totally benign cleaning agents for some types of fouling, the more common foulants such as those involving proteins require aggressive cleaning agents to keep the cleaning cycle short. It is said that the cleaning requirements for membranes are the major determinant of membrane life [36]. Just as fouling influences design, design influences fouling. Figure 1.3 shows the normal pressure--flux output curve for crossflow filtration. Operating in the region towards the right (high pressure) will produce fouling more quickly than operation around the knee of the curve [37]. The region to avoid is the high-pressure, low-flow regime. Experience indicates that thick, dense boundary layers promote fouling [38]. Dead-end filtration would be a worst-case operating condition. Pressube driven equipment that operates membranes only in the low fouling region at or below the knee of the operating curve is very hard to design. Several firms are trying innovative approaches that decouple the pressure driving force from the membrane depolarizing force, such as by the use of vibration to promote mass transfer [39] the use of Taylor vortices [40] and the use of controlled permeate back pressure [41]. Fouling is the most important economic determinant of most crossflow membrane processes. Recently, researchers are finding ways to quantify results and publish meaningful papers on fouling. It is a particularly popular and important field with a rapidly expanding published information base.
1 ~ MICROFILTRATION AND ULTRAFILTRATION
31
1.6 APPLICATIONS
1.6.1 Microfiltration The market for MF membranes and equipment is a billion dollar giant dwarfing all other membrane applications except hemodialysis. It is a market with outstanding competitors and large R&D budgets, with firms generally possessing excellent market research, marketing and management. Major market areas are: sterile filtration, medical applications, biotechnology and fluid purification. Most of the microfiltration applications listed operate in dead-end flow. A few operate in cross flow. One important criterion for deciding whether crossflow is appropriate is the quantity of solids that must be retained by the microfilter. The higher the level of solids, the higher the likelihood that the crossflow filtration will be used. Streams containing high loadings of solids (>0.5%) processed by membrane filters usually operate in crossflow. As discussed in the section on the boundary layer and concentration polarization, the limit to the rate at which a crossflow device produces permeate is the rate at which solids retained by the membrane can redisperse into the bulk feed flowing past the surface. A cursory analysis of the mass transfer equations shows that the molecular diffusivity of the retained material is a direct determinate of how fast it diffuses away from the surface. The colloidal material retained by a microfilter has a very low value of diffusivity. The redispersion rate of retained material is thus calculated to be very low. In fact, microfiltration rates are often quite high compared to UF, even at lower crossflow velocity. The answer seems to lie in a shear enhanced particle diffusivity which results in dramatically increased flux [42]. Membrane filters operating on feeds with lower loadings of solids (, Average value.
144
5 PERVAPORATION -
-
(plasticized) by the permeating mixture and the swelling is "vectored" in the direction of the permeate flow, i.e., the swelling decreases from the upstream to the downstream side of the membrane. Mass transport by pervaporation across permselective membranes involves three successive steps: 1. upstream partitioning of the feed components between the flowing liquid mixture and the swollen upstream surface layer of the membrane. 2. diffusion of the components in the surface layer through the membrane; 3. desorption of these components at the downstream surface of the membrane. This process is obviously much more complex than simple vaporization, and one can easily understand that the permeate composition is widely different from that of the vapor in direct contact with the liquid feed after establishment of free liquid/vapor equilibrium [1]. The use of a membrane obtained from an appropriate polymeric material generally makes it possible to separate a number of positive binary azeotropic mixtures (Table 5.1). Due to its high selectivity for liquid mixtures that cannot be efficiently processed by conventional distillation, pervaporation is a useful alternative to distillation and a potential competitor to energy-consuming separation processes such as vacuum and extractive distillation [2]. Mass transport through a dense polymer membrane is a rather slow process and, therefore, pervaporation is not a complete separation technique in itself since pervaporators cannot be assembled in cascade, like plates in a distillation column. Pervaporation is generally used only to complement distillation when the latter process is inefficient, for instance, to pass over the azeotropic composition of a given binary liquid mixture. If the azeotrope contains unequal proportions of components A and B, pervaporation is carried out through a membrane preferentially permeable to the minor component in order to minimize the amount of permeate required to isolate a pure retentate at the outlet of a pervaporation module (Fig. 5.1). In the case of an azeotropic mixture containing nearly equivalent proportions of A and B (for instance the water-pyridine azeotrope which contains 41.3 wt% water), pervaporation is only used to split the feed into two non-azeotropic fractions, which can each be further separated by distillation (Fig. 5.2). The specific nature of pervaporation can be recognized by noting the differences that distinguish it from related membrane separation techniques, namely vapor permeation, membrane distillation, fractionation through gas barriers, and perstraction.
Vapor Permeation This term designates the fractionation of a saturated vapor mixture (emerging from a distillation column) by partial transport through a nonporous permselective membrane, the permeate side of which is kept under low press-
5 -- PERVAPORATION
145
TABLE 5.1 Typical positive azeotropic mixtures (characterized by a minimum boiling temperature) which can be separated by pervaporation through a permselective membrane obtained by grafting polyvinylpyrrolidone onto a thin polytetrafluoroethylene film [1] A-B Azeotropes Tb (A = Fast component) (~
Azeotrope characteristics
Selectivity
Tb (~162
c (%)
a
Is
Permeate flux (kg/h m 2)
A: Chloroform B: n-Hexane
61.2 69.0
60.0
72.0 28.0
3.9
1.25
2.65
A: Ethanol B: Cyclohexane
78.5 81.4
64.9
30.5 69.5
16.8
2.89
1.10
A: Butanol-1
117.4 81.4
78.0
10.0 90.0
23.5
7.23
0.30
B: Cyclohexane A: Water B: Ethanol
100.0 82.8
78.2
4.4 95.6
2.9
2.68
2.20
A: Water B: t-Butanol
100.0 82.8
79.9
11.8 88.2
41.0
7.17
0.35
100 B: Tetrahydrofurane 65.5
63.8
5.7 94.3
19.1
9.24
0.94
A: Water B: Dioxane
100.0 101.3
87.8
18.4 81.6
18.1
4.36
1.33
A: Ethanol B: Ethylacetate
78.5 77.2
71.8
31.0 69.0
2.4
1.67
0.95
A: Methanol B: Acetone
64.7 56.2
55.7
12.0 88.0
2.9
2.36
0.65
A: Ethanol B: Benzene
78.5 80.1
67.8
32.4 67.6
1.3
1.18
2.90
A: Water
The selectivities a and ~ are defined by the following ratios, respectively: ( c'A/C'B ) c'(1 - c) c" a =
cA/cB)
c O - c')
f~ =
where c and d are the weight concentrations of the faster permeant (A) in the feed (c) and the permeate (cO, respectively. Tb denotes the normal boiling point of an organic compound or of an azeotropic mixture (at 1 arm). Pervaporation temperature: T = 25~
146
s -Az.
I
F
D1
PERVAPORATION
Az.
!
)2
Fig. 5.2. Pervaporation-distillation integrated system designed to separate mixtures of water and pyridine (feed F), richer in water than the azeotropic mixture. (c~ = 41.3 wt% water). F: Feed (water+ pyridine, Cw> c,aLz);Da,D2: distillation columns; PV: pervaporator; M: hydrophih'c membrane; Cd: condenser; L: recycling loop; V: vacuum pump; C: circulating pump; P: water-rich permeate; R: pyridine-rich retentate; W: water (Big. T = 100"C); Pyr.: pyridine (Big. T = 1150C); Az.: azeotropic mixture (O,z = 41.3% of water by weight, Big. T = 92.6~
ure by continuous pumping [3]. A similar technique can be used to separate an easily condensable component, for instance an organic vapor which contaminates a gas stream [4]. In both the above cases, upstream partitioning, which operates in pervaporation, is replaced by sorption of the gaseous feed mixture that flows along the upstream surface of the permselective membrane. Membrane Distillation In the membrane distillation process [5], a liquid feed is fractionated after partial vaporization though a porous polymer membrane which is not wetted by the feed. The liquid feed cannot penetrate into the membrane pores as long as the upstream pressure does not exceed the minimum penetration pressure for the pore distribution. To fractionate aqueous mixtures, porous barriers made from hydrophobic polymers, such as polypropylene, polytetrafluoroethylene or polyvinylidene fluoride, can be used. According to this technique [6], the liquid feed is allowed to flow along one surface of the membrane, whereas the permeated vapor is condensed on a cooled wall, slightly apart from the opposite (downstream) surface of the membrane and parallel to it (Fig. 5.3). The transport regime is determined by the downstream pressure since the transfer of the vaporized permeate through the pores may take place, depending on this pressure, either by viscous flow or by selective Knudsen diffusion, and may even assume some intermediate mode of transport involving complex phenomena, such as surface flow along the walls of the pores. Despite the fact that, at first sight, membrane distillation does not basically differ from distillation between a warm liquid surface and a chilled wall, the former process exhibits a slight selectivity towards azeotropic feed mixtures .
5 -- PERVAPORATION
147
&
| Hg. 5.3.Membrane distillationprocess. 1. Porous membrane made of hydrophobic polymer;2. feed mixture; 3. vapor gap; 4. cooling fluid; 5. chilled wall; 6. condensed droplet. due to the pore transport mechanism mentioned above [7]. In this respect, membrane distillation is somewhat similar to pervaporation. The latter process is generally more selective whereas the former delivers larger amounts of permeate, the vaporization of which often causes a significant temperature drop across the thickness of the operating porous membrane.
Fractionation Through Gas Barriers In some membrane distillation devices [8], both sides of a porous membrane are in direct contact with liquid phases (Fig. 5.4). In this configuration, a vapor lock is immobilized in each pore of the working membrane, thus forming multiple gas barriers. Vaporization takes place at one liqm'd-vapor interface of the gas barrier and condensation at the opposite interface. Of course, this process, which is also called "direct contact membrane distillation," only works if the mass transport is driven by an external force. This force is usually induced by keeping the feed mixture at a higher temperature than the condensed permeate. This requirement, therefore, leads to the design of a system in which the permeation module is combined with a heat exchanger. The mass transport through the gas barriers is then apparently driven by a temperature gradient. Obviously, the transport process is strongly affected by the presence of noncondensable gases (air, for instance) which could be dissolved in the feed, since these gases progressively accumulate in the membrane pores. The vapor transport then changes from simple convection to diffusion through a noncondensable gas layer imanobilized in the pores and the distillation rate progressively decreases. To avoid this unfavorable effect, direct contact membrane distillation systems are generally equipped with an additional device designed to separate noncondensable gases from the feed prior to its introduction into the module.
148
s PERVAPORATION -
T
-
T-~T
Fig. 5.4. Fractionationby gas membranes (direct contact membrane distillation). 1. Porous membrane made of hydrophobic polymer; 2. liquid feed mixture;3. condensed distillate;4. vapor lock (gas membrane). The term "extraction through gas barriers" more specifically designates a similar process in which mass transport through a gas gap is driven by an activity gradient. For this purpose, the downstream liquid contacting the permeate side of the porous membrane is replaced by a stripping solution which absorbs the volatile component to be extracted from the flowing feed mixture. By using aqueous sodium hydroxide as a stripping solution and operating with gas barriers immobilized in the walls of porous hollow fibers of polypropylene (Celgard), it is possible to rapidly extract acetic acid from an aqueous or organic liquid mixture [9]. Other typical examples reported in the literature are mentioned below: - Extraction of bromine generated by oxidation (with chlorine) of bromides dissolved in seawater [10]. This operation is achieved by use of air barriers immobilized in the porous walls of hollow polypropylene fibers. The stripping solution is aqueous sodium hydroxide. - Extraction of iodine from an aqueous iodine-iodide solution. The stripping solution is aqueous NaOH [11]. Extraction of ammonia or organic amines contaminating an aqueous effluent by diffusion through gas barriers stripped by a solution of sulfuric acid [11]. -
Perstraction Perstraction also makes use of a countercurrent of stripping (purge) liquid, which sets up an activity gradient between the opposite surfaces of a dense
5 --
149
PERVAPORATION
I
A+C
)1
1
I,
=
[ 1 3__
I
A+B
~A
A+C
A---
,
i
c@L
_
Fig. 5.5. Fractionation by perstraction [12]. 1. Liquid feed (mixture of components A and B); 2. nonporous permselective membrane; 3. distillation column. C: High boiling-temperature leaching solvent. Example: A: Benzene; B: cyclohexane; C: decaline. 2: Permselective membrane made of phosphonated polymer (benzene is the faster permeating component).
permselective barrier (Fig. 5.5). In this case, the barrier is a thin nonporous polymer membrane. Mass transport through the membrane proceeds via a typical three-step solution-diffusion-desorption mechanism which is similar to that involved in pervaporation. Perstraction has been proposed by Cabasso [12] to separate benzene-~clohexane mixtures by preferential diffusion of the aromatic component through a membrane made from blends of cellulose acetate and synthetic phosphonated polymers, the stripping liquid being decaline.
5.2 C H A R A C T E R I Z A T I O N OF P E R V A P O R A T I O N M E M B R A N E S
5.2.1 Pervaporation Flux and Selectivity The behavior of a pervaporation membrane used to separate a binary liquid mixture (components A and B) of given composition is characterized by two experimental parameters, namely, the permeate flux J' (expressed in kg h -1 m -2 of membrane area) and the selectivity of the barrier, which may be quantified by two alternative dimen~sionless ratios [3 and 0~defined as follows: c'
--
= c
and
c'~Jc'B
c'(1 - C)
CA/CB
C(1 - C')
a - ~ -
where c and c' are the weight concentrations of the faster permeant (A) in the feed (c) and in the permeate (c'), respectively. To differentiate a from [3, the Terminology Commission of the European Society of Membrane Science and
150
s
-
-
PERVAI~RATION
Technology [13] has recommended the designations "separation factor" for a and "enrichment factor" for 13. The numerical values of these two parameters can be readily related to one another by means of the following relationships: 1"-C
(Z
1-~c
l + ( o c - 1) c
Parameter a is similar to the membrane selectivity which is widely used in gas permeation, and which is defined as the ratio of the permeabilities of the membrane to two different pure gases under comparable conditions. In the case of pervaporation, the physical meaning of a is not as clear because the two penetrants are no longer transported independently through the membrane due to strong coupling effects [14]. In spite of this difference, cz is undoubtedly more significant than ~ from the physico-chemical point of view since it increases to infinity as the membrane approaches perfect semipermeability (c' then being very close to 1). On the other hand, the use of parameter ~ makes it easier to formulate the mathematical equations [2] governing the performance (production capacity, operational yield and energy cost) which characterizes a pervaporation module. A comparison between the ratios a and [3 clearly shows that the former is larger than the latter, which systematically assumes a rather low value if the feed mixture is rich in the faster-permeating component. For instance, it is quite obvious that [~cannot exceed 1.25, even if a perfectly semipermeable membrane is used, when the feed contains 80% by weight of the preferentially transported species. From the above comments, we can see that no use can be made of a or J3 values if the feed composition is not specified.
5.2.2 Concentration Dependence of Pervaporation Flux and Selectivity It is worth noting that the flux and selectivity of a membrane used to separate binary mixtures of components A and B depend on the extent to which the permselective film swells under operational conditions and, consequently, on the composition of the facing feed. A complete evaluation of membrane performance, therefore, requires knowledge of the variations of the flux (J') and the selectivity (0t or J3) with respect to feed composition. To collect these data, experimental investigations are usually carried out with laboratory pervaporation cells, as described in the literature [15]. The test cell itself is made of stainless steel and the membrane is generally supported by a sintered metal disc. Efficient stirring is ensured by continuous flow of the thermostatted feed mixture in a loop and a downstream pumping system stabilizes the permeate pressure at about 1 mm Hg, in the vicinity of the
5 -- PERVAPORATION
151
membrane. The volume of the liquid feed is approximately 120 ml and the membrane area is about 20 cm 2. The permeate is alternately collected in two cold traps in which it condenses completely. The liquid thus recovered is weighed and titrated by gas chromatography to evaluate permeation rate and selectivity. This analysis only requires the sampling of a small amount of permeate and the composition of the investigated mixture is not significantly changed during the operation. Similar measurements are reiterated with a series of mixtures differing in their composition and the results thus obtained are used to calibrate the representative functions J' vs. c, r vs. c, ~Jvs. c, or c' vs. c. To accelerate the recognition of these functions, semiautomatic computerized devices, such as that designed by Clement [16], have sometimes been used (Fig. 5.6). Periodically, the permeate is diverted towards a side loop, maintained at low temperature by liquid air, in which it is completely trapped in the frozen state. It is subsequently melted, vaporized and driven into a gas chromatograph by a stream of helium. The resulting chromatogram is instantaneously analyzed
2
I
I
l
1 I
I I
I
I
1 L
....
Z___/ s_
4 -
1 ,
a_
b
Fig. 5.6. Semiautomatic computerized device designed to characterize pervaporation membranes [16]. (a): 1. Pervaporation cell; 2. sampling of pervaporate; 3. helium stream; 4. to chromatograph; 5. void reservoir; 6. cold trap; 7. vacuum pump. Broken line: pressure control and regulation. (b): 1. Pervaporation device (above); 2. helium inlet; 3. removal of pervaporate; 4. chromatograph; 5. computer; 6. control and regulation of valves; 7. to valves; 8. printer.
152
s PERVAPORATION -
-
by a computer and is compared with that recorded just before the test, with a sample directly extracted from the feed. This comparison permits evaluation of pervaporation rate and selectivity at the known composition of the feed. The experiment is generally carried out, starting from a relatively small volume of liquid mixture, so that the composition of the flowing feed progressively varies as pervaporation is allowed to continue. Reiteration of measurements at regular time intervals thus provides the set of experimental data needed to calibrate the four functions previously mentioned. It is also worth stressing that selectivity and flux measurements are not equally reliable. In fact, we may consider that experimental errors on selectivity values are rather small provided that measurements are carried out under low downstream pressure, i.e., if there is no significant pressure loss across the sintered metal support. On the other hand, flux values are more questionable because the transfer area is not exactly known, due to contacts between the membrane and its support. In fact, comparative measurements made by Blackadder [17] - - investigating the pervaporation transport of pure p-xylene at 30~ through a homogeneous sheet of polyethylene (75 ~m thick) mounted over five different s u p p o r t s - - yielded experimental flux values ranging from 26 to 61 g h -1 m -2. It is then clear that the structure of the support may significantly affect the observed transport rate and that experimental flux values measured with a given laboratory pervaporation cell must only be compared between them. Special care must be taken to determine absolute values of permeation rates. To collect flux and selectivity data which can reliably be used to evaluate the performance of a module working in a continuous way, membrane characterization must be carried out only when the steady-state transport regime is attained. In fact, at the beginning of laboratory tests, the latter regime is generally preceded by a transient period (30 min to several hours, depending on the composition of the feed and on the nature of the membrane), during which flux and selectivity apparently change with time. These variations are governed by the sorption kinetics of the feed mixture by the polymeric barrier material and often involve complex migration phenomena, which may significantly deviate from Fickian diffusion [18]. In practice, these transient behaviors are generally considered as side phenomena which no longer significantly intervene when the steady-state transport regime is established. At fixed temperature, the selectivity of a given membrane for binary mixtures of components A and B can be completely characterized by the figurative curves 0c vs. c, or ]3 vs. c. An alternative, more versatile representation, similar to the MacCabe-Thiele diagram used in distillation, is the plot c' vs. c complemented by the reference line illustrating the relevant liquid-vapor equilibrium. To complete this information, it is also useful to depict the influence of feed composition on pervaporation rate, i.e., to report the representative curve J' vs. c.
5- -
153
PERVAPORATION
C
I
___._._j.
I
3
J'(kg/, h.m-2)
,
:2
.'6
.8 ,6'
~176 ~176176176176176 ~ ~ ~176176176176176176 o
.
~
0
c
~
.'8
Fig. 5.7. Pervaporation of water-ethanol mixtures through a homogeneous 20 pro-thick polyvinylalcohol membrane. T = 60~ c, c': Water concentrations (by weight) in feed (c) and in permeate (c'). J': Permeate flux (kg h-1 m-2). Dotted line: Free liquid-vapor equilibrium (under atmospheric pressure). Figure 5.7 shows the two curves characterizing the selectivity and the permeability of a 20 I~m-thick homogeneous polyvinylalcohol membrane used, at 60~ to dehydrate by pervaporation, water-ethanol mixtures of varying composition. The square diagram (c' vs. c) clearly evidences the great selectivity of this membrane to water. Because of its high crystallinity, this material is not very permeable when it is not extensively swollen by the contacting feed, i.e., when it faces mixtures contairdng less than 20 wt% water. It is also noteworthy that it is virtually impermeable to pure alcohol in which it does not swell at all. The latter feature may be correlated with the high selectivity to water exhibited by the membrane -when pervaporation is carried out under very low permeate pressure since the downstream layer of the working membrane is then non-swollen. By means of similar graphs, Fig. 5.8 characterizes, at 40~ a 180 l~m-thick
:.
$C z
1.0
J' (kg/h. ...... m 2)
~CAz"
. ! ,
I! ! I
0.8 -
0.6
Z:
9
0.2 !
0.2
I
0.4
I
0.6 0.8 1
1
I
0.4
/.il I
0.2
0.4
I
~
c
0.6 0.8 1.0
Fig. 5.8. Pervaporation of water-pyridine mixtures through a homogeneous 180 pro-thick membrane made of sulfonic cation-exchange polymer [19]. CAz:Azeotropic composition = 41.3 wt% water. J': Permeate flux (kg h-1 m-2).
154
s --- PERVAPORATION
homogeneous cation-exchange membrane facing water-pyridine mixtures; this binary system exhibits azeotropic behavior when its composition approaches 41 wt% water [19]. Despite its thickness, this hydrophilic polyelectrolyte membrane delivers a satisfactory permeate flux. Pervaporation rate increases as temperature is raised. Generally, variations of total and individual fluxes are ruled by the Arrhenius equation: J' = J'0 exp (- E/RT)
J'i = (J'i)o exp (- E i / R T )
Considering all systems already studied, it appears that the activation energy E strongly depends on the nature of the membrane and on that of the investigated binary mixture. Data reported in the literature range from 5 to 22 kcal per mole. If both components are characterized by the same activation energy, pervaporation selectivity does not depend on temperature. In such a case, which occurs, for instance, when polyvinylalcohol membranes are used to separate water-ethanol mixtures, pervaporation is the most productive when it is carried out at the highest temperature compatible with the thermal and chemical stability of the barrier material. Periodicals devoted to membrane science contain a number of experimental results relative to the permeability and selectivity of membranes made of various polymers and used to separate different binary liquid mixtures. These values, which have already been compiled elsewhere [20], mainly concern the dehydration of organic solvents, the separation of hydrocarbons and the extraction of trace amounts of organics contaminating aqueous solutions. Some of them deal with the dehydration of organic acids or bases (amines). This information can be used, as a first approach, to select an appropriate polymer to manufacture a pervaporation membrane designed for a given separation purpose. Nevertheless, one must keep in mind that these values generally depend strongly on the operational conditions in which they have been measured.
5.2.3 Average Characteristics of Operating Pervaporation Membranes During continuous pervaporation (Fig. 5.1), the retentate becomes poorer and poorer in the rapidly permeating component (A) as it proceeds along the membrane. Progressively, its concentration c decreases from Coto ct as it flows from the inlet to the outlet of the module. In the steady-state regime, the membrane is not faced with a liquid of the same composition over its entire surface. As a consequence, the performance of the system, for instance its production capacity per m 2 of membrane area, is determined by average values of selectivity and permeate flux, defined over the [Co,ct] concentration range. Coming back to the diagrams c' vs. c and J' vs. c, we must therefore focus our attention on the domain comprised between Coand ct (Fig. 5.9). To compare the
5 - PERVAPORATION
155
!
,I
Ct
Co
C
Fig. 5.9. Average selectivityindex a within the [co,ct] concentrationrange, a = A1/A2. selectivity of different membranes and to appreciate their respective abilities to process a mixture of given starting composition (Co) and to reduce its concentration to a fixed ct imposed residual value, it has been suggested to refer to an average selectivity index (~ defined by the ratio: c~= A1/A2 A1 and A2 being the two areas delimited in Fig. 5.9. This ratio has obviously been selected because it equals zero when the membrane is devoid of any selectivity, and approaches infinity in the case of a perfectly semipermeable barrier.
5.2.4 Expected Performance of a Continuous-flow Pervaporator A simple experimental procedure can also be used to estimate the production capacity of a unit pervaporator equipped with a given membrane and designed to separate a given feed. A laboratory experiment is run after introduction of a known amount (weight = m0) of the starting mixture (Co)into a loop comprising a pervaporation cell equipped with the investigated membrane (surface area a) and a circulating pump. The retentate is automatically titrated by a non-destructive method and the experiment is stopped after a lapse of time At, when the concentration of the retentate attains the required value (ct). At the same time, the condensed permeate is weighed (Am). The production capacity Jt that may be expected from a unit module working in such conditions can then be calculated by means of the following equation:
1 mo-Am At
J t - -a
The recovery yield R in purified retentate is given by:
156
5- -
PERVAPORATION
1 - Co 5.2.5 Influence o f D o w n s t r e a m Pressure on M e m b r a n e Performance
Besides temperature, other external parameters may influence the characteristics of a pervaporation membrane facing a given binary liquid mixture. Downstream pressure being the most determining, it is recommended to measure flux and selectivity under very low permeate pressure (less than I mm Hg). In fact, any rise in this pressure results in an increase of the activities of both permeants dissolved in the downstream layer of the working membrane. Activity gradients across the thickness of the membrane consequently decline and permeation fluxes drop. Regarding selectivity, we have to consider that the resistance opposed by the downstream layer of the membrane becomes less selective as this layer swells more extensively. Moreover, at the membrane/permeate interface, desorption slows down as downstream pressure increases and it progressively becomes the rate-determining step of the process. Accordingly, transport selectivity then undergoes a drastic change, as illustrated in Fig. 5.10. X 1.0
l
I'
'
II'
0.9
i -'\
i I ! I I I I i I i I i i l
0.8
,'o
! e I
2'0
3'0
P (mb.~
Fig. 5.10.Pervaporation of water-tetrahydrofurane mixtures through a membrane made of regenerated cellulose (Cuprophane), T = 20~ Influence of permeate pressure P (mbars) on pervaporation selectivity [21]. X'. Water concentration in the permeate (mole fraction); X.water concentration in the feed (mole fraction); 1. X = 0.296; 4. X = 0.570. Boiling temperatures: water, 100~ THF, 65.4~
lb'/
5 --- P E R V A P O R A T I O N
m
,
P7 !
40
80
,,
I
120
_
F)
mm. Hg
Fig. 5.11. Pervaporation of n-hexane-n-heptanemixtures through a homogeneous membrane of polyethylene, T = 30~ Influenceof downstream permeate pressure on pervaporation selectivity. (x(preferential transport of n-hexane).Curve deduced from data reported by Greelaw [22].Hexane content in the processed feed = 74.2 wt%. Boiling temperatures: n-hexane, 68.6~ n-heptane, 98.4~ PT*= Saturating vapor pressure of n- heptane. In fact, this graph clearly shows the occurrence of a transition between two distinct transport regimes when downstream pressure exceeds a certain limit which approximates to the saturated vapor pressure of the permeate. Under low downstream pressure, desorption is rapid and diffusion through the membrane is the rate-determining step of the process. Beyond the transition pressure, desorption slows down and progressively governs the selectivity of pervaporation transport. In the latter regime, selectivity is mainly determined by the relative volatilities of the feed components. If the more rapidly permeating species is also the more volatile, selectivity increases as downstream pressure is raised (Fig. 5.11). In the opposite case, a steep decrease in selectivity is observed (Fig. 5.10). In fact, if one assumes that the permeate behaves as an ideal mixture and does not contain any significant amounts of noncondensable gases (for instance, air entering via leaks in the apparatus), it can be shown [21] that permeate composition X'A (mole fraction) depends on downstream pressure P, according to the following relationship:
PXP~ 1 PX X'A= ~ P~-PXP P~-PX where A and B are the fast and the slow permeants, respectively, X' denotes the concentrations (mole fractions) in the permeate; P is the downstream pressure;
158
s --
PERVAPORATION
and P* stands for saturated vapor pressures, at operational temperature. Derivation yields: dX'A
P~ P~
dr'
1 v
If the faster component (A) is the less volatile (P~ - P~ < 0), selectivity decreases as P increases, as it is observed when a hydrophilic cellulose membrane is used to dehydrate water-tetrahydrofurane mixtures (Fig. 5.10). In the opposite situation, selectivity increases as P is raised up (Fig. 5.11).
5.3 M E C H A N I S M OF P E R V A P O R A T I O N M A S S T R A N S P O R T
5.3.1 Mass Transport Through an Unevenly Swollen Polymer Film At the qualitative level at least, the pervaporation transport of a binary mixture through a non-porous membrane is now elucidated. When the steady-state regime is established,.each penetrant is transported at the same rate through all sections parallel to the surface of the membrane. The permeation flux of A may therefore be evaluated by considering its permeation rate through the non-swollen downstream layer of the membrane (Fig. 5.12). 9
D~ = intrinsic diffusivity of A (extrapolated at zero concentration of the penetrant)
|
lz.o CA
z
Fig. 5.12. Permeant concentration profile across membrane thickness, during steady-state pervaporation of a pure liquid. 1. Upstream uptake (swelling); 2. convex curvature due to the concentration-dependence of permeant diffusivity [23]; 3. downstream concentration gradient; 4. unswollen downstream layer of the membrane.
5 -- PERVAPORATION
159
D A = D~ exp(TAA CA + ~ A CB)
= plasticization parameters; e = membrane thickness. The latter equation accounts for the fact that, at a given place in the membrane, the diffusivity DA of component A is concentration-dependent. It generally increases as the polymeric material is more extensively swollen. This dependence is responsible for the curvature of the permeant concentration profile [23] across the thickness of the working membrane. If DA increases with penetrant concentration, this profile assumes a convex shape as depicted in Fig. 5.12. It follows that the partial flux of component A is determined by the product of two factors: 1. The first is the activity gradient of A in the virtually dry downstream layer of the working membrane. Of course, the higher the upstream starting point of the relevant concentration profile, the greater the gradient, but the downstream slope of the profile also depends on its curvature which is governed by the plasticization of the membrane polymer by the permeants and also by coupling between their flows. In most cases, however, upstream partitioning is the most determining phenomenon and preferential sorption of A in the upstream layer of the membrane favors the rapid transport of this component. It is, therefore, widely admitted [24] that, in a first approach, the selection of a polymer P - suitable for preparing permselective membranes designed to separate A-B mixtures --- can be made by referring to the relevant thermodynamical P-A-B phase diagrams. 2. Nevertheless, one should not forget that the intrinsic diffusivities of both A and B permeants are also determining parameters. In fact, in the virtually dry membrane material the different permeant molecules may migrate with very unequal velocities since their respective mobilities then depend on the relative strength of short-range interactions working between these molecules and specific polar or ionic groupings belonging to the permselective polymer. The downstream layer of the film may therefore oppose unequal resistance to the diffusion of A and B while it is hardly conceivable that the mobilities of these two components could widely differ in the swollen part of the membrane.
5.3.2 Sorption and Diffusion Selectivities From the above considerations, it follows that the selection of an appropriate membrane polymer P to extract component A from binary mixtures of A and B relies on the fulfilment of the following conditions: 1. Strong preferential sorption of A by polymer P when the latter is contacted with mixtures of A and B. This can be ascertained by referring to the relevant P-A-B phase diagram and by checking that tie-lines intercept the P-A side of this triangular diagram. In fact, this figure and its variation with temperature
160
s PERVAPORATION -
-
provide the most complete information about the partitioning equilibria that take place at the feed/membrane interface. Depending on the solubility of P in A and B, and on the mutual miscibility of A and B liquids, different typical ternary diagrams can be distinguished and have been classified by Bode [25]. An alternative way of characterizing the upstream swelling equilibrium is that used by Heintz [26] who establishes "solubility diagrams" by plotting the weight fractions of A and B (c"a and c"8) in the swollen polymer as a function of the weight fraction Ca of A in the contacting liquid mixture. It is clear that, for a given P-A-B system, the solubility diagram can readily be translated into the corresponding phase diagram since both of them represent the same set of swelling equilibria. Until now, only few complete P-A-B phase diagrams are available in the literature and this does not facilitate the choice of appropriate membrane polymers for pervaporation. To rapidly palliate this lack of data, it is often referred to "preferential solvation" evidenced by contacting each investigated polymer P with A-B mixtures of varying composition. For this purpose, a given amount (weight = m0) of pieces cut out of a film of each tested polymer P, is immersed into a fixed volume V of a mixture of known concentration (co) in component A. Preferential sorption of A obviously provokes a decrease of its concentration (c) in the contacting supernatant liquid mixture. Assuming that this mixture equilibrates a binary adduct represented by the stoichiometry P-sa(c)A and that P is insoluble in the facing solution, the so-called "preferential solvation Sa (c)" can be deduced from V, m0, Coand c. The figurative curve sa vs. c then represents the overall preferential solvation of P contacted with mixtures of A and B and the area below this curve roughly quantifies the preferential affinity of polymer P for component A, in the presence of component B. Preferential solvation can also be evidenced and evaluated by means of other experimental techniques, such as analysis of light scattered by P-A-B solutions [27]. It is worth noting that the selectivity of upstream partitioning is not governed by the chemical nature of the membrane only; it also depends on the thermodynamical properties of the facing liquid mixture. For instance, it is quite remarkable that the polyvinylpyrrolidone-based pervaporation membrane which readily separates positive azeotropic mixtures (Table 5.1), is not selective when it is faced with negative azeotropes (Table 5.2). In fact, in mixtures exhibiting negative azeotropism, heteromolecular attracting forces A-B are prevailing over self-associating interactions A-A and B-B between like molecules. This feature enhancing mutual drag effects, is unfavorable to the separation of the two components. The same reason also explains why organic contaminants, which are poorly soluble in water, such as hydrocarbons or chlorinated solvents, can be easily extracted from aqueous effluents by pervaporation through silicone-based organophilic membranes [28-30], whereas
5 -- PERVAPORATION
161
these membranes are not very efficient to separate mixtures of ethanol and water, which are completely miscible [28,30]. To support this view, mention may also be made of the observations reported by B6ddeker (31) concerning the selectivity of polydimethyl-siloxane membranes used to extract, from water, the four different isomeric butanols (Table 5.3). It clearly appears that pervaporTABLE 5.2 Fractionation of negative azeotropic mixtures (characterized by maximum boiling temperature) by pervaporation through a membrane obtained by grafting polyvinylpyrrolidone onto a thin polytetrafluoroethylene film [1] A-B Azeotropes Tb (A = Fast component (~
Azeotrope characteristics
Selectivity
Tb(~
c (%)
a
Permeate flux (kg/h m 2)
A: Chloroform B: Acetone
61.2 56.2
64.7
80.0 20.00
1.8
1.10
0.85
A: Chloroform B: M.E.K.
61.2 79.6
79.9
17.0 83.0
1.0
1.0
1.50
A: Butanol-1 B: Pyridine
117.7 115.3
118.7
71.0 29.0
1.4
1.09
1.25
A: Water B: Formic acid
100.0 100.7
107.1
22.5 77.5
1.0
1.0
2.74
A: Acetic acid B: Dioxane
118.1 101.3
119.5
77.0 23.0
2.7
1.17
0.27
A: Acetic acid B: D.M.F
118.1 153.0
159.0
26.0 74.0
1.2
1.14
0.04
A: Formic acid B: Pyridine
100.7 115.3
150.0
53.5 36.5
2.8
1.31
0.22
A: Acetic acid B: Pyridine
118.1 115.3
139.7
35.0 65.0
1.0
1.0
0.09
A: Propionic acid B: Pyridine
140.9 115.3
199.0
74.0 26.0
1.7
1.12
0.13
A = Faster permeant; T = 25~ Parameters a, [B,c and c' and Tb are the same as in Table 5.1. M.E.K. = Methylethylketone; D.M.F. = N,N-dimethylformamide.
162
s
-
-
PERVAI~RATION
TABLE 5.3 Extraction of alcohols from water by pervaporation through a homogeneous polydimethylsiloxane film (50 ~m thick), T = 50~ (after BOddeker et al. [31]). Pervaporation performance
Investigated alcohol Alcohol
Tb (~
Cmaxwt%
n-Butanol iso-Butanol
117.7 107.9 99.5 82.5
7.7 8.5 12.5 100
sec-Butanol
tert-Butanol Ethanol
78.5
100
J' g / h m 2
c' wt%
~
a
44 52 50 52
37 29 22 14
37 29 22 14
58.1 40.4 27.9 16.1
190
3
3
3.06
Feed alcohol content: c = 1%, by weight, c" ---percent butanol in pemleate, C m ~ = solubility of the alcohol in water, at 20~ r = Permeate flux; ~ = c ' / c ; ot = s e l e c t i v i t y = [c'/(1 - c O ] / [ c / ( 1 - c)]. Tb = Boiling temperature.
ation transport through this membrane is as more selective to the alcohol as the organic component is less soluble in water. As may be expected, salting out by introduction of sodium chloride in the feed increases the separation factor [32,33]. 2. The preferential transport of component A can also result from the low mobility of component B in the non-swollen downstream layer of the working membrane, i.e., from a low intrinsic diffusivity D~. The latter value can be determined by extrapolating experimental DB(c)plots to zero concentration or by studying the diffusion of non-saturated vapor of component B through a thin homogeneous film of polymer P. One may also refer to the observation that the membrane appears as virtually impermeable when it is used to process pure B, by pervaporation under low downstream pressure. For instance, the J' vs. c curve represented in Fig. 5.7 shows that polyvinylalcohol is not permeable to dry ethanol, a feature which causes an additional selectivity effect in the dry downstream layer of the membrane. The latter contribution does not exist in the case of the polyvinylpyrrolidone-polyacrylonitrile blend membrane [34] characterized by the permeability curve shown in Fig. 5.13. This difference accounts for the lower selectivity of the polyvinylpyrrolidone-based membrane as compared with that made of polyvinylalcohol. A number of experimental observations may be mentioned as evidence of the respective contributions of upstream partitioning ----or s o r p t i o n - - and downstream diffusion to the overall selectivity of a given membrane. When polyvinylalcohol (PVA) is used as a permselective material to dehydrate water-ethanol mixtures, pervaporation selectivity is significantly greater
5 -- PERVAIK)RATION J'
163
(Kg,/h.m,2}
C#
3.0
.
O.Im
,6' 0.6
2.0
y
f 0 . 4, 4 .
1.o 0 . 22 "
_
o
o:~
of:,
.. . . . . . . . .
0:2
c
o.'4
o:e
~
os
c
Fig. 5.13. Pervaporation of water-ethanol mixtures through a homogeneous 30 Ilm-thick membrane made of 58/42 blend of polyacrylonitrile and polyvinylpyrrolidone [34]. Pervaporation temperature: T = 20~ t h a n sorption selectivity evaluated b y analyzing PVA s a m p l e s swollen after i m m e r s i o n in w a t e r - e t h a n o l mixtures of the s a m e c o m p o s i t i o n as the processed feeds (Fig. 5.14). Similar behavior is observed (Fig. 5.15) w i t h other v e r y selective hydrophilic m e m b r a n e s , such as the p o t a s s i u m a n d cesium salts of ion-exc h a n g e m e m b r a n e s obtained b y grafting acrylic acid onto thin films of low d e n s i t y polyethylene [35-37].
C I
C"
1
~
I
........ I
I
1.0
~""
0.8
0.6
s"
s
-
0.4
0.2
I
o
I
I
,
, ,I,
~
C
1
.....
o
.0"2
C
o~4
0:6
0;8
~.o
Left: Fig. 5.14. Pervaporation of water-ethanol mixtures through a homogeneous polyvinylalcohol membrane (T = 65~ Comparison between sorption selectivity and pervaporation selectivity. Dashed line: sorption; solid line: pervaporation.
Right: Fig. 5.15. Pervaporation of water-ethanol mixtures through a homogeneous membrane obtained by grafting acrylic acid onto a thin, low-density polyethylene fiIm and neutralization by immersion in an aqueous solution of potassium hydroxide [35--37](T = 35~ Comparison between sorption selectivity and pervaporation selectivity. Dashed line: sorption; solid line: pervaporation.
164
5 C I
C I __
J/
,/
Ii'//1
li / /
i
I
I
PERVAPORATION
I
I
'
] I
-
I
/
/ /;',.-"/...-----
!
0
I
-
I.,
(~
1
..-"
/,"
I
I
,
i
I
/C;
1
Left: Fig. 5.16. Pervaporation of water-ethanol mixtmes through a membrane made of a copolymer butadiene-styrenesulfonic acid, neutralized by immersion into an aqueous solution of sodium hydroxide (Membrane Selemion CMVH from Asahi Glass Co.). Comparison between sorption selectivity and pervaporation selectivity [38], T = 60"C. Dashed line: sorption; solid line: pervaporation. Right: Fig. 5.17. Pervaporation of water-acetic acid mixtures through the CMVH membrane (acid form of that shown in Fig. 5.16). Comparison between sorption and pervaporation selectivities [39]. T = 60~ Water is the preferentially transported compontnat. Dashed line: sorption; solid line: pervaporation.
In the opposite situation, i.e., when sorption and diffusion do not favor the transport of the same feed component [38], competition between the two phenomena results in a rather poor pervaporation selectivity (Fig. 5.16). In a few cases, it has even been observed that the fast permeant is less extensively sorbed by the membrane material. In this respect, we may mention the results reported by B6ddeker [39] concerning the Selemion CMVH membrane from Asahi Glass C o . - - shaped from a copolymer involving butadiene and styrenesulfonic acid u n i t s - - used to dehydrate aqueous solutions of acetic acid (Fig. 5.17). Similar behavior was also observed by Yamada [40] during experiments carried out with membranes made of a copolymer of N-vinylpyrrolidone and isobutylmethacrylate. The latter membranes are selective to water although ethanol is preferentially sorbed by the copolymer (Fig. 5.18). According to Uragami [41], the same is observed when poly(vinylchloride) membranes are faced with aqueous solutions of ethanol. Water is the more rapidly permeating component whereas ethanol is preferentially incorporated into the polymer. The specific influence of diffusion through the downstream layer of a working membrane was also evidenced by using a homogeneous film chemically modified on one side. Such a membrane was obtained by Yamada [42] by reacting, with ethylenediamine, a sheet of polyethylene previously activated by photochlorination. The resulting asymmetrical membrane was used to separate mixtures of aniline and benzene. The experiment consisted in comparing the transport selecti-
5 -- PERVAI~RATION
165
I
12' V
!
I
"!
'
II' '
t
i
0.2S_~ i ~ '
C 1
Fig. 5.18. Pervaporation of water-ethanol mixtures through a homogeneous membrane made of a copolymer of N-vinylpyrrolidone (20%)and isobutylmethacrylate (80%).T = 25"C. Pervaporation selectivity curve (c' vs. c, c and c' are the water contents, by weight, in feed and permeate, respectively). A point belonging to the sorption selectivity curve has been deduced from the experimental data reported in Ref. [40]. vities observed after changing, face-to-face, the orientation of the membrane in the pervaporation cell. The selectivity of the membrane was found to differ noticeably from that of the original polyethylene film only if its modified surface was on the permeate side. In such conditions, pervaporation transport is less favorable to benzene, as may be expected considering that the intrinsic difflasivity of aniline is increased when the membrane material is reacted with the diamine.
5.3.3 Modeling of Pervaporation Mass Transport Although we have now gained a qualitative understanding of the mechanism of pervaporation transport in the case of a binary feed mixture, the process is nevertheless too complex and involves too many parameters to be elucidated at a quantitative level. A number of experimental data would be needed to achieve a complete analysis and most of them are still lacking. Relying on simplifying assumptions, quantitative models have however been proposed, which satisfactorily account for the pervaporation transport of a pure liquid. In the case of a binary feed mixture, modeling is much more complex because of possible coupling between the transports of the two components.
5.3.3.1 Vacuum Pervaporation Transport of Pure Liquids If the permeant is unique, the concentration dependence of its diffusivity in the membrane material may be represented by a relatively simple function of c involving only two parameters. An exponential function is generally used:
D(c) = D* exp (yc)
166
5
-
-
I~RVAYORATION
where D" is the intrinsic diffusivity, i.e., the diffusivity of the penetrant in the non-swollen membrane material (c approaching zero) and y represents the so-called plasticization parameter. Then, assuming that the membrane is homogeneous and isotropic, integration of Fick's first equation over the whole thickness (e) of the film and for boundary conditions (c = Cw for z = 0, c = 0 for z = e) established when the steady-state pervaporation regime is attained, leads to the expression of the permeate flux J' and to the steady permeant concentration profile c(x) across the thickness of the working membrane [14,43]. dc
J' =
D
D(c) = D* exp (u c)
$
[exp (y Cw) - 11
ye 1
c(x) = --/ In { x[1 - exp (y cw)] + exp (? cw)} where x is the relative distance to the upstream interface (x = z/e) and Cwis the concentration of the permeant in the swollen upstream layer of the membrane. The values of D ~and y are then needed to calculate J'. Several experimental methods such as sorption and desorption kinetics [23,44,45], time-lag techniques [46,47], inverse gas chromatography [48] and analysis of the membrane response to regular forced concentration waves [49] are used to measure directly these two parameters. Relying on the data thus obtained, it is possible to estimate the pervaporation flux that may be expected, at fixed temperature, from the processing of a given pure liquid through a given homogeneous membrane of known thickness. These predictions are generally in rather good agreement with the results of experimental measurements.
5.3.3.2 Vacuum Pervaporation of Binary Liquid Mixtures It is more difficult to analyze, from a quantitative point of view, the pervaporation transport of binary liquid mixtures. This complexity arises from the fact that, contrary to the situation occurring in gas permeation, the pervaporation transport of a binary mixture of A and B is not additive with respect to those of pure components A and B. Considering the partitioning at the feed/membrane interface, we must keep in mind that the swelling of a polymer P immersed into binary mixtures of A and B does not vary linearly with respect to the composition of these mixtures [53]. Sometimes, it is observed that the polymer, insoluble in each pure liquid A and B taken separately, readily dissolves in mixtures of A and B. This occurs if the solubility parameter tip of this polymer is between those of A (SA) and B (SB).
5 - PERVAPORATION
167
PVA
EtOH
Fig. 5.19. Ternary phase diagram: polyvinylalcohol-water-ethanol. Influence of the molar weight M of the polymeric component.
It is also noteworthy that a ternary system P-A-B involving a polymeric component P is not precisely defined since the swelling extent of P depends on several parameters, such as its molecular weight, its crystallinity and, casually, its degree of crosslinking. For instance, the phase diagram reported in Fig. 5.19, which characterizes the ternary system polyvinylalcohol-water-ethanol, shows that partition between the swollen polymeric phase and the supernatant liquid mixture becomes less selective as the average molecular weight M of the polyalcohol decreases from M2 to M1. This is due to the fact that the dissymmetry between the two phases, i.e. the sorption selectivity, progressively vanishes as the polymeric phase is more and more extensively swelled. The permeability of the membrane increasing with its swelling extent, we may expect that the selectivity and the permeability of the membrane should vary contrariwise when the parameters mentioned above are changed. Apart from these side problems, the major difficulty in accounting for the pervaporation of a binary mixture lies in the fact that the transport of the two permeants are mutually coupled. In the literature on pervaporation, the term "coupling" is used to designate either the thermodynamical constraint which correlates the flows of the different mobile species, or the mutual drag between the different migrant molecules and which originates from short-range molecular interactions between them. In some cases, the latter effect makes it possible for a given penetrant to move against its own concentration gradient in certain regions of the system. Thermodynamical coupling has been thoroughly analyzed by Smolders [51,52]. Considering that the individual permeation flux Ji of each permeant is proportional to its local chemical potential gradient, this flux may be expressed as:
168
5- - PERVAPORATION - l'i = D i c i--~z
where Di diffusivity of penetrant i within the elementary slice of thickness dz; ci = concentration of i in the same elementary volume; ~ti = chemical potential of i; R = gas constant; T = absolute temperature (~ Then, assuming that the membrane works in virtually isothermal conditions, we obtain =
Di ci dl.ti -
J "i = RT
dz
O~ti
d I.ti = vi dP + ~ai dai
where vi is the molar volume of component i, ai its activity and P the operational pressure. As long as pervaporation is carded out under moderate upstream pressure, the pressure differential between the two opposite surfaces of the membrane is small and the first term of the expansion may be considered negligible as compared with the second. The expression of the flux may, therefore, be reduced to: Di ci 31.ti RT 3z
-J'i-
Then, referring to the well-known relationship: I.ti = I.t'~+ RT In (ai)
we deduce: -
=
ci
The main acquisition of the thermodynamics of macromolecular ternary systems resulting from the Flory-Huggins theory [53] is the mathematical function accounting for the variation of ln(ai) with respect to the volume fractions of the different components. In the ternary system composed of a polymer 3 and a mixture of solvents I and 2, activities vary according to the following functions: ln(al)
=
ln(%)
Vl Vl - -- ~03 -'-+ (1 -- ~01) -- ~02 -132 /33 + (X12 ~02 + X13 ~03) ((P2 + (P3)
Vl - Z23 _.-7 ~02 ~03 v2
where ~)denotes volume fraction, v: molar volume; Z: Flory interaction parameter; 1, 2: low molecular weight liquids; 3: polymer.
5 -- PERVAPORATION
169
Combining this equation with the preceding one, we obtain the final expression of the individual pervaporation flux J', as follows: -
=
d [
+
(1
-
-
vl
Z~l
Vl ]
+ (X12 q)2 + X3 q)3) (q)2 + q)3) -- ~23 V-~ q)2 q)3
where the diffusivity D1(~1,r of penetrant I is considered to be compositiondependent. To calculate the individual flux YI for the steady-state regime, it is necessary to integrate this nonlinear differential equation over the whole thickness of the membrane, considering the boundary conditions at the two opposite surfaces of the barrier. Such a calculation can only be achieved through a numerical method, which requires precise knowledge of the function D1(%, %), accounting for the composition-dependence of the corresponding D1 diffusion coefficient.
5.3.3.3 The S tefan-Maxwell Approach The above analysis is based on several assumptions, which have been critically discussed by Bitter [54]. In fact, an objection may be that the solubility of permeants in polymer membranes is inadequately described by the Flory-Huggins equation since tt~s equation is based on a theory that ignores both the crystallinity of the sorbing material and the limited flexibility of macromolecular chains in a polymer network. Moreover, it overlooks the effect of the penetrants on the coordination number of the swollen polymer. To describe diffusive mass transport in the thickness of the membrane, Bitter suggests relying on Stefan-Maxwell concepts. Let us recall that the Stefan-Maxwell analysis was originally introduced to account for diffusion processes observed in perfect gas mixtures. It was subsequently extended to multicomponent liquid mixtures by Lightfoot [55,55a], who developed the so-called "generalized Stefan-Maxwell theory", and by Mason [56], who examined even more complex systems involving liquids and polymeric species. Recently, attempts have been made to refer to this theory to interpret mass transport through polymer membrane [57]. In contrast to the phenomenological Fickian approach, the Stefan-Maxwell theory deliberately explores the molecular level without differentiating the solvent from the other components. In the multicomponent mixture, each molecule i moves under the influence of a driving force which is a gradient of thermodynamical potential ~ti.As a result, the surrounding molecules exert on it a frictional forcefwhich opposes the driving force and becomes
170
s PERVAPORATION -
-
equal to it after molecule i has reached its steady-state velocity wi. Then: f = - grad ~i Assuming that the frictional force exerted by a molecule j is proportional to the difference in velocities wi-wj, we may write:
RT RT/Dq being the expression of the friction coefficient where Dij is the StefanMaxwell mutual diffusivity of i in a mixture of i and j. Considering all the collisions suffered by i during its movement through the system and averaging the quantities introduced above, we obtain the extended Stefan-Maxwell equations. In the case of a unidirectional mass transport through a membrane and for an isothermal system, these equations reduce to the following forms.
n RTcl[J'i j=l
Do L
J__~t=
cj j
dBi -
dz
dp -vi
dz
where c is the total molarity of pene~ant and polymer species in the membrane and Dij are the generalized Stefan-Maxwell diffusivities. The other symbols have the usual designations: ci = molarity of i; I~ - chemical potential of i; vi = partial volume of i; J% = molar flux of i. Since vi is generally small for common permeants and since pervaporation is usually carried out under moderate upstream pressure, the pressure term is negligible. If the investigated system only comprises two permeants (1 and 2) and the membrane polymer (m), the preceding equation can be developed as follows: c dB~
RT dz In the derivation of the Stefan-Maxwell equations, it is tacitly assumed that diffusivities Dij are independent of the local composition at each point of the multicomponent system. In mixtures of liquids and polymeric species, however, these diffusivities probably vary with concentration, although much less than Fickian diffusion coefficients and this smaller change is an advantage of the Stefan-Maxwell approach. Another superiority of this type of analysis is that it involves diffusivity parameters Dq, which, in principle, can be evaluated by separate experiments performed with binary mixtures. Nevertheless, if it is applied to a multicomponent system comprising a polymeric species (a membrane, for instance), those
5 -- PERVAPORATION
171
diffusion parameters can no longer be considered as strictly invariant and equal to separate binary coefficients, and the Stefan-Maxwell theory then leads to approximate results only. It has also been pointed out that Stefan-MaxweU equations do not require particularizing one component as the solvent and therefore look very symmetric. On the other hand, that feature often makes them rather difficult to handle and to combine with mass balances. In fact, Stefan-MaxweU equations can be exactly integrated in special cases only. A typical example is the pervaporation transport of a single permeant (water, for instance) through a membrane of thickness e. In this binary system, the chemical potential of water is given by: $
gw = ~w + R T In
(aw)
where aw is the activity of water. Hence:
Cm
d In (aw) dz
(Cm + r
l 'w Dwm Cw
Assuming that the activity coefficient of water Yw is constant throughout the working membrane, aw = YwCw Cw= (pw/Vw where Cw is the molarity of water, q)w its volume fraction and Vw its molar volume. Consequently we may write d ln(aw) dz
dq)w (Pw dz
The Stefan-Maxwell equation then reduces to: (1 - q)w) Vw
Jw
Vw + q)w (Vm - Vw) Dwm
dq)w Vw dz
Integration between the two opposite surfaces of the working membrane then leads to the formulation of the water permeation rate: D,cvill
/ ' w -- - - - - e Vw
1-
vml,wo]
((Pwo-(Pwe)- Vw
i -~Owe
where %o and (Pweare the volume fractions of water in the upstream and the downstream layers of the working membrane, respectively.
172
5 PERVAPORATION -
-
Moreover, combination of the Stefan-Maxwell equation with that defining the conventional Fickian diffusivity Dw, i.e., Jw = - Dw dcw/dz, makes it possible to establish a relationship between Dw and the mutual diffusivity Dwm: Vw + ~0w(Vm - Vw) D w --~ D w m
(1 - ~0w) Vw
The latter relationship shows that Dw approaches Dwm as q)w goes to zero and we may therefore consider that the mutual diffusivity Dwm coincides with the intrinsic diffusivity of water (Dw) in the membrane polymer. In practice, the expression of the flux is often used to estimate the mutual diffusivity Dwm of water in a given polymer [58]. For instance, when pure water is processed at 40~ by pervaporation through a 15 ~m-thick homogeneous film of cellulose acetate (Eastman Kodak), the observed permeation rate J'w equals 1.102 k g / h m 2, i.e., 17 10-7 mole cm -2 s-1. This value has been inserted into the theoretical expression of Jw after being complemented with the following data: Vm/ Vw = 100 q~o = 0.155 (from measurement of membrane swelling in pure water) q)weis considered as negligible (vacuum pervaporation). Calculation then leads to: Dwm = Dw = 3.42 10-8 cm 2 s-1 (at 40~ This result is in rather good agreement with the value directly deduced from the sorption kinetics of water vapor on the same cellulose acetate film [59]. Dw = 2.50 10-s cm 2 s-~ (at 25~ with an activation energy equal to 7.9 kcal mole -1. We may therefore consider that this diffusivity value is reliable enough to be used in calculations aiming at the quantitative interpretation of the pervaporation transport of a binary feed mixture. 5.3.3.4. Pervaporation Mass Transport Through Semicrystalline Polymer films In the preceding analysis, it was assumed that the membrane was perfectly homogeneous and isotropic. This condition is fulfilled by nonporous membranes made of amorphous polymers (cellulose acetate, polydimethylsiloxane, etc.) whereas it is not when they are made of semicrystalline polymers. For instance, in the case of polyvinylalcohol, comparison of X-ray diffraction patterns recorded with dry and wet fibres, respectively, shows that crystalline domains are virtually impermeable to water molecules. The same is also true for ethanol. It follows that during pervaporation of water--ethanol mixtures through polyvinylalcohol membranes, the permeant molecules migrate through tortuous paths maintained under strain by adjacent crystallites. Since
5 - - PERVAPORATION
173
a macromolecule goes through several crystallites, the latter may be compared to covalent junctions in a crosslinked polymer [60]. Referring then to the classical relationship P = DS between permeability (P), diffusivity (D) and the solubility coefficient (S), we can conceive that the crystaUinity of the membrane material influences both S and D. With respect to penetrant solubility, crystallinity provokes two different effects. Firstly, it reduces the volume of permeable membrane material: S = (1 - X) Sinter where Sinter is the solubility coefficient in the intercrystaUine amorphous phase and X the crystallinity of the membrane polymer. Secondly, it perturbs the swelling of intercrystalline amorphous domains. In fact, adjacent crystaUites impose restriction on mobility of chain segments comprised in the intermediate amorphous phase. The resulting rain perturbs the thermodynamics of the polymer-penetrant system in this .egion which is not completely relaxed. To account for this strain effect, the classical Flory-Huggins equation, which governs the thermodynamics of unstrained swollen polymeric phases and expresses the activity as of the penetrant, has to be complemented with the Flory-Rehner term [53]. Flory-Hu ggins equation: In as = ~s + ~P + ~
where ~ denotes molar volumes and X stands for the Flory interaction parameter. Flory-Rehner equation: In as = In ~s + ~P + Z~P2 +
(tZ)o2 (n/A) Vs ~p2 Vo
where ((z)0is the ratio between the mean distance separating the junctions in the unswollen network and the mean end-to-end distance for the corresponding segment if this segment was unrestricted; n = number of effective segments in the sample; A = Avogadro number; vs = molar volume of the penetrant; v0 = volume of the original polymer sample. Comparison between the two latter equations shows that, for the same ~)s value, the activity as of the sorbed penetrant is greater in a strained amorphous domain than in a relaxed one. The higher the number of crystalline junctions, the greater is the effect. As a consequence, the penetrant solubility in the intercrystalline amorphous domains is expected to decrease as crystallinity increases. The latter effect may be summarized by the following expression (60): Sam b>l Starer -- b where b is the so-called "blocking factor", which depends on polymer morphology and on the size and shape of diffusing molecules. This parameter can be deduced from activity measurements by using the Flory-Rehner equation.
174
s PERVAPORATION -
-
The solubility coefficient S may therefore be expressed as: (1 - X)
S=
Sam
b
where Sam is the solubility coefficient characterizing the completely relaxed amorphous phase. From the above comments, it follows that the transport properties of a membrane made of a semicrystalline polymer should probably depend on its crystallinity X. As a first approach, we may consider that this influence mainly results from the tortuosity x of amorphous diffusion paths through which the permeant proceeds. D-
Danl
where Dam is the permeant diffusivity in the amorphous polymer. The tortuosity 9 characterizing a two-phase medium comprising an impenetrable phase dispersed in a permeable continuum only depends on the volume fraction X occupied by the non-permeable domains. In this respect, reference is often made to the relationship: 1 - = (I - X)"
I:
n ranging from 1.25 to 1.90, depending on the nature of the sample. We are therefore led to conclude that pervaporation fluxes through a membrane made of a semicrystalline polymer should significantly decrease as the crystallinity of this polymer increases. This prediction is fully consistent with experimental observations made during pervaporation of water-ethanol mixtures through homogeneous polyvinylalcohol (PVA) membranes differing by their crystallinity. The results reported in Fig. 5.20 clearly illustrate the lower permeability of the most crystalline samples [58]. A similar decline was observed by Perrin [59] in the value of the intrinsic diffusivity D~, of water in PVA, measured by sorption or desorption kinetics (see table below): Crystallinity of the PVA sample (%) Intrinsic diffusivity of water at 40~ 1011Dw (cm2 8-1) Plasticization parameter ~
28 4.2
37 3.3
44 2.3
56 1.5
7.9
6.9
5.8
4.7
Since pervaporation mass transport only proceeds through the amorphous channels of membranes made of semicrystalline polymers, it would seem that
5 PERVAPORATION -
175
-
J' ( k g l h . m 2)
/
0.8
123
0.6
0.4
4
=
.i
0.2
o
2o
- '
"
C 6o
,;o
Fig. 5.20. Pervaporation of water-ethanol mixtures through homogeneous, 25 Izm-thick polyvinylalcohol membranes differing by their crystallinity X. Percent crystallinity X = 29 (1), 33 (2), 37 (3), 40 (4), deduced from the density of the membrane. T - 45~ c = Feed water content (wt%). Pervaporation flux J' vs. c. selectivity s h o u l d not significantly d e p e n d o n the crystaUinity of the m e m branes. As s h o w n in Fig. 5.21, w h e r e ethanol p e r m e a t i o n rates t h r o u g h different P V A m e m b r a n e s u s e d to separate w a t e r - e t h a n o l m i x t u r e s are plotted vs. feed w a t e r content, this is not experimentally corroborated. This d i s c r e p a n c y m a y be e x p l a i n e d b y the following side p h e n o m e n a : J'EtOH (g I h. m 2 ) 20
I
n
=
i
IC)
/ 20
, 30
, 40
0
0
~
50
Fig. 5.21. Pervaporation of water-ethanol mixtures through homogeneous, 25 tan-thick polyvinylalcohol films differing by their crystallinity X. Percent crystallinity X = 27 (1), 33 (2), 37 (3), 40 (4), 56 (5). Influence of crystallinity on transport selectivity appreciated by referring to ethanol permeation flux J'~.toH T = 45~ JtEtOHVS.C.
5
176
-
-
PERVAPORATION
MEMBRANE
.--~.
B
. . . . . .
PERMEATE SIDE ( LOW PRESSURE)
,,, t
UNSWOLLEN DOWNSTREAM LAYER
Fig. 5.22. Diffusion selectivity caused by intercrystaUine sieving effect in the non-swollen downstream layer of the working membrane.
- Preferential sorption by the strained amorphous intercrystalline phase may be influenced by the crystallinity of the membrane polymer if the blocking factor b is different for the two penetrants. We may also conceive that diffusion selectivity in the non-swollen downstream layer of the working membrane could depend on crystallinity. In fact, this selectivity is determined by the relative strength of specific short-range interactions between the permeant molecules and the membrane material and this balance can be influenced by the length and the mobility of intercrystalline chain segments. The latter phenomenon may be visualized as the "downstream intercrystalline sieving effect" illustrated in Fig. 5.22. It could provide an additional contribution making the PVA-based membranes very efficient for dehydration of ethanol.
-
5.3.3.5 Coupling Effects in Pervaporation
In view of the difficulties entailed in a complete thermodynamical analysis of pervaporation transport, in the case of binary feed mixtures, we understand why the coupling effect has often been reduced to a simple drag effect arising from attractive molecular interactions between the two migrants. Accordingly, Kedem [62] expresses each individual permeation rate as follows: dc1 I'I = - P1 --d-~ + k c l l'2
The first term, proportional to the concentration gradient of component 1, corresponds to diffusional transport while the second accounts for the addi-
177
5 -- PERVAPORATION
tional flux of component 1, which is dragged by the flow of component 2. Parameter k, usually called "drag parameter", quantifies the relative magnitude of the two processes. This parameter has probably not the same value at any place in the working membrane. In fact, it is hardly conceivable that the mobilities of the two penetrants could greatly differ in the swollen part of the barrier. When it diffuses through this region, the mixed penetrant probably behaves as a unique migrant exhibiting intermediate properties. If such conditions were fulfilled throughout, the drag term would largely prevail and the permeate should have the same composition as the sorbate. Pervaporation and sorption selectivities should be equal. In reality, the influence of the drag effect probably vanishes as contacts between penetrant molecules and the functional groups belonging to the membrane polymer increase in number. Specific interactions between permeant molecules and the membrane polymer progressively prevail over dragging forces between components A and B. It is therefore conceivable that the respective mobilities of the two migrants could be distinctly affected by these interactions with the membrane polymer. In other words, diffusion then contributes to the selectivity of pervaporation transport. It is probable that this situation occurs in the part of the working membrane which is not extensively swollen by the permeants, i.e., in the vicinity of its downstream surface. These concepts are consistent with the fact that a significant part of the selectivity exhibited by polyvinylalcohol membranes used to dehydrate waterethanol mixtures is due to selective diffusion in the non-swollen downstream layer of the working membrane (Fig. 5.14). Accordingly, diffusivity measurements carried out by Perrin [59] show that the intrinsic difSasivities of water (Dw) and ethanol (D~to~t) in polyvinylalcohol largely differ from each other. Comparing, at 40~ the sorption kinetics of water and ethanol vapors in homogeneous polyvinylalcohol membranes (56% crystalline), this investigator deduces: Water:
Dw = 1.49 10-11 cm 2 s-1
Yw= 4.66
Ethanol: D~K), = 1.04 10-13 cm 2 s-1 ~tOH = 14.4 being the parameter included in the expression D = D* exp(y c) where the penetrant concentration c is expressed in g g-1. It appears that, in the nearly dry polymer, the diffusivity of water is more than one hundred times as high as that of ethanol. One may therefore conceive that the magnitude of the drag effect could progressively decrease as the mixed permeant diffuses from the upstream to the downstream interface. This is consistent with the assumption that the additional selectivity provided by diffusion originates from the unequal resistance opposed by the virtually dry downstream layer of the membrane to the
178
5- -
PERVAPORATION
transport of the two migrants. If so, the steady-state concentration profile of the slow permeant may be expected to accommodate a particular shape. In the swollen part of the membrane, both migrants should behave similarly, their concentration profiles showing the usual convex shape starting from an original upstream concentration directly related with the swelling uptake of the relevant component. As permeants approach the downstream surface, their respective mobilities progressively deviate more and more from each other so that the rejected component accumulates in this region. In certain extreme cases, this phenomenon, somewhat similar to concentration polarization, could induce, over a short distance, a reversal in the curvature of the concentration profile of the slow component, which is then dragged against its own concentration gradient, over a very small space interval, by the flow of the fast permeant. So far, the literature provides only one experimental observation of this effect. It concerns the pervaporation transport of water-acetic acid mixtures through aromatic polyamide membranes and is reported by Matsuura [63]. This experiment, however, is not fully convincing since it makes use of the classical film-stack technique to recognize the steady-state concentration profile of the permeants across the working membrane. According to this procedure, a stack of several identical films is used as pervaporation barrier. When the steady-state transport regime is attained, the cell is disconnected from the vacuum line and the stack of membranes is dismantled. It is then blotted free of surface liquid and is rapidly separated into the individual layers, which are then separately weighed and titrated by gas chromatography technique. It seems clear that, during this operation, concentration profiles are likely to become fiat. In fact, their exact recognition would require an improved experimental technique allowing them to be visualized in the thickness of the working membrane.
5.3.3.6 Origin of Downstream Diffusion Selectivity The additional diffusion selectivity that makes the polyvinylalcohol membranes so efficient for the dehydration of organic liquids was previously taken as a consequence of the so-called "downstream intercrystaUine sieving effect". It is clear that this explanation does not hold for other highly performing hydrophilic membranes devoid of any crystaUinity, such as ion-exchange membranes. In fact, homogeneous membranes obtained from macromolecular polyacids prove to be very selective to water after neutralization by immersion into aqueous solutions of various mineral hydroxides [64--66]. A typical example is given by the membranes prepared by grafting acrylic acid onto a thin film of low density polyethylene, used after neutralization by the different alkaline bases [67]. Pervaporation of water-ethanol mixtures through such membranes show that their selectivity depends on the alkaline counterion.
5
-
-
PERVAt~RATION
179
H + < Li+ < Na + < K+,Rb+ (Order of increasing selectivity for water) )
With respect to permeability, it appears that permeation rate increases according to the same sequence. Surprisingly, the exchange of Li+ for K § ions enhances both permeation rate and selectivity. In their salt form, all of these membranes are hydrophilic and, after immersion into water-ethanol mixtures, absorb water preferentially. However, they differ by the magnitude of the gap between sorption and pervaporation selectivities. Comparison between lithium and potassium salts shows that the gap which separates the two selectivity curves is greater in the case of the potassium salt, which also ensures the most selective pervaporation transport of water. This suggests that this greater pervaporation selectivity might be due to some particular behavior of water molecules faced with potassium carboxylate ion pairs, enhancing their mobility and, therefore, increasing the Dw/D~toH ratio. IR spectrometry has been successfully used to obtain information about interactions between water, ethanol and this type of membrane material. Reflection spectra have been recorded in the interval between 1300 and 1700 crn-1 relevant to vibration modes of carboxylate groupings [68]. The membranes were successively examined in their acid and salt forms. The most interesting observations were made by comparing the spectra of the resulting membranes after impregnation with water-ethanol mixtures containing 0-20 wt% water. It appeared that, for a given salt, a splitting of the band ascribed to the antisymmetrical vibration of the carboxylate groupings is observed when the proportion of water in the mixture exceeds a defirute threshold value called "critical water concentration" (CWC). The CWC depends on the nature of the counterion and it has been shown that the splitting of the band occurs when the vibrations of the carboxylate groupings are perturbed by the insertion of water molecules and the consequential loosening of the ion-pairs. In other terms, the CWC decreases as the relevant ion-pairs are more and more readily penetrated by water molecules. It is therefore of interest to compare the CWC observed with the different alkaline forms of the investigated ion exchange membrane. Experimental results reported below show a rather good correlation between the CWC measured with each film and its selectivity to water when it is faced with water-ethanol mixtures. Cation M +
Li +
CWC (wt%) 17.5 Increasing selectivityto w a t e r . .
Na +
9 .
.
.
.
.
.
Rb +
K +
7
5 ;
.
180
5 PERVAPORATION -
-
Actually, the membrane appears as more selective as the relevant CWC is lower. One can therefore deduce that insertion of water molecules into ion-pairs and their extraction out of their clusters present in the feed mixture, enhances their mobility in the virtually dry membrane material. As a consequence, the intrinsic diffusivity of water in the polyelectrolyte is higher as the relevant ion pairs are more readily penetrated by water molecules. Combined with preferential sorption at the upstream surface of the membrane, this additional effect, which takes place in the non-swollen downstream layer of the working membrane, makes the potassium form more selective. 5.4 E N G I N E E R I N G OF P E R V A P O R A T I O N
To be used at the industrial scale, pervaporation must be designed as a continuous-flow process. The low magnitude of permeate fluxes through nonporous permselective membranes does not favor the use of cascade devices. In this respect, pervaporation cannot advantageously compete with conventional distillation when the latter is selective, since distillation is an iterative process whereas pervaporation is generally confined to one transfer through the permselective membrane used. However, it is worth comparing the respective performances of the two techniques when vaporization selectivity is nil or very low, i.e., in the case of azeotropes or mixtures of close boiling-temperature liquids. Actually, in such cases, distillation is generally replaced by more sophisticated and energy-consuming techniques such as vacuum or extractive distillation and the high selectivity of the membrane process can make it more advantageous. In itself, pervaporation is not a complete separation technique. It is generally designed as a continuous-flow operation, which makes it possible to alter the composition of a flowing liquid mixture A-B by extracting, through the permselective membrane, a permeate enriched in one of the feed components. For instance (Fig. 5.1), pervaporation can be used to further process an azeotropic mixture emerging from a predistillation column by circulating it through a pervaporator equipped with a membrane preferentially permeable to the minor component (A). Depending on the permeability and on the selectivity of the membrane, the contaminant is more or less rapidly extracted. The residence time required to obtain a refined retentate, in which the residual contaminant content is reduced to a fixed ct level, is determined not only by the intrinsic characteristics of the membrane used, but also by the required purification ratio x = Co/Ct, Co and ct being the A-contents in the feed (Co) and in the retentate (ct), respectively. Quite obviously, the more permeable and selective the membrane, the greater is the production capacity of the device. In a continuous-flow module, the membrane does not work under the same conditions throughout since it is faced with a liquid mixture that becomes
5 - - PERVAPORATION
181
poorer and poorer in contaminant as it approaches the outlet of the device. It is therefore clear that the performance of the system can be predicted only if one knows how the composition of the facing mixture influences the permeability and the selectivity of the membrane, within the [Co,ct] concentration range. It is also noteworthy that pervaporation is far from being an isothermal process, even if the temperature of the incoming feed is carefully controlled. In fact, vaporization of the permeate at the downstream surface of the membrane causes local cooling, which induces a temperature gradient across the barrier. As a consequence, the temperature of the flowing retentate also decreases as it proceeds along the module and, in the steady-state transport regime, a definite temperature profile is established between the two opposite ends of the module.
5.4.1 Equations Governing Continuous-flow Pervaporation From the above considerations, it clearly appears that pervaporation is a complex multigradient process and that modeling is necessary to evaluate the performance of a module equipped with a membrane of known characteristics [2]. The basic equations governing the process are the three differential equations which formulate mass and heat balances for the elementary volume of flowing liquid comprised, at a given time, within z and z + dz cross-sections (Fig. 5.23).
Overall mass balance dJ = J'(c, T) p dz
where J is the retentate flow rate through the z cross-section, J'(c, T) accounting for the fact that permeation flux J' depends on the composition (c) and on the temperature (T) of the facing liquid mixture, p standing for the perimeter of the module cross-section.
l Qo ~
P
Q
co,To
r
,
d Q , d c
I,
I
z
z+dz
Sm > Er > Gd > La > Y. Zhang et al. [216] carried out a similar separation of lanthanides from (NH4)2SO4aqueous solutions. Teramoto et al. [217] separated and concentrated the lanthanides La, Nd, Sm, Eu, Gd, Dy and Yb using as a carrier 2-ethylhexylphosphoric acid mono-2ethylhexyl ester (PC~ Ninety-eight percent of the metal ions cited were removed from the initial solution in five minutes. After stirring of the emulsion for 20 minutes, an enrichment factor of about 50,000 was achieved. Pertraction offered additional advantages in the case of Y b 3+ removal. In contrast to the conventional-extraction, where insoluble in the organic phase complexes of Y b 3+ a r e formed, here the organic membrane is continuously regenerated, keeping the concentration of the metal complex in the membrane at low levels. Lanthanides and actinides can be successfully separated by means of the SLM technique [218-220,427,428]. Danesi et al. [221] separated actinides and lanthanides from acidic radioactive waste water using modules of fiat membranes and hollow fibers. The extraction of actinides is more complete. Some of the experiments were performed in three-compartment cells supplied with two supported liquid membranes of different composition. The first membrane (between F1 and R) was a solution of octyl (phenyl) -N, N-diisobutyl-carbamoylmethylphosphine oxide + TBP in decaline. The second membrane (between R and F2), was a solution of Primene~ in decaline, also continuously removed the nitric acid, transferred simultaneously with the metal ions into the
7 - LIQUIDMEMBRANES (LIQUID PERTRACTION)
313
acceptor solution R. In this way, a constant concentration of the nitric acid was maintained, which contributed to the process stabilization and the membrane lifetime. Danesi and Cianeti [41] achieved, by means of a SLM of "acidic type" (D2EHPA in dodecane), a complete removal of Am 3§ from the initial aqueous solution F1. Novikov and Myasoedov [223] established the optimum conditions for the separation of the lanthanide/actinide couples: A m / C m , Eu/Tb, and E u / A m , achieving separation factors of 5.0, 10.8 and > 100, respectively. Instead of D2EHPA, Nakamura and Akiba [224] used diisodecyl-phosphoric acid (DIDPA) as a carrier of Eu 3+ due to its better hydrophobic and extraction properties. Brown et al. [18] transferred Eu 3§ in the system water-CHC13-water by means of the 18C6 crown ether. A preliminary reduction of Eu(NO3)3 to Eu(NO3)2 was necessary in this case due to the instability of the Eu 3§ complex. It was for the same reason that the experiments were performed in an argon atmosphere. Gasparini et al. [40] demonstrated a direct SLM extraction of Pu(W) and Zr(IV) from alkaline media without preliminary acidification of the aqueous solution. Ninety-five percent of the plutonium and zirconium ions are transferred into the acceptor liquid --- an aqueous solution of oxalic acid --- by tributylacetohydroxamic acid (TBAH), dissolved in diethylbenzene and 2-octanol for approx. 250 minutes. Rajec et al. [225] and Mikulai et al. [226] preconcentrated pertechnetates with a liquid membrane containing Aliquat~336.
7.5.2.4 Copper Copper is the most often-encountered subject of pertraction studies. This priority can be explained not only with the practical significance of this metal, but also with the availability of various highly selective commercial extractants suitable for the treatment of the acidic or alkaline copper solutions [429431,465,470]. Table 7.2 lists many of the publications devoted to the problems of copper pertraction. It can be seen that the majority of the authors prefer chelating extractants, e.g., of the LIX~, ACORGA ~, KELEX~ or other series, as carriers, of copper ions. Organophosphorus acids or aliphatic acids are rarely applied to this purpose. As inert diluents of the selective extractants various hydrocarbons with a low solubility in the treated copper solutions are used, e.g., kerosene [89,128,227, 228], normal paraffins as n-heptane [229,230], n-dodecane [191], isoparaffins [231], cycloparaffins as cyclohexane [232,233], aromatic hydrocarbons as xylene [36], toluene [39,106] and benzene [234]. Synthetic mono- or polycomponent aqueous solutions of copper salts and industrial solutions or waste waters are used as donor solutions. As a rule, the
314
7 - - LIQUIDMEMBRANES (LIQUIDPERTRACTION)
TABLE 7.2 Pertraction of copper Carrier
Method
References
LIX~64N
ELM SLM ELM SLM LFP SLM LFP ELM ELM SLM ELM ELM SLM LFP ELM SLM ELM SLM ELM SLM ELM ELM SLM ELM SLM
[43,63,66,107,128,231,309,396-401,407, 432] [9,24,35,43,44,227,245,402,408 ] [43,229,241,247,248,403-407,433] [36,43-45] [466,467] [236] [467] [304] [404] [2461 [78,412] [66,85,399] [26,227] [243,467] [58,66] [58,227] [304,404] [227] [61,124,237] [44] [109,234,238,404] [89,128,232,235,242,409,410] [4111 [13,232,309] [9,191,402,434]
LIX~65N
L~ LIX~ L~ ACORGA~PS050 ACORGA~P5100
ACORGA~P5300 KELEX~ SME~329 benzoilacetone fatty acids D2EHPA
latter are of acidic type, but in some cases alkaline solutions, e.g., ammoniacal copper solutions [235,236] are treated. Aqueous solutions of sulfuric acid with concentration in the range 50-270 g 1-1 are used as acceptor phases. Sulfuric acid is preferred to other strong mineral acids due to its practical insolubility in the m e m b r a n e liquid and furthermore, to the availability of a well-established process of copper electrowinning from concentrated sulfate solutions. There are also data on the usage of acceptor solutions of nitric acid [36,232,237], hydrochloric acid [33,124,232,238,239], or perchloric acid [240]. In all these cases the d o n o r solutions contained copper salts with the corresponding anionic part, e.g., nitrate or chloride, Cu 2+ being transferred between two aqueous phases F a n d R of various p H values but of the same anionic composition. Nakashio et
7 - LIQUIDMEMBRANES(LIQUIDPERTRACrION)
31~>
al. [241] used the ELM method and stressed on the role of the emulsifier in copper pertraction. They produced a series of surfactant derivatives of glutamic acid dialkyl esters, which exhibited better properties than sorbitan oleates or polyamines used so far. It is of interest to compare the copper fluxes transported under the same experimental conditions by various carriers. For instance, Marr et al. [242] compared the data of copper pertraction with stearic acid and LIXO64N. They found that the emulsion formed by LIX| is more stable and thus provides a higher copper accumulation in the encapsulated acceptor solution. Teramoto and Tanimoto [44] impregnated hollow polymer fibers with organic solutions of SME~529, LIX| or LIX| Largman and Sifniades [227] tested the transfer intensity with the carriers ACORGA~P5100, KELEX~ and LIX~64N and ordered the fluxes of copper which are transferred across the liquid membranes as follows: JACORGA |
> JKELEX@100 >
JLIX|
Schugerl et al. [66] compared the data about copper preconcentration from its dilute aqueous solutions (initial Cu 2+ concentration from I to 100 mg 1-1)by the ELM technique using the carriers ACORGA~P5100, ACORGA~P5300 or LIX| Regardless of the close distribution coefficients in all three cases, the results strongly differed, which was attributed to the various kinetics of chelate complex formation and destruction. For example, the intense fluxes with the carriers of the ACORGA series are related to the higher stripping rate, i.e., to the higher rate of chelate destruction. The authors did not, however, account for the more pronounced adsorption properties or the higher solubilities both of chelate complex and extractant in the aqueous phase as possible causes of this phenomenon. Lee et al. [43] compared the results of copper pertraction applying the ELM and SLM methods. The conclusion was drawn that supported membranes are more advantageous since they yield more reproducible results, the transferred fluxes being of comparable magnitude. Boyadzhiev et al. [58,243] included one more pertraction method in their comparative study: liquid film pertraction. The obtained results gave evidence for the applicability of all three methods to copper pertraction with ACORGA~P5300. Some results on copper pertraction from acidic (pH = 2) waste waters, containing I g 1-1 copper obtained by means of a Rotating Film Pertractor are shown in Fig. 7.16. The carrier in this case was LIX~60. In the general case, the driving force of the pertraction process is generated by the pH gradient between the aqueous phases on both sides of the organic membrane. It is also possible for copper transport to be generated by redox reactions [39]. The treated solution contains a reducer, the acceptor phase an
316
7 - LIQUID MEMBRANES(LIQUID PERTRACTION)
I
i"
i'
'-!
|
x~ 0.1
o
0.01 V~= 1.4 dm= %=/~.0 dn'P
\ ~,
Q,,- 0.02~ 0.001 0
c/2 6a
66.... 68
Fig. 7.16. Removal of copper from waste water by RFP technique. Initial copper content in the feed: 1 g 1-1.The membrane liquid is a 5% (vol.) solution of LIX~60 in dodecane; the acceptor is 3 N sulfuric acid. oxidizer. The transfer is based on the different extractability of the various valent states of copper ions [Cu(II) and Cu(I)]. Ohki et al. [10] proposed the idea of using photoinduced reactions also for liquid-membrane separations. An explicit assessment of the effect of various parameters on the efficiency of copper pertraction is hard to give. There are data about the effect of initial copper concentration in the treated solutions [33,245], their pH value [109,246], the carrier concentration [35,107,238], the emulsifier concentration [233,241,247, 248], the membrane viscosity [107] and the composition of the acceptor liquor [35,124]. The temperature effect [72,250] as well as hydrodynamic parameters like mixing velocity or flow rate of the phases are also studied [124,238,249]. The experimental data are subjected to mathematical modelling in order to draw conclusions about the process mechanism and about the rate-controlling step using various carriers. According to Yagodin et al. [9], when D2EHPA is used as a carrier, the process is diffusion-controlled, since the reactions of copper complex formation and destruction are faster than mass transfer, the latter being actually rather intense when applying the ELM method. The substitution of D2EHPA for the oxime LIX~64N leads to a sharp decrease in the flux of transferred Cu 2§ ions since the control passes to chemical kinetics. In this case the flux strongly depends on the presence of catalysts in the system, this being considered as evidence for the decisive role of chemical reactions taking place. It is generally accepted that copper interaction with the chelating carrier, summarized as:
7 - LIQUIDMEMBRANES(LIQUIDPERTRACTION) [Cu2+]w +
2[HR]s ~.
" [CUR2] S +
317
2[H+]w
(7.18)
proceeds in two steps: [Cu 2§ + [HR] ~ " [CuR +] + [H +]
(7.19)
[CuR +] + [HR] ,"
(7.20)
"
[CUR2] + [H §
The second reaction step is considered as the slower and hence as the rate-controlling one. The experiments of O'Hara et al. [236], performed with alkaline aqueous solutions and LIX~54 as a carrier, showed that diffusion in the liquid membrane is the rate-controlling step, provided both the mixing intensity and initial copper concentration in the F solution are high enough. Using LD~54 as a carrier, Yoshizuka et al. [246] found that the rate-controlling step at p H values above 5 is the diffusion of copper in the donor phase or the diffusion of the complex in the membrane. At low pH values, however, the interfacial chemical reaction is the rate-controlling step. According to Chiarizia et al. [33] the process is controlled by the diffusion in the membrane or in the aqueous layers adhering to it. Komasawa et al. [36] considered the chemical reactions taking place at the F/S interface as the rate-controlling step. Bartet al. [251] also confirmed that chemical kinetics controls the overall pertraction rate, assuming low copper concentration in the donor solution. Lorbach et al. [252] examined three cases: the resistance is located in the F phase (low concentrations of copper ions and protons); the resistance is located at the F/S interface (low concentration of copper ions, high proton concentration); and the resistance is located in the membrane S (high concentration of copper ions, low proton concentration). Using the SLM method with the carrier ACORGA~5100, Flett and Pearson [42] assumed a diffusional control both in the bulk of the aqueous phase and in the aqueous layers adhering to the membrane. Danesi et al. [25] concluded that copper pertraction with a carrier LD~64N is simultaneously controlled by the chemical reactions and complex diffusion. Applying the LFP method, Boyadzhiev and Lazarova [253] pointed to the important role of donor and membrane liquid hydrodynamics on the mass transfer. According to the studies of Ivakhno et al. [254], the rate of copper pertraction with chelating extractants is controlled by the rates of the forward and reverse chemical reaction. These authors declined the general opinion that chemical reactions take place at the F/S and S/R interfaces. By analyzing the corresponding kinetic equations, they established that the reaction occurring in the aqueous layers close to the interfaces significantly contributes to the overall process resistance. This hypothesis is supported by other authors as -well [255,256].
318
7 - UQtnD MEMBRAt~S 02QUIDPERTRACnObO
7.5.2.5 Other Valuable or Toxic Metals
Waste water purification from chromates is a severe environmental problem [26,42,257,258,435-438]. Frankenfeld and Li [259] examined the relationship between the various mechanisms of extraction and stripping chromate ions from the waste waters of galvanic production. The extraction may be performed by means of two carrier types: tertiary amines or quaternary ammonium salts. In the first case, the extraction process may be expressed as amine neutralization: [R3N]s + [2H + + Cr202-]F "
; [(R3NI-I)2Cr2OT] s
(7.21)
whereas in the second one, the process is accompanied by a salt formation: [(R3NH)2X] S + 2 H + + Cr202-]F -
; [(R3NI-I)2Cr207] $
+ [2H + + X2-]F
(7.22)
where X = SO4 or C12. The destruction mechanism of the chromate--amine complex depends on the composition of the regenerating solution R. With an alkaline R solution, the stripping scheme is: [(R3NH)2Cr207]s + 4(Na + OH-]R "
" [R3N]s + [ 2 ( 2 N a + + CrO42-]R + [3H20]R
(7.23)
whereas with an acidic R solution the scheme is: [ ( R 3 N H ) 2 C r 2 0 7 ] S + [H2SO4] R ."
; [(R3NH)2SO4] S
+ [2H + + Cr202-]R
(7.24)
Both mechanisms are successfully applied in a number of liquid membrane studies. Kitagawa et al. [260] developed a pilot plant involving one or two pertraction steps: the unit treats 451 of waste waters containing 100 p p m of C r 6+ with I 1 of emulsion for 5 hours. As a result, chromium concentration is brought down below 1 p p m with up to 65 g 1-1 of Cr 6+ being accumulated in the alkaline acceptor solution (10% NaOH).The two-step version uses a 20% solution of N a O H as an acceptor and chromium concentration in this liquor finally reaches up to 182 g 1-~. The liquid membrane transfer of chromium is most often performed with TOA or TAA, e.g., Alamine~ [196,261-267]. Mori et al. [268] pointed out that treating sulfuric solutions of Cr(VI) with a membrane of tridodecyl- or trioctylamine dissolved in kerosene yields a stable, gel-like complex in the organic
7--LIQUID MEMBRANES (LIQUID PERTRACTION)
319
phase, which may be avoided by adding 2-ethylhexyl alcohol to the membrane liquid S. Fuller and Li [269] carded out a simultaneous separation of Cr(VI), Cr(II) and Zn(II) from a cooling blow-down stream by using a mixture of two carriers: TBP and Aliquat*336. Using also quaternary ammonium salts, Strzelbicki et al. [270] separated chromium and rhenium present in the donor solution as NH4ReO4 and K2CrO4. The emulsion containing rhenium is finally destructed by the addition of n-butanol. A potential application field of pertraction is the removal of the highly toxic mercury from waste waters or physiological liquors and the registration of traces of mercury in various solutions [429,439,440]. For example, mercury is present as a soluble Hgl~- complex, which can be extracted by means of highmolecular amines or quaternary ammonium salts [259] according to the scheme: [2(R4NX)]s + [HgC12-]F ~ " [(R4N)2HgCI4]s + [2X-]F
(7.25)
Stripping is performed with an aqueous solution of a strong acid, inorganic or organic base like ethylenediamine. Kitagawa et al. [260] successfully applied the ELM technique for mercury extraction: the concentration of Hg 2+was reduced from 1100 ppm to below 0.2 ppm in approximately 10 minutes. This corresponds to more than 99.98% removal efficiency. Baba et al. [271] tested various carriers and emulsifiers for a preconcentration of Hg 2* from nitrate and chloride solutions. The combination of tributylphosphine sulfide as a carrier and L-glutamic acid dioleyl ester as a surfactant was found to be the most advantageous one. Boyadzhiev and Bezenshek [272] established the optimum conditions for treating nitrate aqueous solutions containing from 0.07 to 0.35 g 1-1 of mercury ions at a pH value of about 3. The membrane phase was a 10% solution of a technical mixture of long-chain fatty acids (linolic and oleic) in normal paraffins C~FC~3 containing 1% emulsifier: SPAN~0. The stripping was carried out with 2 M sulfuric acid. Fi~tre 7.17 presents the effect of the agitation intensity on the efficiency of the Hg ~L+Jtransfer. Weis and Grigoriev [273] gave preference to another extractant: dibutylbenzoylthiourea (DBBT), which reacts with Hg 2* according to: 2[R2NCSNHCOR1]s + [Hg 2+] - . . 2[H+]F
+[Hg(R2NCSNCOR 1)2]s
(7.26)
where R 1 = C6H5 and R2 = (n-C4H9)2 Stripping into the hydrochloride solution R is accompanied by an irreversible chemical reaction with urea present in this phase:
320
7 - LIQUIDMEMBRANES(LIQUIDPERTRACTION)
250
n=lO0
200
150 100 50
0
10
20
30
/,0
50 t [rain]
Fig. 7.17. Mercury removal from slightly acidic aqueous solutions. Stirring intensity during the second (contacting) process stage influences both the rate of transfer and emulsion break-up.
[Hg2+]R + 2[HC1]R + 4[(NH2)2CS]R"
" [Hg(NH2)2CS)4C12 +2[H+]R
(7.27)
Bivalent mercury may be selectively separated from other cations such as K +, Cd 2+, T1+, Sr 2+, Ag + and Pb 2+ by means of macrocyclic ethers functioning as carriers [274]. Bacon and Jung [15] used the ability of some macrocyclic ligands to extract mercury ions from model solutions without transferring other cations of biological importance. It is known that chemodialysis does not function as a treatment for mercury intoxications. An improved method using liquid membranes could significantly contribute to the rapid removal of this toxic metal from the human organism. Pertraction processes may be applied for removing the highly toxic cadmium from waste waters, e.g., of galvanic production [441-445]. The cyanide complex [Cd(CN)4] 2- is extracted with Aliquat~336. The destruction of the extracted species and the liberation of the cadmium ion is a difficult task [260] that can be solved by means of the disodium salt of EDTA, provided pH of the acceptor solution is maintained in the range between 4 and 6. Danesi et al. [275] used the SLM method to elucidate the transfer mechanism of the cadmium complex with the carrier TLAHC1. Takahashi et al. [276] also published a study on this subject, using D2EHPA as a carrier. According to Zhang and Huang [277] the combination of two extractants (D2EHPA and alkylphosphine oxime) allows the simultaneous separation of Cd 2+ and CN- from galvanic bath waste waters. The concentrate obtained may
7 - LIQUIDMEMBRANES(LIQUIDPERTRACTION)
321
be directly used in the process. Izatt et al. [278] tested 14 various macrocyclic compounds for the membrane extraction of Pb(NO3)2. Satisfactory results (extraction efficiency of 91%) are obtained with didecyl-1,10-diazo-18-crown-6. Biel et al. [279] removed 90% of the lead in the presence of lithium and potassium from a nitrate solution by using a similar compound, dicyclohexano-18-crown-6. In a number of liquid membrane studies the experimental data about the selective separation and concentration of zinc are analyzed [280-283,432,446450]. Usually, Zn 2+is extracted with D2EHPA from sulfuric, perchloric or other acidic media by the cation exchange mechanism as follows: [Zn2+]w 4- 2[(HR)2]s ~ [Zn2+]w + 1.5[(HR)2] s .-
; [ZIxR2(HR)2]s -b 2[H+]w ; [ZIIR2(HR)] S +
2[H+]w
(7.28) (7.29)
According to Tanagaki et al. [284] ZnC12 may be transferred from a hydrochloric solution by means of TOA. A complex between TOA and HC1 is initially formed, to which, subsequently, ZnC12 is added. The first large-scale equipment for zinc recovery from the waste waters of rayon production was built in Austria as a result of long-term thorough studies [85]. It has the following technical parameters: flow rate of waste waters, 75 m 3 h-l; flow rate of membrane phase, 5 m 3 h -1, f l o w rate of sulfuric acid solution, 0.5 m 3 h -1. The removal of 400-600 ppm of Z n 2+ from the waste water containing calcium, 5-8 g 1-1 of sulfuric acid, 25 g 1-1 of sodium sulfate and various modifiers and solids was achieved by means of di-2-ethyl-hexyl dithiophosphoric acid (D2EHDTPA) - - an efficient extractant for metals, which finds a rare use in liquid-liquid extraction due to the hampered stripping of the loaded organic phase. Irrespective of the slow stripping kinetics, the ELM method yields a satisfactory pertracfion rate due to the extremely large S/R interface. D2EHDTPA extracts Zn 2§ at a pH about 0.5, whereas D2EHPA cannot be used at pH values below 2. Sulfuric acid of minimum 2 M concentration is required for stripping. The average process efficiency is 99.5%; zinc concentration in the final acceptor liquor is about 60 g 1-1. Draxler and Marr [285] used a combined ELM procedure for the simultaneous separation and concentration of zinc, cadmium and lead from the waste waters of zinc production with D2EHDTPA as a carrier. The three metal cations cannot be simultaneously stripped by the sulfuric acceptor solution so that part of the membrane phase is separately regenerated with a hydrochloric solution. The purification of the waste waters in zinc production after copper cementation is performed by Schugerl et al. [66], which applied a continuous ELM process in a Kuhni-type column using LIX~31 as a carrier. This extractant is preferred for separating metal ions from ammonia or other alkaline solutions. Harada et al. [286] separated zinc and iron from their mixtures by making use
322
7-- UQ~OMEMBRANES(LIQtnOPER'rRAC'rION)
of the different reaction mechanisms of the two extractants, TOA and D2EHPA, present in the membrane liquid. The two aqueous solutions F and R are of various HCI concentration: 1 M HC1 and 0.05 M HC1, respectively. TOA transfers both zinc and iron ions from the F to the R solution. D2EHPA transfers the Fe 3§ ions back to the F solution. The final result of this "two-way" transport is the efficient one-step separation of the two metal ions. Verhaege et al. [287] successfully used D2EHPA for the separation of zinc from nickel. The concentration of zinc ions in the donor solution was 600 ppm and that of nickel ions is 58 g 1-1. Zinc is separated by the SLM technique using a membrane phase containing 30 vol.% of D2EHPA. The treated solution is maintained in continuous motion inside the hollow fibers, the acceptor solution circulated outside. Finally the whole amount of zinc and only 1% of the nickel present in the donor solution are transferred to the acceptor solution. Poa et al. [288] also developed a SLM process for the separation of zinc from nickel using octylamine as a carrier. Loiacono et al. [239] developed an interesting approach for the separation of zinc from copper by the three-compartment SLM technique. One of the two membranes is impregnated with a D2EHPA solution, the other with a L I ~ 6 4 N solution. The treated solution is placed in the middle compartment, i.e., between the two membranes. The zinc ions are transferred through the membrane containing D2EHPA, the copper ions through the LIX-containing membrane. Couples of metal ions can be separated by an appropriate combination of carriers, the donor and acceptor solution. For example, Melzner et al. [16] selectively separated zinc from solutions containing copper and cobalt. Danesi et al [289] separated Zn(II) and Cd(II) from chloride solutions using TLAHCI as a carrier. The separation is based on the strong effect of CI-concentration on the liquid membrane transfer of the two metal ions. h a t t e t al. [290] separated cadmium from mercury by means of crown ethers. Various liquid membrane methods are used for the separation of cobalt and nickel [291-300,451-454]. D2EHPA was the carrier most often used [92,301303]. The comparative studies of Strzelbicki and Charewicz [304] on ELM systems showed that D2EHPA is an efficient carrier for Co 2§ and Ni 2§ from nitrate and chloride media. Sulfates usually inhibit this separation process, in which case other extractants like KELEX~ or LIX~70 should be employed. A good separation of cobalt and nickel is achieved by means of another commercial organophosphorus compound, CYANEX~ [41,305]. ReichleyYinger and Danesi [306] found out that the presence of glycine in the treated solution favors the separation of Co 2+from Ni 2§ Glycine is a hydrophilic ligand that forms more stable complexes with Ni 2+, thus retaining its ions in the donor solution F. There is only limited information about the treatment of solutions containing Fe 2§ ions [307-309,455]. This could be related to the fact that iron is a wide-
7 - LIQUIDMEMBRANES(LIQUIDPERTRACTION)
323
spread and nontoxic metal. It is usually separated from solutions by means of supported liquid membranes impregnated with TOA [310,311]. The electrodialysis of Fea+ through a supported liquid membrane impregnated with TBP was also studied [312]. This kind of process, however, lies beyond the scope of this chapter. Guerriero and Meregali [313] developed a SLM process for the recovery of indium from sulfuric leaching solutions containing many other ions besides indium (Cu, As, Zn, Fe, Sb, Bi). D2EHPA is used as a carrier. A separation factor of the couple I n 3 + / C u 2+ of 104106 and a concentration factor of indium of about 400 was achieved, the copper content exceeding by 70 times that of indium. An analogous SLM process using a membrane of TBP dissolved in cumene is proposed by Valiente [314] for the separation of titanium(W) from chloride solutions. Charewicz et al. [315] separated indium(U) and strontium(U) by the ELM technique using carboxylic acids (caprylic and linolic) as carriers. Liquid membranes are applied by Wang and Liu [316] and Zeng and Chan [317] to separate vanadium and by Hozawa et al. [318] to concentrate gallium and indium. In order to achieve a selective extraction of Ga 3+ from a gallium-aluminum solution, Shimidzu and Okushita [319] impregnated their porous support with alkylated cupferron (ammonium salt of N-(alkylphenyl)-N-nitrosohydroxylamine). Gutknecht and Schugerl [320] successfully separated germanium from fly ash leaching solutions by means of an ELM method. A practically complete germanium recovery from a 9 M hydrochloric solution is achieved in several minutes. The donor phase contained other metal ions (Cu, Ag, Fe, Mo, Si, among others) in much higher concentrations. These were not detected in the acceptor solution (1 M NaOH). The organic membrane was a mixture of carbon tetrachloride, xylene and a surfactant. Izatt et al. [321] separated thallium from donor solutions containing various thallium salts: cyanides, carbonates, nitrates, etc., by means of the crown ether DC18C6. In this study valuable results about the role of the coanion on the pertraction of thallium ions are presented.
7.5.3 Pertraction of Inorganic Substances The elevated concentration of nitrogen compounds, e.g., ammonia, in waste waters causes a severe ecological problem. After Li's patent [322] for ammonia recovery by means of ELM was published, a number of studies appeared on this subject [99,146,323,324,456]. Kitigawa et al. [260] studied NH~ pertraction from waste water. It is known that in alkaline solutions (pH > 9) the equilibrium: NI-I 3 +
H20 " > NH4OH ," -~ NH~ + OH-
(7.30)
324
7 - UQUID MEMBRANES(LIQUIDPERTRACTION)
is shifted to undissociated ammonia molecules, which are soluble in the oil membrane S. When an acidic acceptor solution R is used, NH3 transferred through the membrane is irreversibly transformed into NH~ and is thus removed from the waste water. The membrane liquid in this case consists of isoparaffins, polyamines or sorbitan monooleate as emulsifiers. The acceptor liquid is an aqueous solution of HC1 or H2SO4. Under the optimum conditions, these authors reduced the NH~ content from 50 to 0.37 ppm within 20 minutes of contact time. Rautenbach et al. [325,397] used the same technique for the removal of ammonia from waste waters in a broad concentration range. The initial ammonia concentration varied from 50 to 1000 ppm, the H2SO4 concentration in the acceptor solution from 0.5 to 20 wt.%. They found that in all cases more than 99% of ammonia present in the outer, donor phase were extracted in 40 minutes. As a liquid membrane, paraffin oil containing a surfactant was used. The amount of extracted ammonia increases on raising the H2SO4 concentration in the R solution. With 20 wt.% of H2SO4, however, a pronounced phase inversion takes place. A tendency for emulsion inversion is observed at low ammonia concentrations in the donor solution F as well. This undesirable phenomenon is caused by the lower osmotic pressure of the.R solution. A more significant difference between the osmotic pressures on both sides of the membrane gives rise to a transfer of water from F to R, swelling and emulsion break-up. Schlosser and Kossaczky [326] studied a similar pertraction system, using a four-mixer cascade ending with a settler. They studied the effect of various surfactants and other additives on pertraction efficiency and the de-emulsification kinetics in an electrical field. Among the surfactants tested were: SPAN~80, TWEEN~80, the polyamine ECA | and the oxime LIX~64N. The acceptor phase was an aqueous solution of H3PO4, the liquid membrane n-alkanes. The use of additives modifying the structure of the adsorption film between the emulsion and the donor phase is considered by the authors to favor both the pertraction and the subsequent emulsion break-up. Takuma Co. (Osaka, Japan) in cooperation with Exxon Research and Engineering Company [327] proposed a liquid membrane technology for ammonia extraction from wastes (night soil) and utilization. It competes with the anaerobic biological denitrification, which imposes a preliminary extra dilution of the treated waters, to reduce the ammonia content below 200 ppm, and addition of methanol. In this case, ammonia is converted to nitrogen and cannot be further utilized. The process permits to extract 90% of the ammonia present in a donor solution at pH 10.2 in less than 20 minutes. An ammonium sulfate solution of 15% final concentration is obtained, which may be applied as a fertilizer. By combining ELM with steam regeneration, Cahn et al. [328] extracted (NH4)2S from waste waters.
7 - LIQUIDMEMBRANES (LIQUIDPERTRACTION)
325
1
Q6 0/,
Q2
ol , ~ ~ 0
/,
CH3COOH I
l
8
12
16 t [min]
Fig. 7.18. ELM removal of nitric, hydrochloric, sulfuric and acetic acids. Membrane liquid is carbon tetrachloride.
The pertraction of inorganic acids (HNO3, HC1, H2SO4) from aqueous solutions is described [104,329,330]. Boyadzhiev and Bezenshek [331] attempted the separation of the acids mentioned by means of the ELM technique. As a membrane liquid carbon tetrachloride, containing I vol.% of TBP as a carrier, is used. As Fig. 7.18 shows, the distribution coefficient of the acid between the organic membrane and water (mHNO3= 5"10-3 mH2so~ < 10-4, mHCl< 10-4, respectively) is the factor controlling the rate of acid extraction and separation. In the same figure the removal of acetic acid (mc~3COOH = 6.15"10-2), effected within a few minutes, is shown. Ivakhno et al. [332] compared the results of HNO3 pertraction obtained in a diffusion cell with supported or unsupported bulk membrane of n-decane using two carriers, TBP and TAA. An aqueous suspension of calcium hydroxide is used as the acceptor phase R. They found that TAA yields better results. Membrane pertraction of HNO3 using the SLM technique was performed by Danesi et al. [333]. The authors studied the effect of various carriers dissolved in diethylbenzene. According to this study, the most appropriate proved to be the aliphatic amines TLA and Primene~ followed by TOPO and other monoor bifunctional organophosphorus carriers. Special attention was paid to the liquid pertraction of anions, hardly extractable by other methods [259]. The phosphate ion PO43- is a typical example. It is extracted from aqueous solutions by means of oil-soluble amines or quaternary ammonium salts. The acceptor phase contains CaC12 and Ca(OH)2, so that Ca3(PO4)2, insoluble in the organic membrane, is obtained. The two steps of the transfer are illustrated by the following chemical reactions: 3(R3N-HCL) + PO 3- " ; (R3NH)3PO 4 + 3C1-
(7.31)
2(R3N-H)3PO 4 + 3CAC12 -" " 6(R3NHC1) + Ca3(PO4) 2
(7.32)
326
7 - LIQUIDMEMBRANES(LIQUIDPERTRACTION)
The final result is the exchange of PO 3- and Cl-between the two aqueous phases F and R. The transfer of PO 3- through liquid membranes containing a selective carrier was also studied by other authors [334,335]. Kataoka et al. [34] studied the mechanism of Cl- transport through a supported liquid membrane using as a carrier Amberlite~LA-2. They found that the rate of C1- transfer from the F to the R solution depends on the NaOH concentration in the acceptor solution R. This fact is related to the slower back-transfer of OH' from R to F. Boyadzhiev and Bezenshek [336] extracted and concentrated iodine from its synthetic aqueous solutions or brine by means of the LFP method. Besides iodine, the treated brine contained bromine, NaCI, CaCI2 and MgC12 as well as suspended solid particles. As the organic membrane, a mixture of n-paraffins (C10-C13) was used. The acceptor phase was alkalized with a NaOH aqueous solution of Na2SO3and a pH value of 12. The transfer of iodine is due to the fact that iodine molecules, transferred through the organic membrane S into the alkaline acceptor solution R, are converted into ions (I-) insoluble in S according to the reaction: I2 + Na2SO3 + 2 N a O H ~
" Na2SO4 + 2 N a I + H 2 0
(7.33)
In the experiments with brine, the solids are removed by filtration, then the anion I- is converted into elemental iodine by the addition of NaNO2 at pH = 2-3. This method allows the decrease of iodine concentration in the donor solution F from 0.034 kg m "3 down to 0.0006-0.0008 kg m -1. Simultaneously, a 100-fold accumulation of iodine in the acceptor solution, with no other ions transferred from the feed, is achieved.
7.5.4 Pertraction of Organic Substances Liquid membranes have a broad potential application for purification of industrial effluents from toxic organic compounds. The donor liquids usually represent dilute aqueous solutions of weak organic acids or bases. When present in an undissociated molecular form, these organic species are relatively soluble in the oil membrane S. Their transport through the membrane is usually based on their concentration gradient across the membrane, maintained by means of an irreversible chemical reaction of the solute with a strong base or a strong acid, respectively, dissolved in the acceptor phase R. The resulting salt is usually a strong electrolyte dissociated into ions, which are m~oluble in the oil membrane S. In this way, irrespective of the high salt concentration in the acceptor phase R, the apparent concentration of solute in this liquid is practically zero. The system most thoroughly studied is aqueous solution of phenol-hydrocarbon(s)-aqueous solution of sodium hydroxide [71,98,122,337,341,353,457464,468,469]. It results from many branches of industry, e.g., coal coking, oil
7 - LIQUIDMEMBRANES(LIQUIDPERTRACTION)
327
refinery, production of synthetic resins, etc., that yield waste waters containing the highly toxic phenol. The concentration of phenol in these waters varies within a broad range, from several ppm or even parts of ppm to several percent. Biochemical dephenolization is known to work well only at low concentrations (below 100-200 ppm), whereas conventional liquid-liquid extraction can be applied in a broader range: from 100 to 10,000 ppm [337]. Liquid-liquid extraction has, however, a severe drawback: the solubility of the used polar organic solvents in the dephenolized raffinate imposes an additional treatment of the latter in order to remove the dissolved solvent. This drawback can be eliminated by using nontoxic organic solvents with very low water solubility, e.g., below I ppm. Normal paraffins of nine or more carbon atoms meet this requirement. However, they cannot be used as solvents in liquid-liquid extraction, since the distribution coefficients of phenol between the paraffins and water are far below one. In this particular case, liquid membranes offer a specific advantage over the liquid-liquid extraction processes [139,338]. Many other hydrocarbons or their mixtures of various composition are used as membrane liquids: isoparaffins S100N [80,98,102,337,339], hydraulic and transformer oils, naphtha [340], normal paraffins [272,341-343], mono-n-alkylbenzenes [341], silicon oil [343], benzene [396], kerosene [73,90,340,344-347], a mixture of diethyl ether and kerosene [90] and mineral oil [101]. Schlosser and Kossaczky [341] pointed out that the solute flux strongly depends on the distribution coefficient of phenol between the solvent used and the donor liquid. But in the case of the ELM technique, the use of solvents providing higher distribution coefficients does not always help in improving the transfer process. For example, alkylbenzene better dissolves phenol than n-paraffins, but the viscosity of the obtained emulsions is about five times higher than that of n-paraffin emulsions. As a result, phenol pertraction with alkylbenzene has a lower rate, irrespective of the higher distribution coefficient. A great number of surfactants are employed for emulsion stabilization. The most often used is sorbitan monooleate (SPAN| [73,98,102,122,337,339,341, 344,345], but amine-based surfactants such as ECA | provide better emulsion stability when strong alkaline solutions (pH > 13) are used as acceptor phase. Yu et al. [348] and Zhang et al. [349] developed new surfactants of a succinimide type especially for this process. The effluents to be treated contain from 100 to 1000 ppm of phenol. In some studies more concentrated donor solutions containing above 2000 p p m of phenol are also used [101,344,349,350]. Cahn and Li [98] claim that phenol in the acceptor phase can be equilibrated with phenol in the treated effluent (F phase) even if its concentration in the R phase exceeds that in the F phase by 10,000 times. The existing results reveal that the ELM method is quite successful for the dephenolization of waste waters. Provided an appropriate emulsion formula-
328
7 - - LIQUIDMEMBRANES(LIQUIDPERTRACTION)
tion, phenol concentration in the donor solution can be sharply reduced in a few minutes. For instance, in the studies of Li and Shrier [337], phenol concentration decreased from 1740 ppm to below 10 ppm in 5 minutes, which corresponds to 99.4% recovery. Schlosser and Kossaczky [341], as well as Li [351], obtained similar results for the same pertraction time: 97% and 99.6% recovery, respectively, at an initial phenol content of 1000 ppm. Stirred tank contactors as well as various extraction columns were used [94]. Zhu et al. [352] and Ihm et al. [353] published the results of their studies on water dephenolization with a two-step, mixer-settler cascade. The continuous countercurrent column of Li and Zhang [71] of 120 cm height and 6.2 cm diameter removed 99% of the phenol present in waste waters at an initial concentration of 500 ppm. The height of a theoretical stage is about 160-190 cm [354]. Wang et al. [76] treated phenol-containing waters in a rotating-disc extraction column. Other pertraction techniques are also applied to remove phenols from dilute aqueous solutions. Their advantage is that no surfactants complicating the process are used. For example, Boyadzhiev compared three different liquid membrane methods to this purpose: ELM, SLM and LFP [338]. All techniques provided successful water dephenolization, the membrane phase consisting of a mixture of n-paraffins (C10-C13),irrespective of the relatively low values of the distribution coefficients (m = 0.10-0.15). The ELM method offers a much higher mass-transfer coefficient. The alkaline acceptor solution decreases the SLM lifetime. When a concentrated solution of sodium phenolate is desired, LFP is the more appropriate method. Both the relatively low distribution coefficients and the necessity for processing of phenol-containing waters with strongly alkaline acceptor solution are probably the reason that supported liquid membranes are rarely employed for this purpose [355]. Pertraction processes are suitable for treating phenolic waste waters, which also contain large amounts of chlorides, ammonia and amines [98]. The tentative economic estimation of Cahn and Li confirmed the superiority of the ELM over the classical liquid-liquid extraction with respect to phenol recovery from water at a concentration level of about 1000 ppm. Later, Schlosser and Kossaczky [341] confirmed this assertion following another calculation scheme. Many studies are devoted to recovery of various phenol derivatives and other organic acids [76,80,459,474--479]. Teramoto et al. [73] separated 0-, m- and p-cresol applying the DE technique, the acceptor phase being an aqueous solution of lithium hydroxide. Borwankar et al. [84] studied the pertraction of o-chlorophenol, Yu and Zhang [357] 2-, 3- and 4-methylphenol, and Araki et al. [358] nitrophenol with n-butanol as a carrier. Wang et al. [76] and Yan et al. [359] performed a successful pertraction of aliphatic and other organic acids. Cahn and Li [98] and Terry et al. [80] recovered acetic acid using a liquid membrane consisting of an isoparaffinic mixture. Boyadzhiev [79] employed a mixture of
7 - LIQUIDMEMBRANES(LIQUIDPERTRACTION)
329
carbon tetrachloride and TBP for the same purpose; Nuchnoi et al. [381] separated the aliphatic acids by means of a supported liquid membrane soaked with a mixture of TOPO and kerosene. The pertraction of lactic acid, acetic acid, propionic acid and acrylic acid has drawn the attention of O'Brien [360]; citric acid in fermentation liquids was the transported component in the studies of Boey et al. [361], Basu and Sirkar [480], Friesen et al. [481], Sirman et al. [482]. Ishikawa et al. [30] separated and preconcentrated fumaric acid and L-malic (hydroxysuccinic) acid from acidic aqueous solutions (pH = 2.0) using a 1-decanol supported liquid membrane. The studies of Kikic et al. [153] on the separation of mixtures of xylene isomers by means of double emulsions and a gaseous acceptor phase (nitrogen) are also of interest. The transfer processes of various aromatic acids are examined as well, e.g., benzoic acid [89,459,483], amino acids like phenylalardne [362,484,485], 03-aminosulphonic acids [363], optical isomers of the acids like D- and L-phenylglycine [364] and other related compounds [364-369,469,473,486-488,]. Methods were developed for the separation of weak organic bases like aromatic and aliphatic amines from aqueous solutions [98,133,135,357,370,469, 471,472]. The acceptor phase R in this case is a solution of a strong mineral acid, e.g., HC1 or H2SO4. In this way the amine transported through the membrane is transformed in the acceptor solution into a salt that is not oil-soluble and therefore cannot be back-transported. It is known that sensitive methods for the analysis of trace quantities of toxic amines in the atmosphere, waste waters and physiological liquids are strongly needed. Audunsson [371,372] successfully applied the SLM technique for analytical purposes, preconcentrating amines from very dilute donor solutions. Liquid membranes are used also for the selective transfer of electroneutral species like saccharides. The monosaccharides fructose, galactose and glucose were recovered from alkaline donor solutions (pH = 10) and were concentrated in an acidic acceptor solution (pH = 3). The selective transfer of these solutes is effected by means of phenylboric acid dissolved in a solution of TOMAC in dichloroethane. Simultaneously with the transfer of saccharides from the donor to the acceptor solution, an equivalent transfer of chloride ions in the opposite direction takes place [373].
7.5.5 Biotechnological and Medical Applications Biotechnology and medicine are among the application fields of liquid membranes with the most prospects. There are numerous laboratory studies employing liquid pertraction [83,161,379,489-493]. Yagodin et al [9,374] used liquid membranes to extract toxins from biological liquors. By means of a liquid membrane of paraffin oil stabilized with sorbitan monooleate, they extracted
330
7 - LIQUIDMEMBRANES(LIQUIDPERTRACTION)
cholesterol-- the main cause for atherosclerosis-- from blood. The valuable blood c o m p o n e n t s - - proteins, glucose, calcium, inorganic phosphorus compounds, blood cells, etc. - - are not transported through the membrane and remain unaltered in the treated blood sample. Yurtov et al. [83] separated cholesterol and aminoacids, e.g., lysine, using the ELM technique. The membrane liquid is vaseline oil and the acceptor solution is a mixture of ethyl alcohol and diethyl ether in a phosphate buffer (an isotonic solution) or a suspension of glucosides in the isotonic solution. The first kind of acceptor solution is appropriate for the separation of lipids, the second for a selective isolation of free cholesterol from aterogenic lipoproteins. Liquid pertraction has a potential medical application in the case of drug or chemical poisoning. It is known that the poisoning hazards most often encountered are those with salicylates (e.g., Aspirin ~) and barbiturates (e.g., Luminal~). Both types of medicines are organic acids, so the acceptor phase capsulated (if the ELM method is considered) contains a strong base. This approach yields promising results: about 95% of the two preparations are isolated and neutralized within five minutes from a medium simulating the stomach liquid [380]. Frankenfeld and Li [161] proposed other r e a g e n t s - proteins, active carbon and specific medical antibodies-- to be encapsulated in the membrane liquid in order to provide for an irreversible binding of the transferred compounds. Chiang et al. [376] demonstrated a possibility of in vitro separation of six different barbiturates, among which are amobarbital and phenobarbital, the donor solution having a pH of 2. Panaggio and Rhodes [377] gave more attention to the theory of liquid membrane transfer of some medical preparations (acetylsalicylic acid, salicylic acid etc.) using as a donor a 0.1 N solution of hydrochloric acid containing the corresponding substance and as an acceptor, an alkaline solution of pH 10. Majumdar and Stroeve [378] studied the application of SLM technique to curative purposes: removal of local anesthetics as methyl-, ethyl-, 2-ethyl-, butyl-p-aminobenzoate etc., from various aqueous donor liquors. 9 The review of Davies [379] covers the usage of ELM for the therapy of some diseases by applying special treatment with pharmaceuticals. No removal of substances from physiological liquids is aimed in this case, but a controlled release of the drug encapsulated in the oil membrane. The preparation is dissolved in the capsulated liquid and after the emulsion has been swallowed, the medicine slowly penetrates through the membrane liquid into the acceptor medium, which has to be cured. In this way the concentration level of the drug, required to achieve the medicinal effect, is maintained for a long time. Results of animal treating in vivo with insulin, with the antitumorous preparation, Bleomycin ~, with anticancerogenic and with antinarcotic substances are published. Recently, much of information has appeared in specific medical lit-
7 - LIQUIDMEMBRANES(LIQUID PERTRACTION)
331
erature concerning this new approach in medicinal treatment known as "controlled release". Li and Asher [161, 380] proposed a liquid membrane device for artificial oxidation of blood, as required, for example e.g. in surgical intervention. Halwachs and Schugerl [163] called this device an "artificial lung". It aims to enrich blood with oxygen and to remove carbon dioxide without harming blood proteins and cells, as conventional blood oxygenators do. The principal schemes of the liquid-membrane oxygenators are shown in Fig. 7.19. In the first case (Fig. 7.19a) a SLM method is used. Liquid fluorocarbons, indifferent to blood, transport oxygen to venous blood and simultaneously remove carbon dioxide. In the second case the oxygen is capsulated in liquid fluorocarbons using an emulsifier and the single-drop technique. Oxygen dissolves in the membrane and diffuses through it into the blood. Carbon dioxide is transferred in the opposite direction and is removed from the system. The liquid-membrane oxygenators are successfully tested both in vitro and in vivo on dogs.
BLOOD
02§ CO=
_
~ 02 + C02
i---- .....
a)
b)
Fig. 7.19.Blood oxygenators. (a) SLMconcept. Oxygenand carbon dioxide are counter-transported across a porous impregnated with liquid fluorocarbons solid membrane. (b) Single-drop technique. Oxygen bubbles, enveloped with liquid fluorocarbon films, enrich the surrounding medium in oxygen and remove the carbon dioxide. Bubbles are collapsed in the second apparatus and the gas and the liquid mixtures are separated.
332
7 - LIQUIDMEMBRANES(LIQUIDPERTRAC~ON)
Recently, a series of biotechnological studies using liquid membranes were published. The term "pertractive fermentation", a combination of fermentation and of liquid pertraction, was introduced. Nuchnoi et al. [381] combined the acidogenic fermentation with the selective transfer of some of the products through a supported liquid membrane. In this way the products inhibiting the fermentation process or reducing the efficiency of microorganisms are continuously removed. The membrane is a thin, porous support of polytetrafluorethylene impregnated with a solution of TOPO in kerosene. The donor solution F, which is the fermentation medium (broth), circulates on one side of the membrane. On the other side is the acceptor solution containing NaOH. The metabolic products like acetic acid and butyric acid are selectively removed from the fermentation medium and are irreversibly bound in the acceptor solution. The total yield of volatile aliphatic acids from this fermentation system is about five times higher than that from conventional acidogenic fermentation. Del Cerro and Boey [382] separated citric acid from fermentation broth applying the emulsion liquid membrane technique. The membrane contains 5 vol.% of ALAMINE~336. The acceptor phase is an aqueous solution of sodium carbonate. Marchese et al. [383] isolated benzylpenicilline from cultural solutions using the SLM method. The antibiotic is transferred through the organic membrane as an ionic couple with a tetrabutylammonium cation. Yamaguchi et al. [364] studied the separation of optical isomers of aminoacids with supported liquid membranes. They separated D- and L-glycine with a membrane phase containing crown ethers as selective carriers for the second isomer. A macrocyclic carrier of this type, dibenzo-18-crown-6 (DB18C6), was used also by Sugiura and Yamaguchi [384] for separation of the L-leucine and L-tryptophan esters applying the SLM method.
7.5.5.1 Special Case:Liquid-Membrane Enzyme Reactors A special case of selective removal of substances, mainly toxins from physiologic liquids, is the use of enzymes in the acceptor liquid R. The ELM method represents an alternative technique to the enzymes immobilization in a gel matrix or to their covalent bonding to inert supports [493,495]. Frankenfeld and Li [161] listed several advantages of liquid membrane techniques over those formerly used: cofactors can be included without taking any special measures; multienzyme systems can be applied; and the enzymes encapsulated in the organic membrane are protected against deactivation by substances not transferred and remaining in the donor solution or physiological liquid. Artificial detoxification of blood using pertraction takes place in the same way as the living organism eliminates the lipophilic metabolites and helps in the self-regeneration of the liver [385].
7 - LIQUIDMEMBRANES(LIQUIDPERTRACTION)
333
May and Li [6] encapsulated purified phenolase in the emulsified acceptor liquid. The phenols, dissolved in the outer donor phase, diffuse through a hydrocarbon membrane and are oxidized by the enzyme present in the acceptor liquid. The oxidized products cannot diffuse back to the outer physiologic solution F. The authors assert that after 90 minutes of contact time only a small part (about 20%) of the enzymes diffuse through the membrane into the outer solution F. There are also other studies on the usage of encapsulated enzymes for separation of toxic phenolic derivatives from blood or blood plasma [7,122, 386]. Volkel et al. [385] encapsulated the enzyme uridine diphosphoglucoronyl transferase (UDPGT) and the cofactor uridine diphosphoglucoronic acid (UDPGA). The liquid membrane consists in this case of n-paraffins, n-dodecanol and lecithin. Unlike SPAN-80, the most often used emulsifier, lecithin does not deactivate the enzyme. Lecithin yields water soluble products, which can be removed by the excretory system of the organism. Asher et al. [356,387] proposed that liquid membranes be applied for uremia treatment: urea is hydrolysed by urease capsulated in the emulsion. After three hours of contact time, the urea concentration decreases from 2000 to 600 mg 1-1. The hydrolysis of urea yields ammonia and carbon dioxide. The latter can be easily removed by the respiratory system, whereas ammonia can accumulate to a toxic level if no artificial removal is undertaken. In order to "catch" ammonia, the authors developed a liquid membrane system adding tartaric acid in the acceptor liquid. Thus, ammonia is transformed in an ammonium cation (NH~), which is insoluble in the oil membrane. Tartaric acid is preferred to sulfuric acid since the former is biodegraded. In this way ammonia concentration is reduced from 10 to 2 mg 1-1.The stability of the liquid membrane emulsion is tested on rats and on dogs both in vitro and in vivo [388]. It should be stressed, however, that a higher rate of toxin removal is required for a potential clinical usage; for a daily removal of 12 g of urea, a stoichiometric amount of 112 g of emulsion is needed. Urea removal through the gastrointestinal tract can be a valuable complement to chemodialysis. In this way, urea concentration in blood can be maintained at a harmless level for a longer time, thus relieving crisis states and prolonging the intervals between chemodialysis procedures. The enzyme degradation of urea is studied by other authors as well [389]. Chronic uremia leads to the accumulation not only of urea in the organism, but also of creatine, uric acid, phosphates, etc. Maugh [380], Frankenfeld and Li [161], Trouve et al. [389] proposed pertraction systems for the removal of these substances. Purified enzymes, bacterial homogenates and whole cells of Micrococcus denitrificans are used for the selective removal of nitrates and nitrites by means of liquid membranes [8]. Nitrates and nitrites are transferred through the organic membrane liquid by means of various amine carriers. The most efficient
334
7 - UQUID MEMBRANES (LIQUID PERTRACTION)
proved to be the secondary amine AMBERL1TE~ [259]. Applying the ELM technique, the whole amount of nitrates and 90% of the nitrites are reduced, the cells remaining intact and active for about five days. Nitrites are the intermediate product of nitrate reduction and the final product is nitrogen. The conversion of nitrates and nitrites by avoiding ammonia formation, affected by means of liquid membranes, is a prospective way of purifying solutions from these nitrogen compounds and, what is more, strong enzyme inhibitors like HgC12 cannot affect the cells encapsulated in the acceptor liquid. Enzyme liquid membrane reactors may be applied not only to the simplest type of bioconversion-- hydrolysis, which requires only one enzyme dissolved in water --- but also to more complex syntheses and transformations of biologically active natural products, e.g., racemate separation, synthesis of aminoacids, etc. [390]. To achieve the synthesis of L-leucine from 0c-ketoisocaproate, Makryaleas et al. [391] encapsulated three substances in the emulsion phase: L-leucine dehydrogenase (LEUDH), the cofactor reduced nicotinamid-adenine-dinucleotide (NAD-H) and the regenerating enzyme formate dehydrogenase (FDH). The substrata (x-ketoisocaproate and ammonium formate are transferred by the selective carrier ADOGEN| from the donor solution F through the liquid membrane containing n-paraffins and SPAN~0. The same carrier transfers back to the donor solution F the reaction products obtained in the acceptor phase R: L-leucine and carbonic acid. With an enzyme concentration of 30 units m1-1, 84% of the substrata are converted to L-leucine for 105 minutes. L-alanine is obtained in a similar way from D-and L-lactate [392]. Penicillin G, produced by fermentation, is converted into 6-aminopenicillanic acid (6-APA) in a continuous liquid-membrane reactor 2.5 m height and with a volume of 10.5 1 [390]. Penicillin is transferred through the kerosene membrane into the acceptor phase by the AMBERLITE~A-2 carrier. The enzyme penicillin-G-acylase, present in the acceptor solution, converts the substratum (penicillin G) to phenylacetic acid and 6-APA. The latter is a source substance for the production of acid-resistant and stable penicillin-type antibiotics. In this way, extraction of penicillin G from the fermentation broth, enzyme reaction and accumulation of the desired product in the acceptor phase simultaneously take place. For the practical application of enzyme liquid-membrane reactors, however, further improvements of the integrated operations involved are still required.
7.5.6 Process Economics and Industrial Application of Liquid Pertraction Liquid pertraction is generally considered one of the cheapest separation methods. Being a membrane operation, the separation doesnot involve phase transitions. Consequently, the power consumption is only a small part of the
7-- SQUID kIEMBRANI~ (I/QUID PERTRACTION)
335
total expenses even in the case of the ELM method. Unlike other membrane processes, however, there is a loss of membrane liquid and, therefore, the treated solution in many cases should be purified from this liquid. As a result, the total cost of the separation rises. On the other hand, the liquid membranes in some pertraction techniques are not too delicate so that some procedures for solution pretreatment, typical for other membrane processes, may be omitted. Most of the available economic information concerns processes, employing SLM and ELM operations. However, this rather scarce information, based on laboratory or pilot tests, should be regarded only as tentative. One of the first economic estimations considering the application of supported liquid membranes in copper hydrometallurgy [24] pointed out that this operation is considerably cheaper than the solvent extraction process used for the same purpose. The capital costs are reduced with a factor of two, the maintenance costs are reduced even further. The main advantage, however, exists in the fact that there are practically no losses of extractant caused by drop entrainment, whereas, for example, in conventional copper extraction process, these are found to be about 10-15 US cents per kg copper, thus constituting 40-59% of the annual operation costs of the extraction equipment. These data should be considered with some reservations since the authors cited underestimate the cost of the porous supports and assume an unrealistic (five years) membrane lifetime. It was shown in the detailed study of Pearson [26] that the question of how much supported liquid membranes are more profitable for removing copper and chromium from waste waters, compared to solvent extraction or ion exchange, cannot be explicitly answered due to the relatively high price of polypropylene porous supports and to the lack of an efficient method of membrane regeneration. This study, as well as the later one of Hett and Pearson [42], reveals that in the case of recovery of more valuable metals like chromium and nickel, the value of the final p r o d u c t - - chromic acid or nickel sulfate, respect i v e l y - - e x c e e d s the production costs. Their calculations relate to the case of 4000 m 3 waste waters per year, containing approximately I g 1-1 of chromium or nickel. Supported liquid membranes become unprofitable when strongly diluted solutions (below 100 ppm) are to be treated. Therefore, this pertraction technique is not appropriate for removal of traces of toxic or valuable metals from waste waters [93]. Data about the economics of a prOcess for zinc recovery from waste waters applying the ELM technique are provided by Yu et al. [393]. The material operational costs for the purification of I m 3 of water, containing I g 1-1 of zinc, are assessed at 1.57 yuans (1 yuan = 21 US cents). The essential part (64%) of the costs can be attributed to hydrochloric acid, used as acceptor solution, to sodium hydroxide used for the neutralization of the donor solution to pH 2
336
7 - LIQUIDMEMBRANES(LIQUIDPERTRACTION)
(18%) and to the extractant HDEHP (13%). The energy expenses are relatively low at 14%. No mention is made of labor costs, overheads or capital investments. According to the authors, treatment of solutions containing above 150200 ppm of zinc is still economically profitable, provided the concentrated solution of ZnC12 is reused. Similar are the data published by Draxler et al. [78]. According to them, the operational costs for producing 1 kg of zinc (as a concentrated solution of ZnSO4) amount to 52 US cents. In this case, the initial metal content in the donor solution was 0.5 g 1-1, the acceptor was a sulfuric acid solution of 250 g 1-1 and the carrier was D2EHDTPA. The data are a result of a one-year test on a pilot plant with 1 m 3 h -1 capacity. They are later confirmed on a full-scale plant designed to treat 75 m 3 h -1 waste waters. The ELM technique, which proved particularly efficient for the selective recovery of zinc from waste waters of rayon production, manifests superior economic parameters, compared to other processes used for this purpose such as precipitation with H2S and Ca(OH)2, ion exchange or liquid-liquid extraction [78,394]. There are also studies dealing with the economic comparison of the various pertraction techniques. According to Ivakhno et al. [395], which compared the costs of waste water purification from aromatic amines, the bulk pertraction methods, especially these of the LFP group, are 1.5 times cheaper than the ELM and more than three times cheaper than the corresponding SLM processes. The calculations refer to a price of the porous polymer supports of 50 US $ / m 2 having a lifetime of 4000 h and to equal extractant (carrier) losses for all pertraction techniques. It should be mentioned, however, that both the price and the lifetime of the supports in this study exceed the values provided by other sources. Besides, pertraction techniques with phase dispersion always show much higher losses of the membrane liquid.
7.6 CONCLUSION The numerous theoretical and experimental studies, as well as the economic tests, support liquid membrane techniques as very prospective separation operations. The pertraction systems, functioning as highly efficient chemical "pumps" selectively separating and concentrating substances, can be applied in a number of industrial branches, e.g., hydrometaUurgy, chemical and pharmaceutical industries, galvanic technologies, etc. One of the most attractive application fields is biotechnology. On the basis of described pertraction techniques, various processes for selective extraction of valuable components from cultural solutions and highly efficient enzyme reactors-separators can be created. Liquid-membrane processes have vast potential applications for environ-
7 - LIQUID MEMBRANES (LIQUID PERTRACTION)
337
mental purposes as well. The use of an electrochemical or photochemical driving force of the transmembrane process is also of special interest. On the other side, the study of pertraction processes yields a lot of information about the nature and mechanism of transport phenomena taking place in physiological systems. Although liquid membrane processes are still in the research or development stage, they hold a deserving position in the large family of membrane separation processes due to their indisputable advantages over conventional separation operations.
LIST OF SYMBOLS A N D ABBREVIATIONS U S E D
Symbols a
D
I
! k
kl kr m
t U
V X
Y Z
Sh
A B
F R
S
interfacial area diffusivity facilitation factor interfacial flux of species mass transfer coefficient rate constant of forward reaction rate constant of reverse reaction distribution coefficient time linear velocity volume concentration of solute carrier concentration concentration of hydrogen ions membrane thickness Sherwood number kF.d/D denotes denotes denotes denotes denotes
the the the the the
transfered solute reagent in the stripping phase feed (donor) solution stripping (acceptor) solution liquid membrane
Pertraction methods
BLM CLM
bulk liquid membranes contained liquid membranes
338 DEM ELM FLM LFP SLM
7- LIQUIDMEI~RaNES02QUIDPEKrRACnON) double emulsion method emulsion (surfactant) liquid membrane flowing liquid membranes liquid film pertraction supported liquid membrane
Carriers and solvents
D2EHPA
di(2-ethyl-hexyl)phosphoric acid 1,1-di-n-butyl-3-benzoyl-thiourea DB18C6 dibenzo-18-crown-6 (2,3,11,12-dibenzo-1,4,7,10,13,16-hexaoxacyclooctadeca-2,11-diene) DC18C6 dicyclo-18-crown-6 DIDPA diisodecylphosphoric acid DTPA or D2EHDTPA bis(2-ethylhexyl) dithiophosphoric acid EDTA ethylendiaminetetraacetic acid TAA trialkylamine TBAH tributyl aceto hydroxamic acid TBP tri-n-butylphosphate TIOA tri-iso-octylamine TLAHC1 trilaurylammonium chloride TOA tri-n-octylamine TOPO tri-n-octylphosphine oxide DBBT
Carriers and solvents (trade names)
ACORGA| Adogen| Alamine| Aliquat | 336 Amberlite~LA2 CYANEX~272 KELEX| LIX| LIX| LIX| LI~65N
LIX 0 S 100N~ SME|
5-nonylsalicylaldoxime + nonylphenol (ICI) tri-alkylmethylammonium chloride (Shering) tri-octyl amine (Henkel) methyl-tri-octylammonium chloride (Henkel) N-lauryl-l,l,3,3,5-hexamethyl-hexyl amine (Rohm & Haas) bis(2,4,4-trimethylpentyl) phosphinic acid (Cyanamid) 7-dodecenyl-8-hydroxyquinoline (Shering) n-8-quinolyl-p-dodecylbenzenesulfonamide phenyl-alkyl-~-diketone (Henkel) mixture of two oxime compounds LIX| and LIX| 65N (Henkel) 2-hydroxy-5-nonylbenzophen oxime (Henkel) 5,8-diethyl-7-hydroxy-6-dodecanone oxime + 3-chloro-5nonane-2-hydroxyphenone oxime isoparaffinic neutral oil (Exxon) 2-hydroxy-5-nonylacetophenone oxime (Shell)
7 -- S Q U I D M E M B R A N E S
(LIQUID P E R T R A C T I O N )
339
REFERENCES
1 Schlosser, S. and Kossaczky, E. (1975). Procs. 5th Int. Congress CHISA'75, Pertraction through liquid membrane. Prague, Czechoslovakia, 13.12. 2 Li, N.N. (1971). Ind. Eng. Chem. (Proc. Des. Devel.), 10: 215. 3 Li, N.N. (1971). AIChE J., 17: 459. 4 Casamatta, G., Boyadzhiev, L. and Angelino H. (1974). Chem. Eng. Sci., 29: 2005. 5 Casamatta, G., Angelino, H. and Boyadzl~ev L. (1977). Teor. Osn. Khim. Technol., 11: 825. 6 May, S. and Li, N.N. (1974). Enzyme Engineering (E.K. Pye and L.B. Wingrad, eds.), Plenum Press, New York, 2, p. 77. 7 Poppe, W., Halwachs, W. and Schuegerl, K. (1984). Chem. Ing. Techn., 56: 70. 8 Mohan, R. and Li, N.N. (1974). Biotech. Bioeng., 16: 513. 9 Yagodin, G., Lopukhin, Y., Yurtov, E., Gusseva, T. and Sergienko, V. (1983). Extraction of cholesterol from blood using liquid membrane. Procs. ISEC'83, Denver, Colorado, Pharmaceutical and Biological Extraction Processes, I, pp. 385-386. 10 Ohki, A., Takeda, T., Takagi, M. and Ueno, K. (1983). J. Membr. Sci., 15: 231. 11 Noble, R.D. and Way, J.D., (1987). Liquid Membranes. Theory and Applications (R. Noble and J.D. Way, ecls.) ACS Symposium Series No. 347, ACS, Washington, DC, p. 1. 12 Reusch, C.F. and Cussler, E.L. (1973). AIChE J., 19: 736. 13 Strzelbicki, J. and Bartsch, R.A. (1982). J. Membr.Sci., 10: 35. 14 Izatt, R.M., McBride, D.W., Brown, P.R., Lamb, J.D. and Christensen, J.J. (1986). J. Membr. Sc/., 28: 69. 15 Bacon E. and Jung, L. (1985). J. Membr. Sci., 24: 185. 16 Melzner D., Tilkowski, J., Mohrmann, A., Poppe, W., Halwachs, W. and Schuegerl, K. (1984). Hydrometallurgy, 13:105. 17 Christensen J.J., Lamb, J.D., Brown, P.R., Oscarson, J.L. and Izatt, 1LM. (1981). Sep. Sci.Technol., 16:1193. 18 Brown P.R., Izatt, R.M., Christensen, J.J. and Lamb, J.D. (1983). J. Membr. Sc/., 13: 85. 19 Burgard, M., Elisoamiadana, P. and Leroy, M.J.F. (1983). Liquid Membrane studies: Transport against the concentration gradient of AuCI~. Procs. ISEC'83, Denver, Colorado, Solid-Supported Liquid Membranes, II, pp. 399-4~. 20 Rosano, H.L., Schulman, J.H. and Weisbuch, J.B. (1961). Ann. N.Y. Acad. Sci., 92: 457. 21 Moore, J.H. and Schlechter, R.S. (1973). AIChE J., 19: 741. 22 Vorob'ev, A.V., Krykin, M.A., Popkov, Yu.M. and Timashev, S.F. (1985). Teor. Osn. Khim. Tekhnol., 19: 544. 23 Cussler E.L. (1971). AIChE J., 17:1300. 24 Baker, R.W., Tuttle, M.E., Kelly, D.J. and Lonsdale, H.K. (1977). J. Membr. Sc/., 2: 213. 25 Danesi, P.R., Horwitz, E.P., Vandegrift, G.F. and Chiarizia, R. (1981). Separ. Sci. Technol., 16: 201. 26 Pearson, D. (1983). Ion Exchange Membranes (D.S. Flett, ed.). Ellis Horwood, Publ., London, p. 55. 27 Nakashio, F. (1984). Kemikaru Enjiniyaru, 29: 58. 28 Zhang, X., MeregaUi, L. and Guerriero, R. (1985). J. Nonferrous Metals, 37: 64. 29 Loiacono, O. and Drioli, E. (1985). Chim. Oggi, No 7/8:11. 30 Ishikawa, H., Murakami, T., Hata, M. and Hikita, H. (1985). Chem. Eng. Comm., 34:123. 31 A_kiba,K. and Hashimoto, H. (1985), Talanta, 32, 8B: 824. 32 Harada, M., Yamazaki, F., Adachi, M. and Eguchi, W., (1983). Enrichment and Separation of Metals by Liquid Membrane with Tri-n-Octylamine. Procs. ISEC'83, Denver,
340
33 34 35 36 37 38 39
40
41 42
43 44 45 46 47 48 49 50 51 52 53 54
55 56 57 58 59 60 61 62 63 64
7 - - LIQUID MEMBRANES (LIQUID PERTIL&CTION)
Colorado, Solid-Supported Liquid Membranes, I, pp. 376-377. Chiarizia, R. and Castagnola, A. (1983). J. Membr. Sci., 14:1. Kataoka, T., Nishiki, T., Tamura, Y. and Ueyama, K. (1980). J. Chem. Eng. Jpn., 13 (1): 35. Kataoka, T., Nishiki, T. and Ueyama, K. (1982). Bull. Chem. Soc. Jpn., 55 (4): 1306. Komasawa, I., Otake, T. and Yamashita, T. (1983). Ind. Eng. Chem. (Fund.), 22 (1): 127. Danesi, P.R., Horwitz, E.P. and Rickert, P. (1982). Sep. Sci. Technol., 17, 9: 1183. Danesi, P.R., Chiarizia, R. and Castagnola, A. (1983). J. Membr. Sci., 14 (2): 161. Takagi, M., Ohki, A. and Ueno, K. (1983). A Liquid Membrane Separation of Ionic Species Using a Redox Reaction as a Driving Potential. Procs. ISEC'83 Denver, Colorado, pp. 60--61. Gasparini, G.M., Grossi, G.G., Casarci, M. and D'Andrea, A. (1983). The Recovery of Plutonium by Means of Solid Supported Liquid Membrane. Procs. ISEC'83, Denver, Colorado, Solid-Supported Liquid Membranes, II, pp. 395-396. Danesi, P.R. and Cianeti, C. (1984). J. Membr. Sci., 20 (2): 215. Flett, D. and Pearson, D. (1985). Role of Hollow Fibre Supported Liquid Membranes in Hydrometallurgy. Procs. Extraction Metallurgy '85, Institution of Mining and Metallurgy, London, p. 1. Lee, K.H., Evans, D.F. and Cussler, E.L. (1978). AIChE J., 24, 5: 860. Teramoto, M. and Tanimoto, H. (1983). Sep. Sci. Technol., 18,10: 871. Takahashi, K. and Takeuchi, H., (1985). J. Chem. Eng. Jpn., 18, 3: 205. Danesi, P.R., Reichley-Yinger, L. and Rickert, P.G. (1987). J. Membr. Sci., 31, 2-3: 117. Fabiani, C., Merigiola, M., Scibona, G. and Castagnola, A.M. (1987). J. Membr. Sc/., 30: 97. Neplenbroek, A.M., Bargaman, D. and Smolders, C.A. (1988). S L M - Degradation by Emulsion Formation. Procs. ISEC'88, Moscow, 3, pp. 61--63. Fujinawa, K., Akiyama, M., Akiba, I., Adachi, H., Shono, A., Imaishi, N. and Hozawa, M. (1989). Kagaku Kogaku Ronbunshu, 15 (1): 159. Takeuchi, H. and Nakano M. (1989). J. Membr. Sci., 42 (1/2): 183. Danesi, P.R. and Rickert, P.G. (1986). Solv. Extr. Ion. Exch., 4 (1): 149. Tanigaki, M., Ueda, M. and Eguchi, W. (1988). Sep. Sci. Technol., 23 (10/11): 1161. Teramoto, M., Matsuyama, H., Takaya, H. and Asano, S. (1987). Sep. Sci. Technol., 22: 2175. Teramoto, M., Matsuyama, H., Takaya, H., Yonehara, T. and Miyake,Y. (1988). Separation of Benzene from Cyclohexane by Flowing Liquid Membrane and Removal of Heavy Metal Ions by Spiral-Type Flowing Liquid Membrane Module. Procs. of ISEC'88, Moscow, 3, pp. 110-113. Igawa, M., Saitou, K., Monoe, F., Nishida, K., Tanaka M. and Yamabe, T. (1985). Nippon Kagaku Kaishi, 5: 825. Sengupta, A., Basu, R., Prasad, R. and Sirkar, K. (1988). Sep. Sci. Technol.,23 (12/13): 1735. Sengupta, A., Basu R. and Sirkar, K. (1988). AIChE J., 34 (10): 1698. Boyadzhiev, L., Lazarova, Z. and Bezenshek, E. (1983). Mass Transfer in Three-Liquid Phase Systems. Procs. ISEC'83, Denver, Colorado, p. 391. Schlosser, S., Kossazky, E. and Porubensky, V. (1984). Pertraction of Ammonia. Procs. CHISA'84, Prague, Czechoslovakia, Separation Processes, 2. Boyadzhiev, L. (1984). Isotopenpraxis, 20 (9): 345. Martin, T.P. and Davies, G.A. (1977). Hydrometallurgy, 2 (4): 315. Alessi, P., Canepa, B. and Kikic, I. (1979). Can. J. Chem. Eng., 57 (1): 54. Marr, R. and Kopp, A. (1980). Chem. Ing. Techn., 52 (5): 399. Schlosser, S. and Kossaczky, E. (1978). Comparison of Pertraction through Liquid Mem-
7--LIQUIDMEMBRANES(LIQUIDPERTRACTION)
341
brane and Liquid-Liquid Extraction. Procs. CHISA'78, Prague, Czechoslovakia. 65 Zhang R., (1984). Separation Techniques by Liquid Membranes, Jiangxi Renmin Publ., Nanchang. 66 Schuegerl, K., Mohrmann, A., Gutknecht, W. and Hauertmann, H. (1985). Desalination, 53: 197. 67 Kato, S. and Kawasaki, J. (1987). J. Chem. Eng. Jpn., 20:140. 68 Marr, R., Bart, H. and Siebenhofer, M. (1980). A New Concept for Mass Transfer in Liquid Surfactant Membranes. Procs. ISEC'80, Lion. 69 Marr, R., Bart, H. and Bouvier, A. (1981). Industrie Anzeiger, 28: 16. 70 Casamatta, G., Bouchez, D. and Angelino, H. (1978). Chem. Eng. Sci., 33: 145. 71 Li, X. and Zhang, Y. (1981). Mo Fenli Kexue Yu Jishu, 1, 2!(1981). 72 Melzner, D., Mohrmann, A., Poppe, W., Halwachs, W. and Schuegefl, K. (1982). Continuous Extraction of Metals with Liquid Membrane Emulsions in a Kueni Extractor. Procs. 3rd Chem. Eng. Conf., Graz, pp. 358-366. 73 Teramoto, M., Sakai, T., Yanagawa, K. and Miyake Y. (1983). Sep. Sci. Technol., 18: 985. 74 Goswami, A.N., Rawat, B.S. and Krishna, R. (1985). J. Membr. Sci., 25 (1): 101. 75 Jeong, Y., Ihm, S. and Won, Y. (1987). J. Membr. Sci., 32: 47. 76 Wang, J., Wang, B., Cui, Z., Sun, Y., Liu, Z. and Guen, J. (1988). Shuichuli Jishu, 14 (2): 69. 77 Colinart, P., Delepine, S., Trouve, G. and Renon, H. (1984). J. Membr. Sci., 20: 167. 78 Draxler, J., Furst, W. and Marr, R. (1988). J. Membr. Sci. 38: 281. 79 Boyadzhiev, L., Sapundzhiev, T. and Bezenshek, E. (1977). Sep. Sc/., 12: 541. 80 Terry, R.E., Li, N.N. and Ho, W.S. (1982). J. Membr. Sci., 10: 305. 81 Way, J.D., Noble, R.D., Flynn, T.M. and Sloan, E.D. (1982). J. Membr. Sci., 12: 239. 82 Lorbach, D. and Marr, R. (1987). Chem. Eng. Process., 21: 83. 83 Yurtov E.V., Korolyova, Golubkov, A.S. and Grigoriev, V.B. (1988). Dokl. AN SSSR, 302 (5): 1164 84 Borwankar R.P., Chan, C.C., Wasan, D.T., Kurzeja, R.M., Gu, Z.M. and Li, N.N. (1988). AIChE J., 34 (5): 53. 85 Draxler, J. and Marr, R. (1986). Chem. Eng. Process., 20: 319. 86 Stelmaszek, J. and Borkowska, B. (1975). Inzynieria Chemiczna, 5, 4: 869. 87 Alessi, P., Canepa, B., Costa, P. and Kicic, I. (1979). Riv. Combust., 33:189. 88 Boyadzhiev, L. and Kyuchoukov, G. (1978). Further Development of Carrier Mediated Extraction. Procs. CHISA'78, Prague, Czechslovakia. 89 Boyadzhiev, L. and Kyuchoukov, G. (1980). J. Membr. Sci., 6: 107. 90 Mitrovic, M. and Qiulin, W. (1982). Cartier Mediated Extraction in a Mixer-Dual Filter System. Procs. 3rd CEC'82, Graz, pp. 367-372. 91 Schneider, K. and Rintelen, T.H. (1986). Chem. Ing. Techn., 58, 10:800. 92 Nakano, M., Takahashi, K. and Takeushi, H. (1987). J. Chem. Eng. Jpn., 20, 3: 326. 93 Schulz, G. (1988). Desalination, 68: 191. 94 Gladek, L., Stelmaszek, J. and Szust, J. (1981). Recent Devel. Separ. Sci., 6: 29. 95 Kremesec, V.J. (1981). Sep. Purif. Methods, 10:117. 96 Kremesec, V.J. and Slattery, J.C. (1982). AIChE J., 28, 3: 492. 97 Stelmaszek, J. (1977). J. Membr. Sci., 2,197. 98 Cahn, R.P. and Li, N.N. (1974). Sep. Sc/., 9, 6: 505. 99 Hatton, T.A., Lightfoot, E.N., Cahn, R.P. and Li, N.N. (1983). Ind. Eng. Chem. (Fund.), 22: 27. 100 Ho, W.S., Hatton, T.A., Lightfoot, E.N. and Li, N.N. (1982). AIChE J., 28, 4: 662. 101 Kim, K., Choi, S. and Ihm, S. (1983). Ind. Eng. Chem. (Fund.), 22: 167.
342
7 ~ LIQUIDMEMBRANES(LIQUIDPERTRACTION)
Matulevicius, E. and Li, N. (1975). Sep. Purif. Methods, 4,1: 73. Hochhauser, A. and Cussler, E. (1975). AIChE Symp. Ser., 71,152: 136. Kopp, A., Marr, R. and Moser, F. (1978). Inst. J. Chem. Eng. Syrup. Ser., 54: 279. Kopp, A., Marr, R. and Moser, F. (1978). Liquid Membranes with Pump ~ A Classification of Emulsion Behavior and Consequences for Theories. Procs. CHISA'78, Prague, Czechoslovakia. 106 Nakashio, F. and Kondo, K. (1980). Sep. Sci. Technol., 15, 4:1171. 107 Voelkel, W., Halwachs, W. and Schuegerl, K. (1980). J. Membr. Sc/., 6: 19. 108 Wankat P.C. and Noble, R.D. (1984). Ind. Eng. Chem. (Fund.), 23: 137. 109 Kondo, K., Kita, K., Koida, I., Irie, J., Otake, T. and Yamashita, T. (1979). J. Chem. Eng. Jpn., 12: 203. 110 Goddard, J., Schultz, J. and Suchdeo, S. (1974). AIChE J., 20, 4: 625. 111 Goddard, J. (1977). Chem. Eng. Sci., 22: 487. (1977) 112 Schulz, G., Goddard, J. and Suchdeo, S. (1974). AIChE J., 3, 20: 417. 113 Goddard, J., Schultz, J. and Basset, R., (1970). Chem. Eng. Sci., 25, 5: 665. 114 Smith, K., Meldon, J. and Colton, C. (1973). AIChE J. 19,1:102. 115 Stroeve, P. and Varanasi, P. (1982). Sep. Purif Methods, 11: 29. 116 Suchdeo, S. and Schultz, J. (1974). Chem. Eng. Sci., 29:13. 117 Chaudry, M., Noor ul Islam, Mohammad, D. (1987). Nucleus (Karachi), 23: 7. 118 Smith, D.R. and Quinn, J.A. (1979). AIChE J.., 25:197. 119 Hoofd, L. and Kreuzer, F. (1979). J. Math. Biol., 8: 1. 120 Babcock, W., Baker, R., Lachapelle, E. and Smith, K. (1980). J. Membr. Sci., 7: 71. 121 Noble, R., Way, J. and Powers, L. (1986). Ind. Eng. Chem. (Fund.), 25: 452. 122 Halwachs, W., Flaschel, E. and Schuegerl, K. (1980). J. Membr. Sci., 6: 33. 123 Gladek, L., Stelmaszek, J. and Szust J. (1982). J. Membr. Sci., 12: 153. 124 Teramoto M., Takihana, H., Shibutani, M., Yuasa T., Hara, N. (1983). Sep. Sci. Technol., 18: 397. 125 Noble, R. (1983). Ind. Eng. Chem. Fund., 22: 139. 126 Stroeve, P. and Varanasi, P. (1984). AIChE J., 30:1007. 127 Draxler, J. and Marr, R. (1983). Chem. Ind., 106:698. 128 Marr, R., Kopp, A. and Wilhelmer, J. (1979). Ber. Bunsenges. Phys. Chem., 83: 1097. 129 Fales, J. and Stroeve, P. (1984). J. Membr. Sci., 21:35. 130 Hatton, T. and Wardius, D. (1984). AIChE J., 30: 934. 131 Park, H., Yoo, J., Suh, I., Han, P., Kang W., Burgard, M. and Leroy M. (1983). Analytical and Experimental Studies of Mass Transport through Liquid Membranes. Procs. ISEC' 83, Denver, Colorado, pp. 288-289. 132 I~m, J. and Stroeve, P. (1989). J. Membr. Sci., 45: 99. 133 Teramoto, M., Takihana, H., Shibutani, M., Yuasa, T., Miyake, Y. and Teranishi, H. (1981). J. Chem. Eng. Jpn., 14, 2:122. 134 Bunge, A.L. and Noble, R.D., (1984). J. Membr. Sci., 21: 55. 135 Baird, R.S., Bunge, A.L. and Noble, R.D. (1987). AIChE J., 33,1: 43. 136 Wardius, D., Hatton T. (1985)., Chem. Eng. Comm., 37:159. 137 Yagodin, G. and Ivakno, S. (1986). Teor. Osnov. Khim. Technol., 20: 291. 138 Reed, D., Bunge, A. and Noble R. (1987). ACS Symp. Ser. Liquid Membranes, 62: 83. 139 Boyadzhiev, L., Bezenshek, E., Lazarova, Z. (1984). J. Membr. Sc/., 21: 137. 140 Kholpanov, L., Awetisjan, K., Maljusov, W. (1988). Teor. Osn. Khim. Technol., 22: 299. 141 Li, N.N. (1968). U.S. Patent 3,410,794. 142 Ward, W. (1972). Recent Dev. Sep. Sci., 1: 151. 102 103 104 105
7-
LIQUIDMEMBRANES(LIQUID Pt~TRACTION)
343
143 Cahn, R. and Li, N.N. (1976). J. Membr. Sci., 1: 129. 144 Alessandrini, A., Alessi, P., Kikic, I., Visalberghi, M. (1978). Adv. Sep. Sci. Univ. Trieste, 234. 145 Nam, S. (1979). Hwahak Konghak, 17: 377. 146 Kataoka, T. and Nishiki, T. (1981). Kemikaru Enjiniyaringu, 26, 9:723. 147 Lagoo, C., Shankar, H., Murthy, S., Narayana, S. (1985). Indian Chem. Eng., 27: 52. 148 Plucinski, P. (1986). The Influence of the Surfactants on the Permeation of Hydrocarbons through Liquid Membranes. Procs. Europ. Jap. Congress on Membr., Membr. Proc., pp. 475-481. 149 Casamatta, G., Boyadzhiev, L. and Angelino, H. (1975). Mixture Separation through Two-Stage Extraction. Procs. CHISA'75, Prague, Czechoslovakia. 150 Casamatta, G., Chavarie, C., Angelino, H. (1978). AIChE J., 24: 345. 151 Kawasaki, J., Suzuki, T., Kato, S., Kondou, I.(1986). Separation of Hydrocarbons by Liquid Membrane Instability and Rates of Permeation. Procs. 3th World Congr. Chem. Eng., Tokyo, Japan, pp. 220-223. 152 Plucinski, P. (1985). Tenside Deterg., 22: 18. 153 Kikic, I., Alessi, P. and Vissalberghi, M. (1978). Inst. Chem. Eng. Syrup. Ser., 54:139. 154 Alessi, P., Kikic, I. and Visalberghi, M. (1980). Chem. Eng. J., 19: 221. 155 Shah, N.D. and Owens, T.C. (1972). Ind. Eng. Chem. (Proc. Res. Develop.), 11: 1. 156 Plucinski, P. and Szust, J. (1988). J. Membr. Sci., 38: 261. 157 Lieberwirth, I., Moehle, L. and Pfestorf, R. (1986). Wiss. Z., 35: 451. 158 Kato, S. and Kawasaki, J. (1987). J. Chem. Eng. Jpn., 20, 6: 585. 159 Ihm, S., Jeong, Y., Won., Y. (1987). J. Membr. Sci., 32: 31. 160 Cahn, R. and Li, N.N. (1976). Membrane Separation Processes, (Ed. P.Meares). Elsevier, Amsterdam, p. 327. 161 Frankenfeld, J.W. and Li, N.N. (1982). Treatise Anal. Chem., 5: 251. 162 Steele, R.D. and Halligan, J.E. (1974). Sep. Sc/, 9, 4: 299. 163 Halwachs, W., Schuegerl, K. (1978). Chem. Ing. Techn., 50,10: 767. 164 Stelmaszek, J. (1981). Recent Dev. Sep. Sci., 6: 11. 165 Kawasaki, J., Suzuki, T., Kato, S., Toyoda, I. and Kondou, I. (1987). Kagaku Kogaku Ronbunshu, 13: 487. 166 Alieva, R., Kuliev, A., Mekhtieva, Z., Akhundova, T. (1980). Azerb. Khim. Zh., 3: 95. 167 Krishna, R., Goswami, A. and Sharma, R. (1987). JoMembr. Sc/., 34: 141. 168 Bloch, R., Kedem, O. and Vofsi, D. (1963). Nature, 199: 802. 169 Zhang, Q. and Cussler, E. (1984). J. Membr. Sci., 19:259. 170. Bartsch, R., Charewicz, W., Kang, S. and Walkowiak, W. (1987). ACS Symp. Ser., Liquid Membranes, 347: 86. 171 Yoshida, S. and Hayano, S. (1986). J. Am. Chem. Soc., 108: 3903. 172 Burgard, M., Jurdy, L., Park, H. and Hembureg R. (1983). Nov. J. Chim., 7: 575. 173 Nakatsuji, Y., Sakamoto, M. and Okahara, M. (1988). J. Chem. Soc., Chem. Comm., 1101. 174 Sakim, M., Hayashita, T., Yamabe, T. and Igawa, M. (1987). Bull. Chem. Soc. Jpn., 60:1289. 175 Ramadan A. and Danesi, P. (1988). Solv. Extr. Ion Exch., 6: 157. 176 Christensen, J., Lamb, J., Brown, P., Oscarson J. and Izatt, R. (1981). Sep. Sci. TechnoL, 16: 1193. 177 Strzelbicki, J. and Charewicz, W. (1978). J. Inorg. Nucl. Chem., 40:1415. 178 Fyles, T. (1986). J. Chem. Soc. Faraday Trans. 1, 82: 617. 179 Yamaguchi, K., Negi, S., Kozakai, S. and Negano, R. (1988). Bull. Chem. Soc. Jpn., 61: 2047. 180 Nakatsuji, Y., Kobayashi, H. and Okahara, M. (1986). J. Org. Chemistry, 51: 3789. 181 Hiratani, K., Taguchi, K., Sugihara, H. and Iio, K. (1987). J. Membr. Sc/., 35: 91.
344
7 - LIQUIDMEMBRANES(LIQUIDPERTRACTION)
Sakamoto, H., Kimura, K. and Shono, T. (1987). Anal. Chem., 59: 1513. Inokuma, S., Hayase, T. and Kuwamura, T. (1987). Yukagaku, 36: 340. Xenakis, A. and Tondre, C. (1987). J. Colloid Interface Sci., 117: 442. Stolwijk T., Sudhoelter, E. and Reinhoudt, D. (1987). J. Am. Chem. Soc., 109: 7042. Izatt, R., Clark, G. and Christensen, J. (1985). J. Membr. Sci., 24: 1. Munoz M., Valiente, M. and Freiser, H. (1988). Facilitated Transport of Ag(I) through Supported Liquid Membranes Containing CYANEX 471 and DEHPA Mixtures. Procs. ISEC'88, Moscow, 3: 93. 188 Tromp, M., Burgard, M. and Leroy, J. (1988). J. Membr. Sci., 38: 295. 189 Anzai, J., Suzuki, Y., Ueno, A. and Osa, T. (1985). Isr. J. Chem., 26: 60. 190 Nishiki, T. and Bautista, R. (1983). AIChE Meeting, Denver' 83. 191 Purin B., Chibizov, V. and Kulikova L. (1988). Liquid Membrane Transport Systems for Metal Extraction. Procs. ISEC'88, Moscow, 3, pp. 13-14. 192 Moskvin, L. and Shmatko, A. (1988). Electrodialysis through Extraction Membrane. Procs. ISEC'88, Moscow, 3, p. 19. 193 Izatt, R., Eblerhardt, L., Clark, G., Bruening, R., Bradshaw, J., Cho, M. and Christensen, J. (1987). Sep. Sci. Technol., 22 (2/3): 701. 194 Hidalgo, N., Masana, A., Valiente, M., Freiser, H., and Sargon, J. (1988). The Use of Catalyzed Extraction in the Separation of Palladium (II) by Supported Liquid Membranes Containing CYANEX 471. Procs. ISEC'88, Moscow, p. 94. 195 Huang, C. and Huang, T. (1988). Ind. Eng. Chem. Res., 27: 1681. 196 Kobuke, Y., Tabushi, I., Oh, K. and Aoki, T. (1988). J. Org. Chem., 53, 25: 5933. 197 Chaudry, M., Noor ul Islam and Mohammad, D. (1987). J. Radioanal. Nucl. Chem., 109:11. 198 Ivakhno, S. and Rogatinski, A. (1986). lzv. Mosk. Khim. Inst., 43: 17. 199 Macasek, F., Rajec, P., Rehacek, A., Vu, N. and Popovnakova, T. (1985). J. Radioanal. Nucl. Chem., 96: 529. 200 Al~iba, K., Takashi, T. and Kanno, T. (1984). Tohoku Daigaku Senko Seiren Kenkyusho Iho, 40: 11. 201 Akiba, K. and Hashimoto, H. (1987). Chem. Aspects Down Stream Thorium Fuel Cycle, pp. 65-70. 202 Sifniades S., Largman T., Tunick, A. and Koff F. (1981). Hydrometallurgy, 7: 201. 203 Flett, D., Melling, J. and West, D. (1982). Investigation of Supported Liquid Membrane Process for Uranium Recovery from Wet-Process Phosphoric Acid. Procs. Oslo'82 Ion Exch. Solv. Extr. Symp., I, pp. 16-18. 204 Bock, J., Klein, R., Valint, P. and Ho, W. (1982). Liquid Membrane Extraction of Uranium from Wet-Process Phosphoric Acid. Procs. Symp. Sulfric/Phosphoric Acid Plant Oper., 1981, pp. 175--83. 205 Hayworth, H., Ho, W., Burns, W. and Li, N.N. (1983). Sep. Sci. Technol., 18: 493. 206 Dickens, N., Rose, M. and Davies, G.A. (1984). Trans. Inst. Chem. Eng. Symp. Ser., 88: 69. 207 Kim, K., Yoo, J. and Park, H. (1985). Hwahak Konghak, 23: 263. 208 Yoo, J., Kim, K. and Park, H. (1988). A Study on the Recovery of Uranium in Phosphoric Acid by Liquid Surfactant Membrane. Procs. ISEC'88, Moscow, 3, p. 101. 209 Lunt, D. and Naden, D. (1981). Liquid Membrane Extraction of Uranium from Wet Process Phosphoric Acid m A New Process. Procs. Hydrometallurgy'81, Manchester. 210 Akiba, K. and Kanno, T. (1983). Active Transport of Uranium(VI) through Supported Liquid Membrane Containing TOA. Procs. Symp. Solv. Extr., 1983, Hamamatsu, pp. 63-68. 211 Zhang, Y. (1983). Mo Fenli Kexue Yu Jishu, 3:10. 182 183 184 185 186 187
7 -- LIQUIDMEMBRANES(LIQUIDPERTRACTION)
345
212 Babcock, W., Kelly, D. and Friesen, D. (1983). Uranium Recovery with Coupled-Transport Membranes. Procs. ISEC'83, Denver, Colorado, Solid-Supported Liquid Membrane, I, p. 373. 213 Babcock, W., Friesen, D. and Lachapelle, E. (1986). J. Membr. Sci., 26: 303. 214 Zhu, Y., Jiang, C., Wang, S., Liu, Z. and Yu, J. (1983). Extraction of Rare Earth by Liquid Surfactant Membranes. Procs. ISEC'83, Denver, Colorado, Emulsion Liquid Membranes, I, pp. 58-59. 215 Sourougy, M., Khalifa, S., Zaki, E. and Aly, H. (1988). Lanthanide Extraction by Liquid Emulsion Membrane Based on Di-(2-Ethylhexyl) Phosphoric Acid. Procs. ISEC'88, Moscow, 3, p. 96. 216 Zhang,Z., Zhang, R., Wang, D. and Huang, B. (1986). Mo Fenli Kexue Yu Jishu, 6: 41. 217 Teramoto, M., Sakuramoto, T., Koyama, T., Matsuyama, H. and Miyake, Y. (1986). Sep. Sci. Technol., 21:229 218 Eguchi, W., Tanigaki, M. and Mori, Y. (1986). Asahi Found. Ind. Technol., 49: 237. 219 Muscatello, A., Navratil, J., Killion, M. and Price, M. (1987). Liquid Membranes, ACS Symp. Ser., 347: 182. 220 Akiba, K. and Nakamura, S. (1987). Chemical Aspects Down Stream. pp. 85-90. 221 Danesi, P., Chiarizia, R., Rickert, P. and Horwitz, E. (1985). Solv. Extr. Ion Exch., 3: 111. 222 Danesi, P. and Cianetti, C. (1984). J. Membr. Sci., 20: 201. 223 Novikov, A. and Myasoedov, B. (1987). Solv. Extr. Ion Exch., 5: 117. 224 Nakamura, S. and Akiba, K. (1989). Sep. Sci. Technol., 24: 673. 225 Rajec, P., Macasek, F. and Belan J. (1986). J. Radioanal. Nucl. Chem., 101" 71. 226 Mikulai, V., Kopunec, R., Svec, A. and Macasek, F. (1988). The Membrane Extraction A Suitable Method for the Preconcentration of Metals. Procs. ISEC'88, Moscow, 3, p. 14. 227 Largman, T. and Sifniades, S. (1978). Hydrometallurgy, 3: 153. 228 Strzelbicki, J. and Charewicz, W. (1980). Chem. Stosow, 2: 239. 229 Kondo, K., Nakashio, F. and Funatsu, K. (1983). Extraction Kinetics of Copper with Liquid Surfactant Membranes Containing Hydroxyoxime in a Stirred Transfer Cell. Procs. ISEC'83, Denver, Colorado, Emulsion Liquid Membranes, II, pp. 286-287. 230 Nakashio, F. and Kondo, K. (1982). Kenkyu Hokoku-Asai Garasu Kogyo Gijitsu Shoreikai, 41289. 231 Frankenfeld, J., Cahn, R. and Li, N.N. (1981). Sep. Sci. Technol., 16: 385. 232 Strzelbicki, J. and Charewicz, W. (1978). Sep. Sci. Technol., 13: 141. 233 Mikucki, B. and Osseo Asare, K. (1986). Hydrometallurgy, 16: 209. 234 Kondo, K., Takahashi, S., Tsuneyuki, T. and Nakashio, F. (1978). J. Chem. Eng. Jpn., 11: 193. 235 Schlosser, S., Kubicarova, E. and Kossaczky, E. (1981). Pertraction of Copper from Ammoniacal Solutions. Procs. CHISA'81, Prague, Czechoslovakia. 236 O'Hara, P. and Bohrer, M. (1989). J. Membr. Sci., 44: 237. 237 Fujinawa, K., Morishita, T., Hozawa, M. and Ino, H. (1985). Kagaku Kogaku Ronbunshu, 11:293. 238 Kondo, K., Kita, K. and Nakashio, F. (1981). J. Chem. Eng. Jpn., 14: 20. 239 Loiacono, O., Drioli, E. and Molinari, R. (1986). J. Membr. Sci., 28: 123. 240 Brunette, J., Lakkis, L., Lakkis, M. and Leroy, M. (1983). Metal Extraction with 4Acylpyrazol-5-ones: Synergetic Effects with Liphophilic Ammonium Salts; Application to Liquid Membrane Transport. Procs. ISEC'83, Denver, Colorado, pp. 284-285. 241 Nakashio, F., Goto, M., Matsumoto, M., Irie, J. and Kondo, K. (1988). J. Membr. Sci., 38: 249.
346
7-- UQUm M E ~ ~ S
gaQun> P~RTRhCnON)
242 Marr, R., Bart, H. and Bouvier, A. (1981). Chem. Ing. Techn., 53: 208. 243 Lazarova, Z. and Boyadzl~ev, L. (1988). Solutes Recovery from Aqueous Solutions by Creeping Film Pertraction. Procs. ISEC'88, Moscow, 3, p. 23. 244 Ohki, A., Hinoshita, H., Takagi, M. and Ueno, K. (1983). Sep. Sci. Technol., 18: 969. 245 Cox, J., Bhatnagar, A. and Franois, R. (1986). Talanta, 33: 713. 246 Yoshizuka, K., Kondo, K. and Nakashio, F. (1986). J. Chem. Eng. Jpn., 19: 312.247. 247 Goto, M., Kondo, K. and Nakashio, F. (1989). J. Chem. Eng. Jpn., 22: 79. 248 Kriechbaumer, A. and Draxler, J. (1982). Osterr. Chem. Z., 83:275 249 Marr, R., Protsch, M., Bouvier, A., Draxler, J. and Kriechbaumer, A. (1983). Chem. Ing. Techn., 55: 328. 250 Teramoto, M. (1983). Kagaku Kogo, 27: 20. 251 Bart, H., Baker, A., Lorbach, D. and Marr, R. (1988). Chem. Ing. Techn., 60:169. 252 Lorbach, D., Bart, H. and Marr, R. (1986). Chem. Ing.Techn., 58: 156. 253 Boyadzhiev, L. and Lazarova, Z. (1987). Chem. Eng. Sci., 42:1141. 254 Ivakhno, S., Tarassov, V. and Yagodin, G. (1985). Mezhfaznie Jawlenija pri Membrannoi Extraczii Metallov. Procs. SIS'85, Czechoslovakia, pp. 21-24. 255 Whewell, R.J., Huges, M.A. and Hanson, C. (1977). Aspects of the Kinetics and Mechanism of the Extraction of Copper with Hydroxyoximes. Procs. ISEC'77, Toronto, pp. 185-192. 256 Hanson, C., Hughes, M.A. and Whewell, R.J. (1978). J. Appl. Chem. Biotech., 28: 426. 257 Yan, Z., Ding, X. and Lin, F. (1982). Huanjing Kexue, 3:1. 258 Molinari, R., Drioli, E. and Pantano, G. (1989). Sep. Sci. Technol., 24,1015. 259 Frankenfeld, J.W. and Li, N.N. (1977). Rec. Dev. Sep. Sc/., 3: 285. 260 Kitagawa, T., Nishikawa, Y., Frankenfeld, J. and Li, N.N. (1977). Environ. Sci. Technol., 11: 602. 261 Li, X. and Zhang, Y. (1982). Extraction of Chromium Ions from Aqueous Solution with Liquid Surfactant Membranes. Procs. Joint Meet. Chem. Eng., Chem. Ind. Eng. Soc. China Am. Inst. Chem. Eng., 2, p. 571. 262 Lee, H., Yoo, J. and Ihm, S. (1983). Hwahak Konghak, 21:119. 263 Ivakhno, S., Yagodin, G., Rogatinski, A., Gusev, V. and Afanasiev, A. (1987). Zh. Fiz. Khim., 61: 649. 264 Malik, T., Chaudry, A., Husain, K. and Ahmed, B. (1987). Nucleus, 24: 25. 265 Weiss, S. and Castaneda, A. (1988). Mass Transfer of Chromium through a Liquid Membrane. Procs. ISEC'88, Moscow, 3, p. 88. 266 Ando, K., Masaoka, S., Akiyoshi, M. and Obata, E. (1988). Kagaku Kogaku Ronbunshu, 14: 417. 267 Teramoto, M. Matsuyama, H., Yamashiro, T. and Okamoto, S. (1989). J. Membr. Sci., 45: 115. 268 Mori, Y., Uemae, H., Hibito, S. and Eguchi, W. (1987). Kagaku Kogaku Ronbunshu, 13: 412. 269 Fuller, E.J. and Li N.N., (1984). J. Membr. Sci., 18: 251. 270 Strzelbicki, J., Charewicz, W. and Mackiewicz, A. (1984). Sep. Sci. Technol., 19: 321. 271 Baba, Y., Inoue K., Nakashio, F., Matsumoto M. and Goto, M. (1987). Nippon Kagaku Kaishi, 8: 1623. 272 Boyadzhiev, L. and Bezenshek, E. (1983). J. Membr. Sc/., 14:13. 273 Weiss, S., Grigoriev, V. and Muehl, P. (1982). J. Membr. Sci., 12:119. 274 Izatt, R., Johnes, M. Lamb, J., Bradshaw, J. and Christensen, J. (1986). J. Membr. Sci., 26: 241. 275 Danesi, P., Cianetti, C. and Violante, V. (1983). J. Membr.Sci., 14: 175.
7 - LIQUIDMEMBRANES(LIQUIDPERTRACTION)
347
276 Takahashi, M., Ohta, T., Nishiguchi, M., Katayama, Y. and Takeuchi, H. (1988). Kagaku Kogaku Ronbunshu, 14: 549. 277 Zhang, X. and Huang, P. (1988). J. Chem. Ind. Eng. China, 39: 570. 278 Izatt, R., Bruening, R., Clark, G., Lamb, J. and Christensen, J. (1986). J. Membr. Sc/., 28: 77. 279 Biel, M., Izatt, R., Lamb, J. and Christensen, J. (1982). Sep. Sci. Technol., 17: 289. 280 Boyadzhiev, L. and Bezenshek, E. (1982). Chem. Ing. Techn., 54: 506. 281 Fernandez, L., Aparicio, J. and Muhammed, M. (1986). J. Membr. Sci., 27: 77. 282 Huang, T. and Yuang R. (1987). J. Membr. Sci., 31: 209. 283 Uribe, I., Wongswan, S. and Perez de Ortiz, E. (1988). Ind. Eng. Chem. Res., 27, 9:1696. 284 Tanigaki, M., Shiode, T., Ueda, M. and Eguchi, W. (1988). Sep. Sci. Technol., 23: 1145. 285 Draxler, J. and Marr, R. (1988). Extraction of Zinc, Cadmium, Lead by Emulsion Liquid Membranes. Procs. ISEC'88, Moscow, 3, p. 4. 286 Harada, M., Shiomi, N. and Yamazaki, F. (1984). J. Chem. Jpn., 17: 567. 287 Verhaege, M., Ryckeboer, M. and Vanhullebusch, M. (1988). Elimination of Zinc from a Nickel Sulphate Solution by Liquid Membranes. Procs. ISEC'88, Moscow, 3, p. 78. 288 Poa, D., Miller, J. and Yao, N. (1985). Development of a Supported Liquid Membrane as a Nickel-Zinc Secondary Battery Separator. Report No. D3REP3, Argonne Natl. Lab., USA. 289 Danesi, P., Horwitz, E. and Rickert, P. (1983). Permeation Rate of Metal Species through Supported Liquid Membranes: Diffusional and Chemical Resistances with Cationic and Anioinic Carriers. Procs. ISEC'83, Denver, Colorado, p. 378. 290 Izatt, R., Bruening, R., Wu, G., Moon, H. and Christensen, J. (1987). Anal. Chem., 59: 2405. 291 Gu, Z., Wasan, D. and Li, N.N. (1985). Sep. Sci. Technol., 20: 599. 292 Gu, Z., Wasan, D. and Li, N.N. (1986). J. Membr. Sci., 26: 129. 293 Zhang, R., Xie, G., Liu, Y., Huang, Y. and Wang, W. (1984). Huanjing Kexue, 5: 30. 294 Pemsler, P. and Dempsey, M. (1984). The Application of Supported Liquid Membrane Separators to Alkaline Secondary Batteries. Proc. Electrochem. Soc. 84-4. (Adv. Battery Mater. Processes), p. 187. 295 De Santa G., Di Casa, M., Seghi, B. and Fabbr~zi, L. (1989). J. Am. Chem. Soc., 111: 2422. 296 Osseo-Asare, K. and Chaiko, D. (1989). J. Membr. Sci., 42: 215. 297 Lee, K. (1977). Diss. Abstr. Int. B 1978, 38, 7:3305. 298 Narebska, A., Wodzki, R. and Wyszynska, A. (1989). Makromol. Chem., 190:1501. 299 Chiarizia, R. and Castagnola, A. (1984). Solv. Extr.Ion Exch., 2: 479. 300 Matsuyama, H., Katayama, Y., Kojima, A., Washijima, I., Miyake, Y. and Teramoto, M. (1987). J. Chem. Eng. Jpn., 20: 213. 301 Huang, T. and Yuang, R. (1988). J. Chem. Techn. Biotechn., 42: 3. 302 Nam, S. and Kim, B. (1986). Nonmunjip Sanop Kwahak Kisul Yonguso, 14: 371. 303 Strzelbicki, J. and Charewicz, W. (1984). Hydrometallurgy, 13: 89. 304 Strzelbicki, J. and Charewicz, W. (1980). Hydrometallurgy, 5: 243. 305 Danesi, P. and Reichley, Y. (1986). J. Membr. Sc/., 27: 339. 306 Reichley, Y. and Danesi, P. (1985). Solv. Extr. Ion Exch., 3: 49. 307 Beg, M. and Kidwai, M. (1985). J. Membr. Sci., 24: 97. 308 Yatsimirskii, K., Talanova, G. and Rybak Akimova, E. (1986). Dokl. A N SSSR, 288: 646. 309 Ujita, G., Shibata, J. and Nishimura, S. (1984). Technol. Rep. Kansai Univ., 25: 81. 310 Tanigaki, M., Hashiguchi, Y., Yoshinori, H., Shode, T., Mori, Y. and Eguchi, W. (1987). Solv. Extr. Ion Exch., 5: 325. 311 Harada, M., Yamazaki, F., Adachi, M. and Eguchi, W. (1984). J. Chem. Eng., 17: 527. 312 Moskvin, L., Shmatko, A. and Krasnoperov, V. (1987). Elektrokhimiya, 23: 30.
348
7 - - LIQUIDMEMBRANES(LIQUIDPERTRACTION)
313 Guerriero, R., MeregaUi, L. and Zhang, X. (1988). HydrometaUurgy, 20: 109. 314 Valiente, M., Munoz, M. and Fernandez, A. (1988). Study of the Mass Transfer Process on the Separation of Ti(IV) by a SSLM using Tributylphosphate (TBP) in Cumene as a Carrier. Procs. ISEC'88, Moscow, 3, 95. 315 Charewicz, W., Hendrychowski, A. and Strzelbicki, J. (1984). Chem. Stosow., 28: 497. 316 Wang, Y. and Liu, G. (1985). Xiangtan Daxue Ziran Kexue Xuebao, 2: 122. 317 Zeng P. and Chan S. (1987). Wuji Huaxue, 3:122. 318 Hozawa, M., Shono, A., Akiyama, M., Imaishi, N. and Fujinawa, K. (1987). Separation and Concentration of Gallium and Indium Using Liquid Membrane. Proc. Symp. Solv. Extr., Hamamatsu, Japan, pp. 95-- 100. 319 Shimidzu, T. and Okushita H., (1986). J. Membr. Sci., 27: 349. 320 Gutknecht, W. and Schuegerl, K. (1988). Recovery of Germanium from Model and Fly Ash Leaching Solutions by the Emulsion Liquid Membrane Technique. Procs. ISEC'88, Moscow, 3, 68. 321 Izatt, R., Bruening, R., Clark, G., Lamb, J. and Christensen, J. (1986). J. Membr. Sci., 28: 77. 322 Li, N.N. (1974). U.S. Patent 482592. 323 Rautenbach, R. and Albrecht, R. (1979). Wiss. Umwelt, 2: 97. 324 Downs, H.H., Li, N.N. (1981). J. Sep. Process Technol., 2, 4: 19. 325 Rautenbach, R. and Machhammer, O. (1988). J. Membr. Sci., 36: 425. 326 Schlosser, S. and Kossaczky, E. (1987). Synthetic Polymeric Membranes (B. Sedlacek and J. Kahovec, eds.). Walter de Gruyter & Co., Berlin, p. 571. 327 Hayworth, H. (1981). CHEMTECH, 342. 328 Cahn, R.P., Li, N.N. and Minday, R.M. (1978). Environ. Sci. Technol., 12, 9: 1051. 329 Nishiki, T. and Kataoka, T. (1985). Bull. Univ. Osaka Prefecture, Series A, 34,1: 7. (1985) 330 Fernandez, L.A., Elizalde, M.P. and Aparicio, J.L. (1989). J. Membr. Sci., 44 (2-3): 213. 331 Boyadzhiev, L. and Besenshek, E. (1976). Comptes Rendus Acad. Bulg. Sci., 29, 4: 559. 332 Ivakhno, S., Kadasov, D. and Varlamov, V. (1988). Membrane Extraction of Nitric Acid. Procs. ISEC'88, Moscow, 3, p. 71. 333 Danesi, P.R., Cianetti, C. and Horwitz, E.P. (1983). Solv. Extr. Ion Exch., 1 (2): 299. 334 Trouve, G., Malher, E., Colinart, P. and Renon, H. (1982). Chem. Eng. Sci., 37, 8: 1225. 335 Zeng, P. and Cheng, R. (1986). Xiangtan Daxue Ziran Kexue Xuebao, 4: 54. 336 Boyadzhiev, L. and Bezenshek, E. (1988). J. Membr. Sci., 37: 277. 337 Li, N.N. and Shrier, A. (1972). Rec. Dev. Sep. Sci., 1:163. 338 Boyadzhiev, L. (1984). Teor. Osn. Khim. Technol., 18, 6: 735. 339 Ho, W.S., Hatton, T.A., Lightfoot, E.N. and Li, N.N. (1981). Extraction with Liquid Surfactant Membranes: A Diffusion-Controlled Model with Advancing Reaction Front. Procs. 2nd World Congress of Chem. Eng., Montreal, Canada. 340 Stelmaszek, J. (1979). Inzynieria Chemiczna, 9: 211. 341 Schlosser, S. and Kossaczky, E. (1978). Emulsion Properties Influence on Pertraction of Phenol from Water. Procs. CHISA'78, Prague, Czechoslovakia. 342 Boyadzhiev, L. (1981). Carrier Mediated Extraction: A Comparative Study on Supported Liquid Membranes and Double Emulsion Technique. ProcS. CHISA'81, Prague, Czechoslovakia. 343 Halwachs, W., Voelkel, W. and Schuegerl, K. (1980). Removal of Toxins from Plasma and Blood with Liquid Surfactant Membranes. Procs. ISEC'80, Liege, Belgium, 2, p. 80. 344 Shu, R., Chang, Y., Liu, Y., Chemg, J., Tao, C. and Lu, H. (1980). Huan Ching K'o Hsueh, 1,4: 4. 345 Teramoto, M. and Matsuyama, H. (1986). J. Chem. Eng. Jpn., 19, 5: 469.
7---- LIQUIDMEMBRANES(LIQUIDPERTRACTION)
349
Yang, P., Yang, X., Shen, L. (1987). Shanghai Huanjing Kexue, 6, 3:13. Zhang, Y., Liu, Y., Su, R. (1988). Water Treat., 3,1: 79. Yu, J., Jiang, C., Liu, Z., He, P. (1982). Mo Fenli Kexue Yu Jishu, 2 (1): 9. Zhang, X., Zang, X., Fan, J. and Liu, Z. (1982). Huanjing Huaxue, 1 (4): 320. Bargeman, D. and Smolders, C. A. (1986). Synthetic Membranes: Science, Engineering and Applications (P.M. Bungay et al., eds.). D. Reidel Publ. Company, p. 567. 351 Li, N.N. (1978). J. Membr. Sci., 3: 265. 352 Zhu, C., Wang, Q., Wu, W. and Wu, X. (1981). Zhejiang Daxue Xuebao, 4: 64. 353 Ihm, S.K., Kim, K.S. and Choi, S.J. (1981). Hwahak Konghak, 19, 3: 217. 354 Zhang, Y. and Li, X. (1983). Desalination, 47: 351. 355 Du, Q., Cheng, W. and Yu, T. (1987). Huanjing Kexue, 8 (2): 49. 356 Voelkel, W., Poppe, W., Halwachs, W. and Schuegerl, (1982). J. Membr. Sci., 11: 333. 357 Yu, W. and Zhang, L. (1986). Fenxi Ceshi Tongbao, 5 (6): 59. 358 Araki, T., Kubo Y., Takata M., Gohbara S. and Yamamoto, T. (1987). Chem. Lett., 6: 1011. 359 Yan, N.X., Huang, S.A., Shi, Y.J. (1987). Sep. Sci. Technol., 22 (2-3): 801. 360 O'Brien, D. and Senske, G. (1989). Sep. Sci. Technol., 4 (9-10): 617. 361 Boey, S.C., Garcia del Cerro, M.C. and Pyle, D.L. (1987). Chem. Eng. Res. Des., 65 (3): 218. 362 Thien, M.P., Hatton, T.A. and Wang, D.I. 1988). Biotechn. Bioeng., 32: 604. 363 Takeshima S., Sakurai, H. and Horisaka, K. (1986). Ganryu Aminosan, 9: 143. 364 Yamaguchi, T., Nishimura, K., Shinbo, T. and Sugiura, M. (1985). Chem. Lett., 10: 1549. 365 Bryjak, M., Wieczorek, P., Kafarski, P. and Lejczak, B. (1988). J.Membr. Sci., 37: 287. 366 Woo, I.S. and Kang, A.S. (1988). Hwahak Konghak, 26 (4): 435. 367 Kafarski, P., Skrzypinski, W., Bryjak, M., Plucinski, P. and Wieczorek, P. (1988). Pept. Chem. Date, 717. 368 Rebek, J., Askew, B., Nemeth, D. and Parris, K. (1987). J. Am. Chem. Soc., 109, 8: 2432. 369 Scrimin, P., Tonellato, U. and Zanta, N. (1988). Tetrahedron Letters, 29 (39): 4967. 370 Baird, R., Reed, D. and Bunge, A., (1986). NATO ASI, Ser. E, 107: 585. 371 Audunsson, G. (1986). Anal.Chem., 58: 2714. 372 Audunsson, G. (1988). Anal.Chem., 60 (13): 1340. 373 Shinbo, T., Nishimura, K., Yamaguchi, T., Sugiura, M. (1986). J. Chem. Soc., Chem. Commun., 350. 374 Yagodin, G., Yurtov, E. and Gusseva, T. (1987). Vopr. Med. Khim., 33: 66. 375 Yagodin, G., Ivakhno, S., Levkin, A. and Solov'ev, S. (1983). Kinetics of Membrane Extraction of Copper. Procs. All Union Conf. Extract., Riga, p. 98. 376 Chiang, C. and Fuller, G., Frankenfeld, J. and Rhodes, C. (1978). J. Pharm. Sci., 67: 63. 377 Panaggio, A. and Rhodes, C. (1984). Drug Dev. Ind. Pharm., 10: 637. 378 Majumdar, A. and Stroeve, P. (1986). J. Membr. Sci., 26: 329. 379 Davis, S. (1981). Chem. Ind., 3, 683. 380 Maugh, T. (1976). Science, 193: 134. 381 Nughnoi, P., Yano, T., Nishio, N. and Nagai, S. (1987). J. Ferment. Technol., 65, 3: 301. 382 Del Cerro, C. and Boey, D. (1988). Chem. Ind., 21: 681. 383 Marchese, J., Lopez, J. and Quinn J. (1989). J. Chem. Techn. Biotechnol., 46: 149. 384 Sugiura, M. and Yamaguchi, T. (1984). Sep. Sci. Technol., 19: 623. 385 Voelkel, W., Bosse, J., Poppe, W., Halwachs, W. and Schuegerl, K. (1984). J. Membr. Sci., 30: 55. 386 Asher, W., Bovee, K., Frankenfeld, J., Hamilton, R. and Lee, H. (1975). Kidney Int., 3: 409. 387 Asher, W., Vogler, T., Bovee, K., Holtzapple, P. and Hamilton, R. (1977). Trans. Am. Soc. Artif. Internal Organs, 23: 673. 346 347 348 349 350
350
7 - LIQUIDMEMBRANES(LIQUIDPERTRACTION)
388 Asher, W., Bovee, K., Vogler, T., Hamilton, R., and Holtzapple, P. (1979). Clin. Nephrology, 11: 92. 389 Trouve, G., Jore, D., Duranel, C. and Renon, H. (1982). Innov. Techn. Biol. Med., 3: 635. 390 Schuegefl, K. and Scheper, T. (1988). Biotransformation in Enzyme Liquid Membrane Reactors. Chem. and Biotechnol. Biol. Act. Nat. Products, Proc. 4th Int. Conf., Budapest, 1987, p. 133. 391 Makryaleas, K., Scheper, T., Schuegerl, K. and Kula, M.R. (1985). Chem. Ing. Tech., 57, 4: 362. 392 Barenschee, T., Dullau, R., Meyer, E.R., Scheper, T., Schuegerl, K., Hustedt, H. and Schuette, H. (1989). Chem. Ing. Techn., 61, 5: 426. 393 Yu, J., Wang, S., Ma, N. and Jiang, C. (1987). Desalination, 62: 315. 394 Marr, R. and Draxler, J. (1988). Chem. Ing. Techn., 60: 8. 395 Ivakhno, S., Gusev, V., Kadasov, D. and Rogatinski, A. (1989). Khim. Tekhnol., Kiev, 57. 396 Schlosser, S. and Kossaczky, E. (1980). J. Membr. Sci., 6: 83. 397 Rautenbach, R., Albrecht, R. and Machhammer, O. (1981). Maschinen-markt, Wuerzburg 87, 78: 1610. 398 Bouvier, A. and Marr, R. (1981). Metal Ion Separation with the Help of Liquid Membrane. Procs. CHISA'81, Czechslovakia. 399 Li, N.N., Cahn, R., Naden, D. and Lai, R. (1983). Hydrometallurgy, 9: 277. 400 Liu, Y., Su, R., Zhang, Y., Zhang, G., Tao, Z., Tong, P. and Zhang, X. (1983). M0 Fenli Kexue Yu Jishu, 3:37. 401 Chang, C., Tai, J., Hoh, Y. and Wang, W. (1984). J. Chim. Inst. Chem. Eng., 15:151. 402 Ge, D. and Drioli, E. (1983). Mo Fenli Kexue Yu Jishi, 3: 1. 403 Takahashi, K. Othsubo, F. and Takeuchi, H. (1983). Kagaku Kogaku Ronbunshu, 9: 409. 404 Matsumoto, M., Kondo, K. and Nakashio, F. (1983). Extraction of Copper with Liquid Surfactant Membranes Containing Chelating Reagent in a Stirred Tank. Proc. Solv. Extr. Conf., Denver. 405 Bunge, A., Reed, D. and Noble, R. (1988). Encapsulated-Phase Leakage during Emulsion Liquid Membrane Extraction. Proc. ISEC'88, Moscow, 3, p. 57. 406 Sakai, N., Chida, T. and Simoiizaki, J. (1986).Nippon Kogyo Kaishi, 102: 97. 407 Fujinawa, K. Komatsu, T., Hozawa, M., Imashi, N. and Ino, H. (1984). Kagaku Kogaku Ronbunshu, 10: 75. 408 Kim, B. (1984). J. Membr. Sci., 21: 5. 409 Marr, R., Bart, H. and Bouvier, A. (1981). Ger. Chem. Eng., 4: 209. 410 Marr, R. and Kopp, A. (1982). Intern. Chem. Eng., 22: 44. 411 Boyadzhiev, L. (1981). Carrier Mediated Extraction or Liquid Membrane. Int. Symp. Hydrometallurgy'81, Manchester, UK. 412 Lorbach, D., Bart, H. and Marr, R. (1986). Ger. Chem.Eng., 9: 321. 413 Sharma, A., Goswami, A. and Krishna, R. (1989). J. Membr. Sc/., 40: 329. 414 Hung, T., Chen, C. and Lee, C. (1989). J. Chin. Inst. Chem. Eng., 20: 319. 415 Ulbrich, M., Marr, R. and Draxler, J. (1991). J. Membr. Sc/., 59:189. 416 Izatt, R., Roper, D., Bruening, R. and Lamb, J. (1989). J. Membr. Sci., 45: 73. 417 Yamaguchi, K., Kuboniwa, H., Murakami, N., Hirao, A., Nakahama, S. and Yamazaki, N. (1989). Bull. Chem. Soc. Jpn., 62:1097. 418 Lamb, J., Bruening, R., Linsley, D., Smith, C. and Izatt R. (1990). Sep. Sci. Technol., 25:13. 419 Wakita, R., Matsumoto, M., Nakatsuji, Y. and Okahara, M. (1991). J. Membr. Sc/., 57: 297. 420 Brown, P., HaUman, J., Whaley, L., Desai, D., Pugia, M. and Bartsch, R. (1991). J. Membr. Sci., 56: 195.
7-- LIQUIDMEMBRANES0aQUIDI'~TRACrION)
351
421 Wienk, M., Stolwijk, T., Sudholter, E. and Reinhoudt D. (1990). J. Am. Chem. Soc., 112: 797. 422 Meifang, J. and Yuangi Z. (1990). Study on Extraction of Gold and Cyanide Solution by Liquid Membrane. Proc. Int. Congr. ICOM'90, Chicago, USA, pp. 676-678. 423 Sirlin, C., Burgard, M., Leroy, M. and Prevost, N. (1990). J. Membr. Sc/., 54: 299. 424 Chiarizia, R. and Horwitz, E. (1990). Solv. Extr. Ion Exch., 8: 65. 425 Chiarizia, R., Horwitz, E., Rickert, P. and Hodgson, K. (1990). Sep. Sci. Technol., 25:1571. 426 Hirato, T., Kishigami, I., Awakura, Y. and Majima, H. (1991). Hydrometallurgy, 26:19. 427 Zhu, C. and Izatt, R. (1990). J. Membr. Sci., 50: 319. 428 Nakamura, S., Ohashi, S. and Akiba, K. (1992). Sep. Sci.Technol., 27: 863. 429 Kardiwarenko, L., Bagreev, V. and Zolotov, Y. (1990).Zh. Neorg. Khim., 35: 2160. 430 Wodzki, R., Wyszynska, A. and Narebska, A. (1990). Sep. Sci. Technol., 25:1175. 431 Matsumoto, M., Matsuo, K., Kondo, K. and Nakashio, F. (1990). J. Membr. Sci., 53: 287. 432 Kataoka, T., Nishiki, T., Kimura, S. and Tomioka, Y. (1989). J. Membr. Sc/., 46: 67. 433 Matsumoto, M., Ema, K., Kondo, K. and Nakashio, F. (1990). J. Chem. Eng. Jpn, 23: 402. 434 Takigawa, D. (1992). Sep. Sci. Technol., 27: 325. 435 Zhong, Y., Siya, L., Ying, C. and Bojun, L. (1990). Treatment of the Wastewater Containing High Concentration of Cr(VI) Using Liquid Membrane. Proc. Int. Congr. ICOM'90, Chicago, USA, pp. 718-720. 436 Salazar, E., Ortiz, M. and Irabien, J. (1990). Inst. Chem. Eng.Symp. Ser., 199: 279. 437 Chiarizia, R., Horwitz, E. and Rickert P. (1990). Sep. Sci.Technol., 25:1571. 438 Mori, Y., Hibino, S., Uemae, H., Tanigawa, M. and Eguchi, W. (1991). Kagaku Kogaku Ronbunshu, 17: 1104. 439 Ikeda, I., Yamazaki, H., Konishi, T. and Okahara, M. (1989). J. Membr. Sc/., 46: 113. 440 Ikeda, I., Yamazaki, H., Kurosawa, H. and Okahara, M. (1991). Nippon Kagaku Kaishi, 5: 612. 441 Drioli, E., Loicano, O., Molinari, R. and Pantano, G. (1989). Chim. Oggi, 7: 25. 442 Kaprantchik, V., Proyaev, V., Kopirin, A. and Slatennikov, Y. (1989). Radiokhimia, 6:100. 443 Izatt, R., Bruening, R., Bruening, M., Lindh, G. and Christensen, J. (1989). Anal. Chem., 61: 1140. 444 Kardiwarenko, L., Shkinev, V., Spivakov, B., Bagreev, V., Yurtov, E. and Koroleva, M., Zh. Inorg. Chem. (Russ), 36: 1887. 445 Takahashi, S. (1991). Sep. Sci. Technol., 26:1495. 446 Sato Y., Kondo K. and Nakashio F. (1990). J. Chem. Eng. Jpn., 23: 23. 447 Teramoto, M., Tohno, N., Ohnishi, N. and Matsuyama, H. (1989). Sep. Sci. Technol., 24: 981. 448 Saito, T. (1990). Sep. Sci. Technol., 25: 581. 449 Goto, M., Yamamoto, H., Kondo, K. and Nakashio, F. (1991). J. Membr. Sc/., 57:161. 450 Shiau, C. (1991). Sep. Sci. Technol., 26:1519. 451 Yang, C. and Peng, X. (1990). Membr. Sci. Technol., 11:102. 452 Matsuyama, H., Boku, J. and Teramoto, M. (1990). Water Treatment, 5: 237. 453 Li, J. and Yang, X. (1990). Youse Jinshu, 42: 55. 454 Huang, T. and Tsai, T. (1991). J. Chem. Eng. Jpn., 24:126. 455 Bulavchenko, A. and Torgov, V. (1991). Kolhn'dn. Zh. (Russ), 53:1017. 456 Lee, C. and Chan, C. (1990). Ind. Eng. Chem. Res., 29: 96. 457 Pfeiffer, R. and Bunge, A. (1990). Breakage and Swelling in Emulsion Liquid Membrane. Procs. Interrt Congr. ICOM'90, Chicago, USA, pp. 703--705. 458 Urtiaga, A., Ortiz, M. and Irabien, A. (1990). Inst. Chem. Eng. Symp. Ser., 199: 35. 459 Wang, C. and Bunge, A. (1990). J. Membr. Sc/., 53: 71.
352
7 - LIQUIDMEMBRANES(LIQUIDPERTRACTION)
460 Wu, B. and Wu, Q. (1990). Membr. Sci. Technol., 10:16. 461 Uramoto, H., Kawabata, N. and Teramoto, M. (1990). J. Membr. Sci., 62: 219. 462 Urtiaga, A., Ortiz, M., Inmaculada, S., Emesto, I. and Angel, J. (1992). Ind. Eng. Chem. Res., 31: 877. 463 Dai, Y., Wang, X. and Yang, Y. (1992). Membr. Sci. Technol., 12: 37. 464 Bart, H., Ramaseder, E., Haselgruebler, T. and Marr R. (1992). Hydrometallurgy, 28: 253. 465 Boyadzhiev, L. (1990). Sep. Sci. Technol., 25: 187. 466 Jin, M., Lazarova, Z. and Boyadzhiev L. (1991). Water Treatment, 6: 219. 467 Lazarova, Z. (1991). Chem. Techn., 9: 333. 468 Boyadzhiev, L. and Alexandrova, S. (1992). Sep. Sci.Technol., 27:1307. 469 Lazarova, Z. (1993). Solv. Extr. Ion Exch., 11. 470 Lazarova, Z., Sapundshiev, T. and Boyadzhiev, L. (1992). Sep. Sci. Technol., 27: 493. 471 Lazarova, Z. and Boyadzhiev, L. (1992). Intern. J. Environ. Anal. Chem., 46: 233. 472 Lazarova, Z. and Boyadzhiev, L. (1992). Talanta, 39: 931. 473 Boyadzhiev, L. and Atanasova, I. (1991). Biotechnol. Bioeng., 38: 1059. 474 Gadekar, P., Mukkolath, A. and Tiwari, K. (1991). Sep. Sci. Technol., 27: 427. 475 Yang, P., Shen, L. and Feng, H. (1992). Membr. Sci. Technol., 12: 39. 476 Nuchnoi, P., Nashio, N. and Nagai, S. (1989). J. Ferment. Bioeng., 67: 195. 477 Reisinger, H., Marr, R. and Preitsehopf, W. (1990). Liquid Membrane Permeation in the Field of Biotechnology. Procs. Intern. Congr. ICOM'90, Chicago, pp. 715-716. 478 Chaudhuri, J. and Pyle, D. (1992). Chem. Eng. Sci., 47: 41. 479 Hano T., Matsumoto M., Ohtake T., Sasaki K., Hori F. and Kawano Y. (1992). Application of Liquid Membrane Technique to the Recovery of Fermented Organic Acid. Solvent Extraction 1990 (T. Sekune, ed.), Elsevier Sci. Publ., pp. 1887-1892. 480 Basu, R. and Sirkar, K. (1990). Citric Acid Extraction with Microporous Hollow Fibers. Procs. Int. Congr. on Membrane and Membrane Processes ICOM'90, Chicago, USA, 1, pp. 641-643. 481 Frisen, D., Babcock, W., Brose, D. and Chambers, A. (1991). J. Membr. ScL, 56: 127. 482 Sirman, T., Pyle, D. and Grandison, A. (1990). Separation in Biotechnology, 2: 245. 483 Wang, C. and Bunge, A. (1990). J. Membr. Sci., 53: 105. 484 Bryjak, M., Wieczorek, P., Kafarski, P. and Lejczak, B. (1991). J. Membr. Sci., 56: 167. 485 Teramoto, M., Yamashiro, T., Inoue, A., Yamamoto, A., Matsuyama, H. and Miyake, Y. (1991). J. Membr. Sci., 58: 11. 486 Deblay, F., Delepine, S., Minier, M. and Renon, H. (1991). Sep. ScL Technol., 26: 97. 487 Luka, C., Mitihac, L. and Constantinescu, T. (1990). Rev. Roum. Chim., 35: 467. 488 Hano, T., Ohtake, T., Matsumoto, M., Kitayama, D., Hori, F. and Nakashio, F. (1990). Separation and Enrichment of Amino Acids with Liquid Surfactant Membrane. Solvent Extraction 1990 (T. Sekune, ed.), Elsevier Sci. Publ., pp. 1881-1886. 489 Srivastava, R., Raju, D., Singh, V. and Upadhyay, S. (1991). J. Membr. Sci., 58: 211. 490 Paradkar, V. and Dordick, J. (1991). Biotechnol. Prog., 7: 330. 491 Sorenson, B. and Callahan, R. (1990). Penicillin Separations with Contained Liquid Membranes. Proc. Int. Congr. ICOM'90, Chicago, USA, pp. 695-696. 492 Scheper, T. (1990). Enzyme immobilization in liquid surfactant membrane emulsions. Adv. Drug Delivery Revs., 4: 209. 493 Hano, T., Othake, T., Matsumoto, M., Ogawa, S. and Hori, F. (1990). J. Chem. Eng. Jpn., 23: 772. 494 Barenshee, T., Dullau, R., Meyer, E., Scheper, T., Schuegerl, K., Hustedt, H. and Schuette, H. (1989). Chem. Ing. Techn., 61: 426.
Membrane Separations Technology. Principles and Applications Edited by R.D. Noble and S.A. Stern 9 1995, Elsevier Science B.V. All rights reserved
Chapter 8
Membrane bioseparations Stephen L. Matson Arete Technologies Inc., 15 Withlngton Lane, Harvard, MA 01451, USA
8.1 INTRODUCTION
8.1.1 Historical Perspectives As recently as a decade ago, the potential of membrane technology "was frequently underestimated by biochemical engineers dealing with conventional fermentation processes. Membrane separations--- in particular, microfiltration (MF), ultrafiltration (UF), and reverse osmosis (RO)-- played only modest roles in recovering and purifying the products of classical fermentation processes. Porous MF and UF membranes found limited application in the separation and/or concentration of particulate, colloidal, and macromolecular species, and reverse osmosis was only rarely employed in downstream processing. In truth, the great majority of bioseparation tasks were and still are accomplished by a small group of more conventional "workhorse" unit operations; these include centrifugation and vacuum filtration for solid/liquid separations, chromatography for protein recovery and purification, and solvent extraction for antibiotic purification [1-5]. Prior to about 1980, relatively few practicing biochemical engineers had enjoyed much successful experience with membranes. More often than not, prior operating history with many membrane bioseparatior~s could be characterized as either nonexistent or unsatisfactory. At first blush, this limited penetration of the fermentation process market by membranes seems surprising, given that certain inherent characteristics of membranes would appear to recommend them for many bioprocessing tasks: gentleness (e.g., avoidance of chemical separating agents and phase changes); -
354
8 -- MEMBRANE BIOSEPARATIONS
- low-temperature operating capability; - energy-efficiency (e.g., in dewatering); - ability to be isolated and contained (i.e., closed-system operation); - scalability; and - simplicity. However, several factors made for a relatively poor early showing of membranes in bioseparation applications: Membrane suppliers had relatively little pertinent experience with the particulars of downstream bioprocessing. Flux decline and fouling-- problems encountered to some extent in most membrane applications - - proved particularly severe with bioseparations. - Many membranes pressed into service in this field had initially been developed for other purposes and were not optimized for bioprocess applications. - A lack of membrane industry standards and discipline (e.g., regarding the specification and significance of molecular-weight cut-offs) caused much user confusion and disappointment. Bioprocess engineers were loathe to risk loss of high-value products with as-yet-unproven membrane process technology, especially when existing bioseparation needs were being served more or less adequately if inelegantly by conventional technologies. Happily, recent developments on several fronts have done much to alter this state of affairs. At the very least, membrane technology is today regarded as providing credible competition for more conventional bioseparation unit operations. While some understandable skepticism fingers on in the industry, membranes are increasingly becoming the technology of choice in certain downstream bioprocessing applications. -
-
-
8.1.2 Current Status
The improved circumstances of membrane bioseparations result from a confluence of several factors. For one thing, much valuable operating experience has been gained within the past two decades by consumers and suppliers alike of membrane technology and equipment. Moreover, along with an appreciation of the market potential has come the tailoring of existing membranes and membrane processes - - as well as the invention of new ones ~ capable of better addressing specific market needs. Equally important to the emergence of membranes as viable bioseparation technology, however, has been the sea change that has taken place in the nature of downstream bioprocessing itself. Modern biotechnology has created certain particularly critical, value-added separations--e.g., the recovery and purifica-
8 - - M E M B R A N E BIOSEPARATIONS
355
fion of therapeutic proteins produced by via recombinant techniques - - for which membranes are well suited. As of early 1993, seventeen biotechnologyderived drugs and vaccines had been approved by the Food and Drug Administration [6]. In 1992, the sales of these drugs by ten so-called "biotedmology" companies alone exceeded two billion dollars [7] --excluding sales by established pharmaceutical companies of such products as Eli LiUy's recombinant human insulin [8]. Looking ahead, the number of biopharmaceuticals in various stages of regulatory review or nearing submission to the FDA is certainly an order of magnitude larger than those already approved and on the market. Numerous membrane bioseparation market surveys exist, but their conclusions are generally too unreliable and/or short-lived to warrant further comment here. Suffice it to say that ample economic incentive now exists to induce membrane technologists to address the scale-up challenges presented by the modem biotechnology industry.
8.1.3 Chapter Organization An appreciation of the special considerations and constraints involved in the recovery and purification of biologically-derived products is essential to anyone who would contemplate applying membranes in this arena. It is thus inevitable that this chapter begins with some rather tutorial material dealing with the principal bioproduction methods and their commercial products. Beyond this, however, a discussion of membrane bioseparafions could conceivably follow a number of possible lines, as suggested by the organizational framework in Table 8.1. This chapter is organized primarily according to the particular type of component being separated. Fortunately, there exists a reasonably good correspondence between the nature of this bioproduct, the unit operation required to separate and/or purify it, and the type of membrane and membrane process best suited to accomplishing this task. This chapter attempts to treat each of these aspects of membrane bioseparations in parallel, in a manner that is complementary to the somewhat different organizational approaches taken by other reviewers [9-14]. 8.2 BIOTECHNOLOGY A N D BIOSEPARATIONS: A N OVERVIEW
Biotechnology can be defined as the technological exploitation or manipulation of biological systems for the production of a useful economic or therapeutic result [15]. This rather broad defimtion encompasses activities as diverse as the extraction of valuable components from plant and animal sources (even human plasma), the biomedical application of membrane separations (e.g., hemodialysis), and the production of many foods and beverages. However, our focus here is on the manufacture of biologically-derived compounds under the con-
356
a -- MEMBRANEBIOSEPARATIONS
TABLE 8.1 Dimensions of membrane bioseparation technology Type of bioprocess/bioreactor
Microbial fermentation Cell culture Animal (e.g., mammalian, insect) Plant Extraction from native sources Recovery from plants and animals Plasma processing Biocatalysis (e.g., enzyme bioreactors)
Nature of bioproduct being separated
Particulate Intact cells Intracellular components (e.g., inclusion bodies) Protein precipitates Macromolecular Intracellular proteins Extracellular proteins DNA Low-molecular-weight solutes Primary metabolites (e.g., citric acid, amino adds, vitamins) Secondary metabolites (e.g., antibiotics) Contaminants (e.g., virus)
Unit operation
Bioreactor support Media pretreatment (e.g., sterilization) Productivity enhancement (e.g., cell recycle) Solid/liquid separation Cell harvesting Clarification Protein recovery and purification Microsolute recovery and concentration Contaminant removal Product finishing and formulation
Nature of membrane separation Microfiltration process Ultrafiltration Reverse Osmosis Other
trolled c o n d i t i o n s of biochemical processes, w h e r e a p r o d u c t i o n bioreactor of s o m e sort is f o l l o w e d b y a s e p a r a t i o n train d e s i g n e d to recover a n d p u r i f y a c o m p o n e n t p r o d u c e d therein.
8 - - M E M B R A N E BIOSEPARATIONS
357
8.2.1 Representative Bioproducts The size and complexity of biologically produced materials runs the gamut from simple organic solutes (e.g., ethanol) at one extreme to macromolecular, colloidal, and particulate species (e.g., proteins and whole cells) at the other. Each category of bioproduct demands its own type of separation technology.
8.2.1.1 Low-Molecular-Weight Products Low-molecular-weight organic compounds, referred to here as "microsolutes", are derived principally from conventional fermentation processes. Certain microsolutes like ethanol and simple organic acids (e.g., citric, acetic, and lactic) are derived from the catabolic processes of cellular metabolism that break down energy-rich nutrients into simpler components; these products tend to be rather inexpensive. Still other compounds result from biosynthetic rather than degradative bioprocesses. Among these, the amino acids and vitamins are examples of so-called primary metabolites, characterized by modest unit values of about ten dollars per kilogram or less. More complex and higher value secondary metabolites like antibiotics command prices of up to several dollars per gram [1,2,4,5]. Table 8.2 shows a representative few of the 200 or so fermentation-derived microsolutes of commercial significance. TABLE8.2 Representative low-molecular-weight fermentation products Amino acids
glutamic acid lysine
Organic acids
citric acid acetic acid lactic acid gluconic acid
Ketones and alcohols
acetone butanol ethanol
Vitamins Antibiotics
Other secondary metabolites
penicillins cephalosporins cyclosporin thienamycin
358
8 u MEMBRANEBIOSEPARATIONS
8.2.1.2 Macromolecular Products
Table 8.3 illustrates the great variety of macromolecular products that can be produced by microbial fermentation and/or mammalian cell culture. Unit values vary significantly but are generally high compared to those of their lower-molecular-weight counterparts discussed above. For instance, the production cost of a purified therapeutic monoclonal antibody may have a value of the order of $1,000/g even before being packaged in final dosage form. Yet another calibration point is provided by recombinant tissue-type plasminogen activator (t-PA), which is administered at a cost of approximately $2000 per 100 mg dose or $20,000/g. TABLE 8.3 Classes of macromolecular products from fermentation and cell culture Therapeutic proteins
enzymes monoclonal antibodies interleukins interferons recombinant plasmaproteins vaccines
Peptide hormones
recombinant human insulin bovine and human growth hormones
Diagnosticenzymes and antibodies Polysaccharidesand biopolymers
xanthan gums dextrans polyhydroxybutyrate
Industrialenzymes
proteases amylases glucose isomerase
Clearly, we associate the "biotechnology revolution" of the past two decades principally with the production of therapeutic proteins and peptides by recombinant DNA and hybridoma technologies. It is indisputable that biotechnology has become a cost-effective technology for the creation of new therapeutic drugs and novel treatment modalities. Human insulin (Eli Lilly), human growth hormone (Genentech), alpha interferon (Biogen/Schering Plough), and hepatitis B vaccine (Chiron/Merck) were the first genetically engineered pharmaceuticals to reach the market in the 1980s [8,16]. Table 8.4 summarizes
8 --- M E M B R A N E
359
BIOSEPARATIONS
TABLE8.4 Representative products from mammalian cell culture and their therapeutic indications (from Ref. [16]with permission)] Product
Disease/condition
Lymphokines Erythropoietin Recombinant insulin Beta cells Urokinase Granulocyte stimulating factor Tissue plasminogen activator Transfer factor Protein C Epidermal growth factor Factor VIII Human growth hormone Orthoclone Alpha interferon
Viral infections Anemia, hemodialysis Diabetics, insulin dependent Diabetics Blood clots Wounds, severe Heart attacks, survive to hospital Multiple sclerosis Hip surgery, protein C deficiency Bums Hemophilia Pituitary deficiency Kidney transplant rejection Hairy-cell leukemia
several other biotechnology-derived therapeutic proteins already on the market or pending final FDA approval, along with their clinical indications.
8.2.1.3 Cell Biomass In the interest of completeness, it should be noted that occasionally it is the cell biomass in its entirety-- as distinct from one of its components ~ that constitutes the product of commercial value. Representative products range from such ancient commodities as bakers' and brewers' yeasts to decidedly non-traditional products like single cell protein. Still other examples include the production of intact microorganisms for use in whole-cell-catalyzed bioconversions. The economics of producing cell biomass are typically dominated either by the cost of feedstock or the cost of its bioconversion, rather than by the cost of subsequent product recovery [17]. These latter operations can be quite simple, amounting in some instances to little more than filtration, washing, and drying of the cell biomass.
8.2.2 Principal Bioproduction Systems Most bioproduction processes fall into either of two categories: fermentation or mammalian cell culture. Production technologies based on extraction of
8 -- MEMBRANE BIOSEPARATIONS
360
products from sources such as plant and animal tissues are not specifically discussed in this chapter, although many of the bioseparation principles and practices described below will be applicable. 8.2.2.1 Fermentation
Figure 8.1 shows a block diagram of a classical fermentation process comprised of the following process steps [1,2,4,5,18]: steam sterilization of the fermenter vessel and materials charged to it; feedstock pretreatment (e.g., solubilization, screening, etc.); addition of essential nutrients; adjustment of temperature and pH; heating a n d / o r filtration of process air to combat contaminating microorganisms and phage; - growth of an inoculum from a seed culture; - inoculation of the fermenter; and, finally, the fermentation itself. The types of microorganisms most frequently used in fermentations (i.e., bacteria, yeast, and fungi) are typically hardy, shear-resistant (with the exception of mycelial cultures), and quite demanding of oxygen--- at least as compared to the types of mammalian cells more commonly exploited in cell culture operations (see below). Fermenters take several physical configurations, all of which are designed to vigorously agitate and aerate their contents, to facilitate maintenance of aseptic operation, and to provide close temperature control. Most fermenters are sim-
-
-
-
-
-
Feedstock
-•
Pretrea tment_~ Control
Nutrients, Acid/Base
[Steriliz
~
Inoculum',
ation _J
Energy
FER MoERNTER ! REACTOR
t
[F,;ir,,,onl
Energy
PRODUCT RECOVERY
_•p
PRODUCT URIFICATION ~ P r o d u c t
Waste
Air
Fig. 8.1. Classical fermentationprocess diagram.
Waste
8 --
MEMBRANE
BIOSEPARATIONS
361
ply baffled and sparged stirred-tank reactors fitted with impellers, although very large airlift fermenters have been operated with good results within the past decade [19-21]. While continuous fermentation holds considerable promise and has recently met with some success, the vast majority of fermentations are still conducted batchwise with cultivation times ranging from a few days to a week or longer. Whereas the comparatively low-value microsolutes of Table 8.2 are invariably made by microbial fermentation (at least when manufactured by biochemical routes at all), the comparatively high-value macromolecular products such as the therapeutic proteins of Tables 8.3 and 8.4 can be and are produced commercially by more than one m e t h o d - - - i.e., by microbial fermentation, animal cell culture, or both techniques. That is, the choice of production process depends not so much on the identity of the desired product as it does on the nature of the biological host that produces it. For instance, recombinant Factor VIII:c, the blood-clotting protein that is lacking in hemophiliacs, is currently being produced competitively by two very different production technologies. One company relies on microbial fermentation, while a competitor employs mammalian cell culture. The same can be said of tissue plasminogen activator or t-PA. The various advantages and disadvantages of animal cell culture vis-a-vis microbial fermentation are examined in Section 8.2.2.2 below. Fermentation media are generally complex, as illustrated by the list of typical media ingredients provided in Table 8.5, and fermentation product mixtures are necessarily even more complex. Table 8.6 summarizes the types of parficuTABLE8.5 Typical fermentation media ingredients (adapted from Ref. [39]) Carbon Source
Glucose Starch or flour Vegetable oils Molasses Lactose Sucrose
Nitrogen Source
Ammonium ion High protein sources (soy flour, corn gluten) Specialized sources (cornsteep liquor, yeast extract)
Phosphorus
Inorganic/organic phosphates
Calcium (CaCO3) Magnesium (MgSO4) Potassium Trace metals
362
8-- MEMBRANEBIOSEPARATIONS
TABLE 8.6 Fermentation broth components Class
Examples
Molecular weight
Sizerange (nm)
Particulates
Suspended solids Colloidal materials Yeasts Bacterial cells Viruses Proteins and polysaccharides Enzymes Common antibiotics Mono- and di-saccharides Organic acids Inorganic ions Water
104-106
10,0(X~I,000,000 100-1,000 1,(XXF-10,000 500-3,000 30-300 2-10
104-10s 3(X)-1000 2(X)--4(X) 100-500 10-100 18
2-5 0.6-1.2 0.-1.0 0.4--0.8 0.2--0.4 0.2
Microorganisms
Macromolecular solutes
Microsolutes
late, colloidal, macromolecular, and low-molecular-weight components that are c o m m o n l y found in unclarified or "whole" fermentation broths, also referred to as fermentation beers. Each of these general categories of materials encompasses a large n u m b e r of individual species. For example, a simple bacterium such as E. coli can contain of the order of 5000 distinct proteins. As discussed further in Section 8.2.3 below, the complexity and considerable size range of materials present in unclarified fermentation broths present quite a d o w n s t r e a m processing challenge, particularly for membrane-based processes. Other factors contributing to the difficulty of handling fermentation beers are their high solids contents and sometimes high viscosities (especially w h e n mycelial cultures derived from molds and fungi are used). Given that even the plugging of valves and steam traps can be problematic in fermentation operations, it comes as no surprise that relatively fouling-prone membranes and m e m b r a n e e q u i p m e n t face particular problems in this arena. A q u e o u s fermentation broths are also typically fairly dilute (see Table 8.7). In the most favorable cases (e.g., the fermentation of simple organics like ethanol and citric acid), concentrations can approach values of moles per liter. H o w e v e r , the titer of the antibiotic penicillin G is typically only 30-40 m M --- a level achieved only after some four decades of strain i m p r o v e m e n t boosted penicillin G concentrations by more than a hundred-fold [5]. Other important antibiotics are less than one-tenth as concentrated in their fermentation broths. Finally, we note that vitamin B12 is typically present in the fermenter effluent at a concentration of just 20 p p m by weight or so (i.e., about 15 ~M). Many
8-- MEMBRANEBIOSEPARATIONS
363
TABLE8.7 Component concentrationsin fermentationbroths Fermentationproduct
Concentration in broth (%)
Ethanol Organic acids SCP biomass Enzymes Penicillin G Lipids Acetone/butanol/ethanol Riboflavin Erythromycin Vitamin B12
7-12 4-10 3-5 2-5 3-4 1-3 1.8-2 1-1.5 0.4-0.6 0.002
therapeutic proteins can be produced by dilute mammalian-cell suspension culture at concentration levels this high and higher. Given the attention showered upon the so-called "new biotechnology" in the popular, scientific, and financial press of recent years, it might be tempting to dismiss classical fermentation processes as being rather archaic. However, this would be a serious mistake. Some of the first genetically engineered therapeutic proteins to reach the market were produced by microbial hosts harnessed in classical fermentation processes; examples include human growth hormone, hepatitis B vaccine, and t-PA. Furthermore, the past decade has witnessed a number of impressive advances in fermentation technology, including the operation of sizable airlift fermenters, large-scale continuous culture, and improved techniques for fermenter analysis and control. Fermentation remains a cost-effective technology, particularly for production of relatively simple biomolecules. It will continue to hold an important place in bioprocessing. 8.2.2.2 Cell Culture
Having said this, many recombinm~t therapeutic proteins---especially the larger and more complex o n e s - - are produced by mammalian cell culOare rather than fermentation despite the fact that fermentation is the more established and less expensive bioproducfion technology. Bioreactor productivity explains much of this, with two factors operating to make the volumetric productivity of fermenters higher than that of cell culture reactors. In the fi~t place, microorganisms like E. coli exhibit doubling times of the order of tens of minutes rather than the tens of hours more characteristic of animal cells in culture. Additionally, mam-
364
8 ~ MEMBRANE BIOSEPARATIONS
malian cells in suspension culture are generally much more dilute, typically growing only to cell densities that are lower by one to three orders of magnitude than those characteristic of their microbial counterparts in fermentation. Notwithstanding these con~siderable advantages of fermentation, the greater versatility of mammalian cells makes them preferred hosts for the production of many recombinant proteins. Our focus here is on mammalian cell culture, although other types of animal cells, e.g., insect cells, have also been exploited in bioproduction. On the one hand, mammalian cells are generally capable of secreting their protein products into the media, in contrast to the situation with simpler cells like bacteria that often retain high levels of recombinant proteins within their cells in the form of insoluble protein precipitates or "inclusion bodies". The formation of inclusion bodies in microbial hosts necessitates additional bioprocessing steps---e.g., cell disruption, resolubilization, and protein refolding--- that cannot always be accomplished successfully. In contrast, mammalian cells are not only more adept at correctly folding and processing recombinant proteins, but they also typically possess the machinery required to transport those proteins out of the cell. Finally, the therapeutic activity of many an important glycoprotein depends critically on the association of particular carbohydrate sequences with that protein. Mammalian cells are capable of effecting such post-translational protein modifications as glycosylation and proper disulfide bond formation. Simple flasks and roller bottles are commonly used for laboratory-scale cell culture; indeed, roller bottles even suffice for the limited-scale production of certain vaccines. Viviculture, i.e., the use of whole animals as bioreactors, is frequently employed for the small-scale production of diagnostic monoclonal antibodies. In this technique, hybridoma cells are cultured within and ultimately harvested from the ascites cavity of the mouse. Technology is just now emerging to produce recombinant proteins in quantity with the help of transgenic animals capable of expressing desired proteins in the milk of such species as cows, sheep, pigs, and goats [22-24]. At larger production scales, equipment for the suspension culture of mammalian cells is strikingly similar to that used in fermentation. Stirred-tank and air-lift bioreactors are employed that range in size from a few hundred liters to a maximum capacity of about 10,000 L [20,21,25,26]. Indeed, it is not uncommon for conventional fermenters to be modified and pressed into service as mammalian cell bioreactors. Since mammalian cells exhibit greater sensitivity to shear and since they grow much more slowly than microorganisms, these modifications generally involve reducing the intensity of mixing and the rate of oxygen supply to the culture. Anchorage-dependent cells are typically grown in immobilized-culture systems that are based on microcarriers or microcapsules suspended in stirred-tank or fluidized-bed reactors, although packed-column and membrane bioreactors are also used to some extent in culturing
8 - M E M B R A N E BIOSEPARATIONS
365
anchorage-dependent cells. The cell types used in cell culture operations can be termed either "normal" or "permanent" depending on their source and lifespan. The former, generally used in manufacturing human vaccines, have finite lifetimes and complex nutritional requirements, and they are anchorage dependent. In short, they are difficult to work with in large-scale bioprocesses. On the other hand, the so-called "permanent" cell l i n e s - - - e . g . , newborn hamster kidney (BHK), Chinese hamster ovary (CHO), Vero, and hybridoma cells - - can divide indefinitely and are more readily grown in suspension culture. Accordingly, they constitute the "workhorse" cell lines for cell culture. Well over two hundred different animal cell lines have now been employed in hybridoma and recombinant DNA work, and each has its own particular requirements for media, growth conditions, etc. The production of therapeutic proteins from potentially tumorigenic cells obviously demands that particular care be taken to ensure substantially complete removal of such potentially dangerous contaminants as viruses and cellular DNA. Not surprisingly, the media used in mammalian cell culture are even more complex than those used in fermentation. Major components include perhaps a dozen amino acids at concentrations of =0.1-0.2 mM, several vitamins at =0.1 ~tM, inorganic salts, glucose at ---5-10 mM, antibiotics such as penicillin and streptomycin to suppress bacterial growth, and phenol red as a pH indicator. Traditionally, most cell culture media have also been supplemented with up to 10 vol.% of serum derived from the horse or calf--- e.g., fetal bovine serum. Serum is obtained by allowing freshly collected blood to clot and then removing the complex liquid that remains [27]. In addition to containing numerous low-molecular-weight components (e.g., sugars, amino acids, vitamins, and metabolites), peptide hormones, and growth factors, serum also contains plasma proteins (e.g., albumin and the gamma globulins) as well as contaminants like bacterial endotoxins introduced after blood collection. The presence of these serum proteins considerably complicates the task of purifying recombinant proteins from serum-supplemented cell culture supernatants. For that r e a s o n - - and in the interest of using better defined, more reproducible, and less expensive m e d i a - - a major dynamic in the practice of mammalian cell culture involves eliminating or at least minimizing the amount of serum employed, replacing its essential components through the use of various defined media. Table 8.8 illustrates the impact that the choice of bioreactor and amount of serum can have on the difficulty of separating and purifying an IgG immunog l o b u l i n - - in this instance, a monoclonal antibody--- from cell culture supernatant [28]. The growth of hybridoma cells in mouse ascites fluid produces the highest antibody titer, but the product is present at low protein purity by virtue of its contamination with significant amounts of other murine (i.e., mousederived) proteins; moreover, ascites culture does not scale up readily. In con-
366
8-- MEMBRANEmOSEP~ATIONS
TABLE 8.8 Typical protein concentrations and purities obtained in various cell culture systems (from ReL [53] with permission) Source
Protein (mg/ml)
Total IgG (mg/ml)
SpecificIgG (mg/ml)
Purity (%)
Ascites
20.0
6.0
6.0
30.0
Suspension culture 10% FBS1 5% FBS 1% FBS Serum-free
4.0 2.0 0.4 0.08
0.8 0.4 0.1 0.03
0.03 0.03 0.03 0.03
0.6 1.2 6.0 40.0
Hollow fiber culture 10% FBS Serum-free
6.5 5.3
5.2 5.0
5.0 5.0
75.0 95.0
1Fetal bovine serum.
trast, suspension culture is more scalable and controllable, but it typically produces much lower levels of the desired a n t i b o d y - - e . g . , ~30 mg L-1 in this instance. Moreover, at least when serum is employed, antibody purity is also rather low due to the presence of contaminating serum proteins (including other IgGs) that can be difficult to separate from the particular IgG antibody of interest. The advantage of a serum-free medium is thus readily apparent. Finally, Table 8.8 shows results obtained with an immobilized cell culture system based on entrapment and compartmentation of cells by protein-retentive hollow-fiber membranes. Relatively high antibody concentrations and purities are, in principal, attainable via such engineering approaches, which can be augmented by equally powerful biochemical techniques involving manipulation of cell growth conditions [29-31].
8.3 I M P L I C A T I O N S FOR M E M B R A N E B I O S E P A R A T I O N S
8.3.1 Feedstream Characteristics and Process Constraints
The difficult nature of fermentation broths and cell culture supernatants presents a number of challenges in the recovery and purification of the various components contained within them.
367
8 - - M E M B R . ~ I E BIOSEPARATIONS
10 3
., - - Water
10 z -
-
9"
.Elhanol Cili~ Acid MSG ..-'" .. ' . . . .
. Human Growth
^.
" --Cephalospodn ANTIBIOTICS ~ - - " ~ b o e r i l ' d c Acid ~ Genlamicin . . . . ~ _ .. ,~uo/
10' ,,.,.,. .=.. . .m. .
o) 1 0 ~
Microbial" ~ ' i ' ~
(g
E
I#1
10 z
^my,~-s "
_
Rennin"
10-= -
Activator (1987)
BULK E N ~ M E S
/
. _. ~,,c~e O=kJas(I~. / Hepati,,s e I"~i -, -ql,/Vacclne (1986)
~. .
I .~
~
RESEARCH/DIAGNOSTIC" ENZYMES
r
c .o
~-I
Proieases .;
O. t
r ._.
Tissue Plasminogen
9 I _JIONOCLONAL ~uI~~lJ~Ti~(~DIE S
~1 ~ I _ -e ],~ ~'~ ...- Glyceroplmspha! [__ . - e t ~ . . Oehydrogenase
eo a~
10 4 -
Luciferase"
O) 0
C:
00
1O's
Facto=" V l l l . . . . . . ~ .
10 4
THERAPEUTIC E N Z Y ME S ~-~"'e"~-v
10-1 l ,, I ..... I 10 .2 10"= 10 0 10' ii
iii
i
Urokinase
i
i
i
i
l 10 z i
i
i
I , I 10 := 10 4
I I 10 s 10 i Selling price ($/kg) ii1[ i iii
i
l 101 i
I 101 i
I 10 s
I
I0 t~ i
i
Fig. 8.2. Selling prices of various compounds versus initial concentrations (from Ref. [50] with permission).
8.3.1.1 Diluteness As mentioned above, biological products are frequently present in fermentation broths and cell culture supernatants at concentrations of the order of a fraction of a miUimole per liter or even less; thus, substantial dewatering is invariably required early on in most bioseparation process trains. The relationship between the ultimate selling price of a biologically derived substance and its initial concentration is shown in Fig. 8.2 [32-34]. This particular modification of the ubiquitous "Sherwood plot", well known to chemical engineers, makes it clear that the work (and cost) of separation correlates fairly well with the diluteness of the desired component in the starting mixture. However, low concentration alone cannot explain the particularly high costs of the three representative recombinant proteins included in Fig. 8.2 (i.e., human growth hormone, tissue plasminogen activator, and hepatitis B vaccine). Other factors obviously come into play where therapeutic proteins are concerned.
8.3.1.2 Mixture Complexity One of these factors is mixture complexity (see Table 8.7). The combination of insoluble particulate and colloidal material, along with dissolved macro-
368
8 - - M E M B R A N E BIOSEPARATIONS
molecular and low-molecular-weight solutes, practically guarantees that a number of different types of downstream processing steps will be required. 8.3.1.3 Molecular Complexity and Instability Proteins and glycoproteins are particularly complex chemical entities, characterized by a hierarchy of primary, secondary, tertiary, and quaternary structure. Retention of the biological activity of these proteins depends upon maintenance of a precise structure on all of these levels. An extreme example of the subtlety of these structural differences is provided by glycoprotein isoforms, which may differ from one another only in the particular sequence of residues on the carbohydrate moiety [35]. Bioassays aside, it can be extraordinarily difficult even to detect such differences by standard analytical methods, let alone base an efficient separation process upon them. More often than not, however, the physicochemical and biochemical richness of proteins leads to property differences that can be exploited for the purposes of protein selection and separation [36]. The tendency of many proteins to undergo denaturation must also be considered when choosing bioprocess operating conditions. It goes without saying that purification processes must not entail extremes of pH or temperature; however, other aspects of a protein's environment can be equally important to its stability. For example, chaotropic agents such as thiocyanate salts and detergents are widely used to displace sorbed proteins of certain classes from chromatographic media, but they must be used with great care since they are potentially denaturing. Other possible causes of protein denaturation include high concentrations of organic solvents (generally greater than about ten percent), traces of heavy metals (e.g., lead, iron, and chromium), the stripping of stabilizing cofactors from a protein, the presence of proteolytic contaminants in crude mixtures, adsorption at gas/liquid or liquid/solid interfaces, fluid shear, and oxidative cleavage of disulfide bridges. An advantage of membrane bioseparations is avoidance of chemical separating agents altogether. With therapeutic proteins, even state-of-the-art analytical methods may be incapable of assessing whether the chemistry and structural integrity of a protein has been maintained during the course of its purification. In such cases, determination of therapeutic efficacy may be the only meaningful measure of a successful bioseparation. Therapeutic proteins are not the only type of fragile bioproduct. It is wellknown that many low-molecular-weight antibiotics are degraded at acidic pH values and/or at "high" temperatures (i.e., ambient and above). For this reason, the recovery of heat-labile antibiotics is frequently conducted at low temperatures (e.g., 4~ and even then yield losses of 10% and more must sometimes be tolerated. Membrane processing can address certain of these yield issues.
8 - - M E M B R A N E BIOSEPARATIONS
369
8.3.1.4 High In-Process Value The in-process value of a therapeutic protein may be extremely high --- e.g., upwards of a thousand dollars per gram for a monoclonal antibody at or near the end of its purification train. This is a consequence of low bioreactor productivities (e.g., low antibody titers and cultivation times of a week and more), coupled with the difficulty of multistep downstream processing. Indeed, purification of a batch of cell culture supernatant can itself require two to three days of work with equipment that is itself expensive. As a consequence, purification mistakes can be costly. One industry anecdote centers on a process-scale immunoaffinity purification column worth some half a million dollars which was based on a $5000/kg antibody; this ligand and its support were rendered worthless when a process upset irreversibly fouled the column. Understandably, risk-averse biochemical engineers respond conservatively w h e n presented with unproven membrane separation technologies. Finally, overall product recovery is at a premium when unit values are high. Bioseparation processes comprised of five separate steps are not at all uncommon, and even more steps are necessary in some instances [37]. Single-step yields generally range from 80 to 90%. Figure 8.3 shows overall product yield expressed as a function of the number of separation and purification steps and
100 80 "0 .,,..,,.,.
(D
~-
60
90%
m
> 0
40
20 0
85% 32%
80% 75%
,,- Ll.-lo
.
1
.
.
.
.
.
.
.
.
.
.
.
,.
....
-
2 3 No. of Steps
_
,,
4
Fig. 8.3. Product yield in a multistep purification process.
5
370
8 -- MEMBRANE BIOSEPARATIONS
the average fractional recovery obtained in each of those steps. It is painful to recover only one-fourth to one-third of the total amount of protein initially present, particularly after having invested a week or more of bioreactor time in production of the crude material. Hence, separation technologies like membranes that permit integration or elimination of purification steps can be highly leveraged.
8.3.1.5 Scale of Bioprocessing While a few fermenters and mammalian cell culture bioreactors used in producing recombinant proteins have capacities as large as ten thousand liters, most cell culture is conducted on a considerably smaller scale - - e.g., a few hundred liters or so. Small production scales contribute to high product costs. Indeed, annual production volumes correlate inversely with bioproduct prices in much the same fashion as concentration and price were shown related in Fig. 8.2 [38]. Buckland [27] has pointed out that a million doses (at 0.01--0.1 mg per individual dose) of an immunomodulator or vaccine translates to an armual production volume of just 10-100 g of protein. This quantity is comparable to the production scale of many diagnostic monoclonal antibodies. Production volumes are perhaps a hundred-fold larger for hormone drugs, but even so the annual production amounts only to a few kilograms per year per million doses - - miniscule by the standards of more conventional chemical operations. Even antibi~otics, some of which are administered at dosages of the order of a gram, require the annual production of just a metric ton or so of product per million doses. It is inescapable, then, that the production of high-value biologicals will seldom benefit from significant economies of scale.
8.3.1.6 Nature of Bioreactor Operation The precise nature of the product stream that emerges from a bioreactor depends on a host of factors that inevitably vary somewhat from one production run to the next. Biological processes are incompletely understood at best, and the scope and effectiveness of on-line bioprocess analysis and control techniques are limited. The situation is further complicated by the inherent instability and unpredictability of many cell lines in cell culture operations. The batchwise nature of fermentation and cell c u l t u r e - - - c o u p l e d with lot-to-lot product stream variability-- necessitates the adoption of batch as opposed to continuous separation protocols. Individual bioreactor lots may be pooled into larger lots to facilitate downstream processing and to ensure quality control. The opportunity for the molecular biologist and bioreactor engineer to impact the nature and difficulty of downstream processing operations cannot be
8 - - M E M B R A N E BIOSEPARATIONS
371
overestimated. We have already noted the trend toward the use of reduced-protein or protein-free serum supplements for mammalian cell culture, which significantly reduces the burden of contaminating proteins that must be dealt with downstream. By the same token, molecular biologists have considerable freedom in the selection and engineering of host organisms or cell lines to be used for a particular bioproduction task. By selecting a host that is capable of producing an extraceUular product (ideally having undergone all appropriate post-translational modifications), one can avoid the need to recover, resolubilize, and renature a protein that might otherwise have been produced in the form of intracellular inclusion bodies.
8.3.1.7 Purity Requirements The purity demanded of a biological product clearly depends on its ultimate use. For instance, the standard of purity of a crude food-grade, industrial, or detergent enzyme may be quite low. Similarly, the acceptable purity of an enzyme or antibody used in a diagnostic device might also be rather low--e.g., 75% or s o - - although complete removal of interfering or cross-reactive proteins might be necessary. In contrast, "several nines" protein purity may be required where therapeutic-grade proteins are concerned, thereby requiring several log reduction of contaminants. Not surprisingly, required protein purity has also been shown to correlate well with selling price [40]. Moreover, substantially complete removal of endotoxins, DNA, proteolytic degradation products, protein mutants, deamidated protein forms, microbial contaminants, viruses, and mycoplasma is generally necessary for therapeutic products [41]. Indeed, the question is not so much what should be removed as it is what it is possible to remove. If the presence of a particular contaminant can be detected by available analytical methods, it will often be a matter of concern to regulatory agencies such as the FDA, which may then dictate its removal to near limits of detection--- assuming that the technology required to achieve this level of purification exists. The issue of ultrapurification is particularly germane to the use of membranes, since membrane-based separations are generally more effective in performing crude or bulk separations than they are in achieving high purities or removing trace contaminants. However, all separation technologies--even such high-resolution procedures as chromatography and the various electrophoretic methods --- can be severely challenged by certain difficult bioseparations.
8.3.1.8 Nature of Bioprocess Development and Regulatory Issues Speed and reliability often take precedence over elegance and efficiency in bioseparation process development. Initially, the investigation of a new bio-
372
8--- MEMBRANE BIOSEPARATIONS
pharmaceutical proceeds slowly, with at least five to seven years often being required to prove out the potential of a promising drug in preclinical and clinical trials. However, once this potential is established, the pressure to scale up production technology and to "freeze" the chosen process for final product/process approval by regulatory authorities becomes immense. Because biopharmaceuticals are largely defined by the process used to make them, a therapeutic product and its production process are essentially indistinguishable. Thus, FDA approval is quite specific to a given manufacturing process. Once the Drug Master File (DMF) for a product has been submitted to the FDA, subsequent process changes are only rarely and grudgingly made, inasmuch as process modifications must be validated from the point of view of not affecting the product in any significant way. Hence, process changes are time-con~suming, risky, and expensive. The objective, then, is to develop an acceptable bioproduction/bioseparation process in a reasonably short time, even if this involves sacrificing some process efficiency or economy. The winning process is sometimes the one that works first - - not necessarily best. All in all, these circumstances bode well for membranes, since their scalability facilitates rapid and reliable process development. 8.3.1.9 Contamination Control and Containment
Contamination control relates to protection of bioreactors and their products from inadvertent contamination by microorganisms, phages (bacterial viruses), and bacterial endotoxins. Containment refers to protection of bioprocess personnel from exposure to pathogenic organisms. Humphreys [8] has noted that, while accomplishing either one or the other of these objectives is relatively easy, accomplishing both at the same time is quite another matter. Membranes are attractive because they are closed systems, unlike centrifuges that compete with membranes for various cell harvesting and clarification tasks. Membranes serve as effective barriers --- both to the intrusion of potentia J ~ harmful species into bioreactors and to the escape of such species from them and into the environment [42]. 8.3.1.10 Economic Considerations
Although economics may not drive the design of a bioseparation process for a high-value biopharmaceutical, lowering purification costs obviously improves profitability. Indeed, minimization of product recovery and purification costs can be all-important to a product's competitiveness where many of the lower-unit-value commodities derived by fermentation are concerned (e.g., antibiotics and organic acids).
8 ~ MEMBRANE
BIOSEPARATIONS
373
Dogma has it that the costs of separation and purification typically represent about 50-90% of "total" pharmaceutical production costs [43-46]. Purification costs as a fraction of the total production costs are generally lower for bulk fermentation products like the penicillins [47] and considerably higher for more complex therapeutic proteins. Cost of goods sold (COGS) represents roughly 5-25% of the sales price of traditional pharmaceuticals like antibiotics, and as much as 10-40% of the selling price of the large glycoprotein biopharmaceuticals. Application of these rules of thumb suggests, for instance, that the COGS for a $200 million/year therapeutic protein like tissue plasminogen activator might be of the order of $50 million/year - - with separation and purification accounting for most of that cost. The market for cost-effective membrane technology is evident.
8.3.2 Bioseparation Process Design 8.3.2.1 Process Flowsheets While they may differ in detail, most bioseparation processes have certain key elements in common. Most bioseparation processes include one or more of the following steps [3,33,48]: (i) removalofinsolubles (e.g., cell harvesting or clarification); (ii) product recovery and isolation (e.g., concentration and partial enrichment of products); (iii) purification, frequently multi-step; and (iv) product polishing (e.g., final contaminant removal, product formulation, and sterile filtration). Traditionally, membranes have played important roles in product recovery and product polishing operations (e.g., sterile filtration). Only recently have membrane-based processes been developed which possess sufficient resolution to permit them to tackle purification tasks. The emerging technology of affinity membranes provides an example of this [49]. Figure 8.4 shows a generalized process flowsheet that illustrates three alternative bioseparation pathways that are appropriate to cellular, extracellular, and intracellular products. The most straightforward situation results when the desired product is the cell mass itself (e.g., single cell protein, bakers' or brewers' yeast); here, little more than cell washing and drying may be required. Where the product is extracellular, the crude bioreactor effluent must be clarified by removal of insolubles prior to recovering the product from the resulting solution. Finally, where the desired product is intracellular, several intermediate steps are required to free the entrapped product. After the cells are harvested, washed, and dewatered, the cell walls are disrupted by mechanical or
8 - MEMBRANEBIOSEPARATIONS
374
FERMENTATION BROTH
CELLULAR PRODUCT
EXTRACELLULAR PRODUCT
INTRACELLULAR PRODUCT
J, Centrlfugation Filtration
Liquids,.~
Centrlfugation Filtration,
Centrlfugstion Filtration
I Solids,~ J "
I Liqulds,~ J f
I
Cells
Cells
I, Drying PRODUCT
PRODUCT
Cell
Cell Extraction
Disruption
PRODUCT
4,
Separation & Concentration
I
Purification
Centrlfugstion Filtration Waste
I
PRODUCT Fig. 8.4. Generalized biochemical separation process flowsheet.
chemical means in order to release their intracellular contents into what becomes an exceedingly complex mixture. Hopefully, filtration or centrifugation then produces a "clear" liquid that can then be treated in the same manner as a clarified stream containing an intracellular product. Detailed but representative process flowsheets are provided in various references for each of these three principal bioproduct types---specifically, for antibiotics [50], for intracellular enzymes [50], and for monoclonal antibodies produced from various sources [51-53].
8.3.2.2 General Principles and Guidelines Previous authors have presented various heuristics and general strategies for the design of bioseparation processes [3,40,54-56]. A few of the more important ones follow: Characterize the product and its major contaminants as thoroughly as possible prior to bioprocess design. -
8 -- MEMBRANE BIOSEPARATIONS
375
Encourage the molecular biologist and bioreactor engineer to plan ahead for product purification. Choose steps that exploit the biggest differences in properties of the product and its contaminants. - Use a separation based on a given physicochemical or biochemical principle only once in the separation train (i.e., employ "orthogonal" techniques). Dewater early and follow dilution by volume reduction. Schedule the most effective separation step(s) early (i.e., those with high capacity and selectivity). Separate the most plentiful impurities at the earliest opportunity. Schedule the most expensive and arduous step last to take advantage of volume reduction upstream, since capital and operating costs generally scale with solution volume. - Where possible, keep it simple. Obviously, these general rules are frequently broken; indeed, they sometimes conflict with one another. Nonetheless, the application of these principles often dictates precisely how and even whether membranes will be considered for a given bioseparation step. -
-
-
-
-
-
8.4 MICROFILTRATION AND ULTRAFILTRATION IN CELL HARVESTING AND CLARIFICATION Historically, microfiltration (MF) and ultrafiltration (UF) have been the most prominent membrane bioseparations. Below, we consider their application to the solid/liquid separations involved in the harvesting of cells and in the clarification of whole fermentation broths and cell culture supernatants. Since some downstream processing operations like chromatography demand "gin clear" feedstreams [54], this can be a tall order. 8.4.1 General Considerations 8.4.1.1 Rationale for Cross-Flow Filtration
As shown in Fig. 8.4, the first operation to be accomplished in most any bioseparation process is removal of insoluble material. The separation of cells and cell debris presents several difficulties, especially where the conventional approaches of centrifugation and rotary drum vacuum filtration are concerned [1,21.
376
8~
MEMBRANE
BIOSEPARATIONS
On the one hand, the "solids" present in fermentation beers and cell culture supernatants vary widely in size, ranging from fractions of a micron (e.g., colloidal cell debris and cell fragments) up to tens of microns in size (e.g., whole cells). Specifically, microorganisms such as the bacterium E. coli are approximately 1 ~tm in diameter and 2 ~tm long, and yeasts (e.g., S. cerevisiae) are somewhat larger at about 8 ~tm by 5 ~tm. Mammalian cells are significantly larger yet; for instance, CHO cells in suspension culture have an effective diameter of---14 ~m, while hybridoma cells range in size from about 12 to 20 ~rn [57]. Moreover, these cells, comprised as they are of about 80-85% water, differ little in density from the liquid medium in which they are suspended. Accordingly, the efficiency of centrifugation suffers from the fact that sedimentation velocities for these materials are generally low and wide-ranging; "clean" solid/liquid separations are sometimes unattainable. Prior to the development of a membrane alternative, however, centrifugation was the only viable approach to cell harvesting. The application of conventional rotary drum vacuum filters for cell removal and clarification is similarly problematic. Cells, which are frequently glutinous, tend to form cohesive, poorly draining, and compressible filter cakes. Such cakes generally have low hydraulic permeabilities, thus limiting the productivity of conventional filtration. Additionally, the need to employ filter aids (e.g., diatomaceous earth) introduces additional complications. Diatomaceous earth disposal costs are high and ever increasing. In recent years, cross-flow MF and UF have emerged as effective and economical competitors to centrifugation and conventional filtration processes in these applications [12,44,58-60]. The advantages of cross-flow filtration are several: - potential for high solids recovery and production of a relatively clear permeate; - simple product washing, since the need to resuspend centrifuged solids is avoided; avoidance of filter aid purchase and disposal costs; somewhat lower capital costs; biological containment and avoidance of aerosols; and - simple temperature control. Disadvantages include the following: significant membrane replacement and pumping costs; higher water content in the recovered solids--- i.e., dense slurries as opposed to pastes; and time-dependent, hard-to-control operation. Generally speaking, cross-flow membrane filtration will be most competitive where one of the following conditions exist: the cells are shear-sensitive (e.g., mammalian cells as opposed to microorganisms); -
-
-
-
-
-
8 -- M E M B R A N E
BIOSEPARATIONS
377
- the solid/liquid density difference is small (e.g., less than 0.1 g/cm3); - the scale of operation is small (e.g., batch sizes under several thousand liters); and - the initial solids concentration is relatively high (e.g., greater than =15%). 8.4.1.2 Membrane Characteristics
Both microfiltration membranes and ultrafiltration membranes (especially those with MWCOs greater than about 1 0 0 - 3 0 0 k D ) are equally capable o f retaining cells, since the pores of both types of membranes are orders of magnitude smaller than cells [59,61,62]. Thus, both membrane types can be used in cell harvesting, cell washing, and clarification operations. The choice between them is dictated by such considerations as relative transmembrane fluxes, fouling rates, and the overall process objective. For example, only MF membranes have the potential (albeit not always the ability) to pass macromolecular solutes like proteins into the permeate while retaining cells. This permselectivity recommends MF membranes where recovery of an extracellular protein is the ultimate objective. In other contexts, it is desired that the membrane retain proteins as well as cells and cell d e b r i s - e.g., in the clarification of an antibiotic-containing fermentation broths. Here, the clarified permeate should be devoid of proteinaceous impurities, and ultrafiltration is the membrane process of choice. Examples of each of these situations and membrane choices are provided in Section 8.4.2 below. Membrane and module materials for use in bioprocess applications should at minimum be chemically sanitizable (e.g., with sodium hydroxide a n d / o r hypochlorite solutions). In particular, fouled membranes should be capable of being cleaned or regenerated after use. (Typical sanitization and cleaning solutions - - along with strategies for minimizing membrane fouling in the first place--- are discussed in Section 8.6 below.) In certain applications, it may be desirable that the membrane, module, and system be sterilizable, but many membranes and modules are incapable of surviving contact with live steam or withstanding the severe conditions involved in autoclaving (e.g., 121~ for 30 minutes). One interesting approach to this problem involves the development of hollow-fiber membrane modules which are sufficiently inexpensive to be disposed of after a few uses [63]. Such a strategy is obviously unthinkable with systems based on difficult-to-replace and expensive fiat-sheet cassettes constructed of stainless steel. Much of the process equipment used in fermentation and cell culture operations is designed for "steam-in-place" sterilization, and this capability (or at least "clean-in-place" design) may be demanded of membrane systems. Where sterility a n d / o r containment are issues, membranes, modules and system connections must pass various integrity tests (e.g., the pressure hold, diffusion, and
378
8~
MEMBRANE
BIOSEPARATIONS
bubble point tests) to insure that housing seals and membranes are free of leaks or defects. Finally, membranes and membrane devices must not shed particles or contribute leachables or pyroger~s to the process stream. The configuration of the membrane module is not critical, although feed channel dimensions must clearly be large enough to permit aggregates of suspended solids to pass. Module design and operating conditions (in particular, feed flow rate and pressure drop) must be chosen to avoid potentially damaging fluid shear rates. Shear-induced damage, while generally of little concern with proteins and microbial cells, can be a problem with relatively fragile mammalian cells (see below). In the following sections, we present some general operating guidelines for and several examples of the application of MF and UF membranes in cell harvesting and in the clarification of fermentation broths and cell culture supernatants. We have emphasized the experience of fermentation and biotechnology industry personnel with real applications --- as opposed to the experience of membrane proponents with "model" separations.
8.4.2 Separation of Microbial Cells 8.4.2.1 Microfiltration Where available, past experience is undoubtedly the best guide to predicting membrane performance (i.e., flux, selectivity, and fouling rate) in a given bioprocess application. At this writing, theory and equations are of limited practical use. Defrise and Gekas [64] and Hanisch [59] provide tables that summarize a considerable body of experience with the application of both MF and UF membranes in microbial and mammalian cell systems. Generally speaking, it is easier to separate microorganisms with membranes than it is to separate mammalian cells, since the former are less shear sensitive. Where microorganisms are concerned, relatively large yeast cells like S. cerevisiae are more readily separated than smaller bacteria like E. coli [65]. Merck investigators [65] recently evaluated three types of microporous membranes for the harvesting and diafiltration of low- and high-cell-density fermentations of a recombinant yeast (S. cerevisiae) and a recombinant bacteria (E. coli). Hollow-fiber and fiat-sheet modules containing about 0.5--2.5 m 2 of various 0.05 to 0.45-~tm pore-size membranes were operated at feed pressures of 70-230 kPa (10-33 psig) in a test system designed to process whole, unconditioned fermentation broth (see Fig. 8.5). Yeast and bacteria cells were first concentrated four-fold, diafiltered with cold (4~ buffer (see Section 8.5), and then concentrated once again to a final cell density of about 5 0 % - - thereby producing cell suspensions some ten to twenty times more concentrated than
8 -- MEMBRANEBIOSEPARATIONS
379
Heal ExchanQef
Fe~menlor
Relenlale IC~s!
Teml~ PSl
PSI
F~rale Flow Melel
Memlxane PSI
Load (:el Ha~rv~l
Fig. 8.5. Cell harvesthlg and diafiltration by cross-flow microfiltration (from Ref. [65] with permission).
the initial fermentation broths. The intermediate diafiltration step served to wash the cells and remove soluble components that might otherwise have interfered with other downstream processing operations. Two-hundred liter batches of fermentation broth (corresponding to five hundred liters of filtrate in some cases) could be successfully processed in this manner in two hours or less. Short processing times are desirable since these mir.imize the potential for product degradation. Filtrate fluxes varied considerably among the membranes and fermentation systems considered, with typical values ranging from about 25 to 100 L / m 2 h -1. E. coli harvests were generally slower and somewhat more sensitive to cell density than harvests of the yeast S. cerevisiae. Kroner and co-workers [66--69] have also investigated cross-flow microfiltration for bacterial harvests, and they conclude that filtrate fluxes should be at least 100 L / m 2 h -1 to be competitive with centrifugation at large scales. Cross-flow microfiltration occupies a particular niche in harvesting cells characterized by densities very near those of the fermentation broths containing them. A case in point is provided by oleaginous yeast cells (e.g., A. curvatum) which, by virtue of their high fat content, exhibit a cell-vs.-broth density difference less than one-third that seen with S. cerevisiae [70]. Cross-flow MF and UF successfully concentrate such low-density yeast cells under conditions where centrifugation suffers from poor volumetric productivity (see Fig. 8.6). Interestingly, an u]trafiltration membrane (Romicon PM50) provided
380
8 - MEMBRANEBIOSEPARATIONS
somewhat higher average fluxes and concentration factors than the single microfiltration membrane tested. Indeed, a number of investigators have observed that higher fluxes may be realized with small-pore-size as opposed to large-pore-size membranes in cell harvesting and clarification applications [64,65,71,72] --- or at least that filtrate flux is surprisingly independent of pore size and pure water flux [61,73]. Such observations are easily misinterpreted, however, and so we return to elaborate on this point in Section 8.6.1 below. Wichmann and co-workers have published a particularly thorough comparison of centrifugation and cross-flow microfiltration for the harvesting of microbial cells [60]; their objective was assessment of alternative methods for enhancing the productivity of an amino-acid-producing fermenter by means of cell recycle. While both centrifugation and microfiltration were deemed competitive in this application, centrifugation was ultimately recommended on the basis of its greater reliability and higher volumetric productivity. The greatest advantage of membranes was their ability to produce a relatively clear filtrate; however, membrane fouling was problematic.
120
100 "
Symbol q ~ q~ ,
~
Hmbra-~
I ~ . 1-Omm
oea om
l~omr~cm PHS0.1-Stun
~
Gelman.Am~ux.0.2jJm
80 .C !
q~ w
60 84
U.
@@
:20
50 6 O 7 O 8 O IO0 Concm~raSon (tet'~ soSdsI.g/I
200
300
Fig. 8.6. Concentration of low-densityyeast by cross-flowMF and UF (from Ref. [70]with permission).
8 --
MEMBRANE
381
BIOSEPARATIONS
8.4.2.2 Ultrafiltration Since the filtrate fluxes obtained when ultrafilters are used to process fermentation broths and cell culture supernatants are often comparable to those afforded by microfilters, it comes as no surprise that ultrafiltration has also been used in cell harvesting and clarification operations. However, where it is desirable to retain proteins and other macromolecular species (e.g., polynucleofides) as well as cells, ultrafiltration is the membrane clarification process of choice. Such instances arise, for example, where low-molecular-weight fermentation products like antibiotics are to be recovered and purified. Ultrafiltrafion membranes useful in cell harvesting will typically have molecular-weight cut-off (MWCO) values of at least 100-300 kD. Zahka and Leahy [61] have compared cross-flow MF and UF (referred to as "tangential flow" operations) in the separation and concentration of three types of microorganisms. Parameters examined in their study included operating pressures and feed flowrates (i.e., fluid shear rates), temperature, cell concentration, medium components, anfifoam concentration, and membrane cleaning techniques. As shown in Fig. 8.7, a 100 kD MWCO UF membrane and a 0.2-~m MF membrane gave similar permeate fluxes in processing an E. coli-containing fermentation broth. In their production-scale tests, a 400-L batch of cell suspension was processed with 2.3 m 2 of this 100 kD MWCO UF membrane housed in a fiat-sheet cassettetype module. Inlet and outlet pressures were controlled at about 275 and 170 kPa (40 and 25 psig) respectively, and the cell suspension was recirculated through the unit at a flow rate of 800 L h -1 by means of a screw pump. Cells were
100
8O 10
~,*
60 0.21r
.....
too.ooo O~
MWC0
A
40
W
X ._I
14.
2O
tA 0 0
...... ~" tO
9
~. . . . . . 20
& l 30
.
, ~1
, 40
'1 50
10.000 MWCO ~ ", " .
' ' , 1 ,.i 60
70
A l, 80
90
too
TIME (min) Fig. 8.7. Effect of membrane pore size on permeate flux: E. coli cell harvest (from Ref. [61] with permission).
382
8 --
MEMBRANE
BIOSEPARATIONS
20 15
FLUX 10 (gal/ft2.day)
ii
3
4
5
6 78 910
C O N C E N T R A T I O N FACTOR Fig. 8.8. Effectof cell concentration on flux: B. thuringiensis cell harvest (from Ref. [61]with permission). concentrated by a factor of twenty in six hours at an average filtrate flux of 26 L / m 2 h -1. Figure 8.8, obtained for the harvest of B. thuringiensis cells, exhibits precisely the inverse dependence of filtrate flux on cell concentration that is expected from theory. A rather early and courageous large-scale application of ultrafiltration for clarification involved processing an N. lactamdurans broth containing the antibiotic cephamycin C, an extracellular fermentation product [74]. This Merck facility produced twenty-eight 55,000-L batches weekly of a difficult-to-clarify broth that required extensive pretreatment prior to recovery and purification of cephamycin C by ion exchange. Preliminary experiments showed that rotary drum vacuum filtration suffered from low filtration rates even with added filter aid; moreover, cephamycin C recovery was poor despite attempts to improve it by reslurrying the cake and filtering for a second time. Centrifugal separation was also problematic d u e t o slow sedimentation rates and the formation of a dilute sludge that retained a considerable amount of the product; several resuspension/centrifugation cycles were required to achieve adequate yields. Given the limitations of both of these conventional approaches to the separation of fermentation solids, UF membranes were evaluated and found attractive. Spiral-wound and hollow-fiber module designs were tested but rejected due to their tendency to become clogged with broth solids, either at the flow-channel inlet or within the module as dewatering proceeded. Dorr-Oliver thin-channel fiat-leaf Ioplate modules (now available from the Amicon Division of W.R. Grace) were specified that contained a total of about 1070 m 2 of a 24 kD MWCO Dynel (PVC/PAN copolymer) membrane. Pretreatment upstream of the bank of UF modules consisted of chilling the fermentation broth and passing it through a 30-mesh screen.
8 -- MEMBRANE BIOSEPARATIONS
383
The unclarified feed was supplied to the UF modules at an inlet pressure of 414 kPa (60 psig), and the system was operated at a feed-to-permeate flow rate ratio of 10-to-1. Each batch was initially concentrated to about one-third of its original volume by ultrafiltration. As the filtrate flux began to fall due to the increasing solids content, the batch was then diafiltered with water (see Section 8.5) until the desired objective of 98% cephamycin C recovery was achieved, albeit at the expense of dilution of the antibiotic with the diafiltrate. Protein retention was not measured but was probably very high. Membrane lifetime ranged from 600 to 1000 batches. Additional useful information on operating conditions, cleaning protocols, process control techniques, and other practical matters is provided in the original reference [74]. In summary, ultrafiltration was found superior to rotary drum vacuum filtration in this application for several reasons: - UF afforded 98% antibiotic recovery as compared to the 96% recovery attained with the conventional reslurry-refiltration process; UF system materials costs (including membrane replacement) were onefourth those of precoat filtration; - UF required one-third the operating labor; and the UF system capital cost was 20% lower than that of the additional rotary drum vacuum filtration capacity required, even disregarding the additional burden that filter aid disposal would have placed on waste treatment facilities. For a design and cost analysis of an antibiotic clarification process based on cross-flow microfiltration as opposed to ultrafiltration, the reader is referred to another recently published membrane handbook [75]. -
-
8.4.3 Separation of Mammalian Cells As compared to the separation of microbial cells, relatively little information has been published on the large-scale application of cross-flow membrane filtration to the more difficult task of separating mammalian cells from cell culture supernatants. Typically, this operation is conducted for the purpose of producing a clarified stream suitable for recovery of an extracellular product, usually a therapeutic protein. Because of the macromolecular nature of these products, microfiltration rather than ultrafiltration is generally required in these applications. The fragility of mammalian cells distinguishes them from bacteria and yeast and makes separation of the former much more challenging. In processing mammalian cells, particular care must be taken not to stress them beyond the point at which sublethal cell damage or even cell lysis can occur. The lysis of cells and the accompanying release of their contents into the supernatant can introduce particularly troublesome contaminants. For example, even trace
384
8 -- MEMBRANE BIOSEPARATIONS
amounts of foreign DNA constitute an unacceptable impurity in therapeutic proteins, and the lipid components of cell membranes and organelles are particularly severe foulants of synthetic polymeric membranes. To complicate matters still further, the sensitivity of mammalian cells to interfacial and fluid stresses is exacerbated by the use of low-protein and serum-free media. Elucidation of safe yet productive membrane system operating conditions is a preoccupation of biochemical engineers responsible for developing bioseparation processes downstream of mammalian cell culture operations. In this regard, Maiorella et al. at Cetus Corp. (now Chiron) have practiced a systematic and instructive methodology for the determination of conditions at which to operate MF systems for the clarification of cell culture suspensions [76]. They evaluated five laboratory- and pilot-scale membrane systems varying in size from a few hundred square centimeters to several square meters --- namely, MiUipore's Minitan and Prostak fiat-sheet cassettes, Dorr-Oliver's Ioplate thin-channel system, and Microgon's MiniKros and KrosFlo hollowfiber systems. Four factors with the potential to cause cell damage were considered: (i) fluid shear, (ii) TMP-induced deformation and lysis of cells within membrane pores, (iii) fluid turbulence, and (iv) damage in pumps. The third and fourth of these potential causes of cell damage were deemed relatively unimportant. Specifically, turbulent flow conditions characterized by Reynolds numbers up to 71,000 did not measurably affect cell viability. Neither did cells suffer significant damage in positive displacement rotary lobe pumps when impeller tip speeds were kept below 350 cm s-~. However, fluid shear and TMP-induced cell deformation and lysis were determined to be matters of legitimate concern. Various investigators have shown that the viability and integrity of mammalian cells can be affected by shear and the attendant cell distortion experienced in laminar flow fields [77-83]. The lysis of animal cells occurs when the shear stress imposed on them exceeds some critical value which depends on the type of cell, its growth conditions and solution environment, and the particular measure of cell damage employed. Lysis-free operation dictates that a membrane system be operated so as to keep the maximum fluid shear rate comfortably beneath that value which, when multiplied by the fluid viscosity, corresponds to the critical shear stress of the type of cell at hand. This critical cell shear stress (and associated fluid shear rate) is probably best determined on a case-by-case basis, since published values vary widely. In the above-cited Cetus study, appreciable damage to the five animal cell lines investigated began to occur at wall shear rates in excess of about 3000 s-1. A second operating limit is associated with the TMP-induced deformation of cells into the pores of microporous membranes bridged by them --- a phenomenon quite capably addressed by Zydney and Colton [84] in the context of membrane plasmapheresis. Simply stated, the Zydney/Colton theory relates
385
8 -- MEMBRANE BIOSEPARATIONS
red blood cell hemolysis to the time-dependent strain experienced by the membrane of a viscoelastic red cell as it resides at the mouth of an MF membrane pore. The magnitude of this strain is a function of two factors: (i) the transmembrane pressure, and (ii) the shear-rate-dependent residence time of a cell at the membrane pore mouth. Cell lysis occurs when the critical strain for lysis is exceeded before a cell is swept away from the pore opening by the tangential flow field. Given a value for the wall shear rate, the Zydney/Colton model predicts the critical cell membrane tension at which lysis just begin to occur; this critical cell membrane tension can be related, in turn, to a more pragmatic p a r a m e t e r - - namely, the product of microfiltration membrane TMP and pore diameter. The net result is a map of MF membrane operating conditions that delineates regions where the wall shear rate, membrane pore size, and transmembrane pressure are such that erythrocyte suspensions can be safely processed without hemolysis. Maiorella et al. assumed that cell lysis induced by this mechanism of pore deformation would be no more severe for their cultured animal cells than for erythrocytes. Thus, they resolved to operate their clarification membrane system at conditions beneath the solid line of Fig. 8.9, which corresponds to the predictions of the Zydney/Colton model and corroborating experimental data for erythrocyte hemolysis. By the same token, Maiorella et al. resolved to
;~
12..
_O
10 -
UJ I---
"
,~
8 -
,~ II
u m
-
3;
>,
m w
Cell
"
u) Z
c ~
6
(Pore
Lysis
'I
Deformation)
- 6
aI I I
5 Cell
I I
-
Lysis
(Shear)
E
-4
Q.
I
"
Safe
..J
! ,,,
~
I
Region
"3 2
,
,,,
....
_
,,
, ,
oq @
. . . . . .
Recommended
I-O 0.
c~
-1
a"
i 0
.
.
.
1000 WALL
.
. 2000
.
. 3000
4000
SHEAR RATE (sec-t)
Fig. 8.9. Operating regimes for the cross-flow microfiltration of mammalian cells (from Ref. [76] with permission).
386
8 -- MEMBRANE BIOSEPARATIONS
operate at wall shear rates lower than 3000 s -1 (i.e., in the region to the left of the vertical dashed line of Fig. 8.9), since this was the critical shear rate found to induce lysis of their cultured animal cells. At this point the reader must be cautioned not to rely too much on the quantitative aspects of Fig. 8.9 - - i.e., on the numerical value of the critical shear rate capable of inducing cell lysis - - since these features of Fig. 8.9 depend on the particulars of the type of cell at hand. Rather, it is the general approach to the problem of determining safe membrane operating conditions that we wish to bring to the reader's attention and recommend. After operating conditions have been identified at which a cell suspension can be filtered safely, maximizing permeate flux becomes the next priority. The most effective system designs and operating protocols control the filtration rate directly, while the transmembrane pressure is permitted to "float" within preset limits, seeking that value which produces the predetermined flux [75,76,85,86]. This strategy, which evolved in the context of membrane plasmapheresis [87,88], generally gives higher sustained fluxes than afforded by the more conventional control strategy wherein membrane module inlet and outlet pressures are fixed and the filtrate flux varies in response to the changing membrane and boundary-layer resistances. By limiting the initial high flux and rapid accumulation of solids at the membrane surface that would otherwise take place upon start-up, accompanied by excessive membrane fouling and pore blocking, permeate flux control maximizes membrane throughput averaged over the duration of a run. The most straightforward means of executing the strategy of permeate flux control is to install a positive displacement pump (e.g., a peristaltic pump) in the filtrate line. The effect of permeate flux control is illustrated in Fig. 8.10, which shows transmembrane pressures experienced across a 0.65-~m microfilter - - namely, Millipore's hydrophilic Durapore polyvinylidene fluoride membrane ~ during the clarification of suspensions of a murine myeloma cell line at fixed filtrate rates between 50 and 100 L / m 2 h -1. At the highest permeate flux, TMP climbed rapidly as cell concentration proceeded, whereas TMP remained fairly constant at the lower permeate flux of 50 L / m 2h -1 up to cell densities of 20.106 cells/cm 3. Accordingly, within the so-called "safe" operating region depicted in Fig. 8.9, the Cetus investigators further identified a smaller region of "recommended" operating conditions for their MF system operation. This "recommended" operating region was characterized by moderate TMP and moderately high shear rate --- conditions that minimized concentration polarization and thus maximized long-term flux and protein passage. Larger mammalian cells were separated more readily than smaller ones, as evidenced by the lower and more nearly constant TMPs experienced during filtration of the larger cells. This observation is consistent with considerable experience in separating microorganisms with membranes as discussed above.
8 -- MEMBRANE
387
BIOSEPARATIONS
4 Q.
v
3
~"
2
r
5 0 L/m 2/hr 75 L/m 2 Ihr m 100 L/m2/hr .':,
2
7
12
CELL CONCENTRATION
17
22
(10 6cells/ml)
Fig. 8.10. Effect of permeate flux on transmembrane pressure in recovering a monoclonal antibody from cell culture supematant (from Ref. [76] with permission). Finally, it was noted that cell suspensions containing significant levels of cell debris were unfilterable at reasonable TMPs. A good example of a successful clarification run is provided in Fig. 8.11, which shows a mammalian cell suspension being concentrated twenty-fold in less than an hour at an average permeate flux of 53 L / m 2 h -1 by means of a Microgon 0.2-1~m cellulosic (CA/CN) hollow-fiber membrane. Here, the overall process objective was recovery of a monoclonal antibody secreted into the medium by a hybridoma. Over 95% of the antibody was recovered in the permeate at the indicated operating conditions, chosen to be consistent those deemed "recommended" in Fig. 8.9. An outstanding scale-up study of cross-flow microfiltration as applied to the clarification of a CHO cell culture supernatant containing recombinant t-PA has been published by van Reis et al. of Genentech [85]. These investigators sought to operate their MF membrane system at high wall shear rates (2000-8000 s -1) - - but at modest pressure drops (< 35 kPa or 5 psi), in the laminar flow regime (Re < 2100), and at a reasonably high permeate-to-feed flow rate ratio or "conversion" (i.e., Qf/Q > 0.1). These objectives were simultaneously met by their choice of a relatively open-channel (0.6-mm ID), 0.2-1~m polypropylene hollow-fiber membrane - - specifically, Akzo's Microdyn membrane. Pilot-scale experiments were performed with 1200-L batches of cell culture suspension under conditions of constant filtrate flux in order to assess the effect of operating parameters on process capacity, achievable cell concentration factors, and yield of t-PA recovered in the filtrate. Representative results are
388
8-
M E M B R A N E BIOSEPARATIONS
--~ 6 0 " E
10
r
Cells
=..,.
50-
o
F l u x - 53 IJm 2 / h r
O
Z
40'-
_o
6
oz.
< G: I--Z
30-
"' 0
20-
CL i
4 TMP
Z
0 o
~"
10 '=
_j
w 0
o(
0
0
10
20
30 TIME
40
50
60
Fig. 8.11. Hybridoma cell separation by hollow-fiber membrane microfiltration (from Ref. [76] with permission).
70
6O cQ
.--
50
t., =3
tot L.
_0
40 '
%t
4,1
m
~o
30
..
.,Q
E E
dL
2o
A W
v
I.
_O
to
0
0
c~ r
-e o - ~ O
0
I
o
82 2
-
.
....
""'oo'"3
4
mOe
5
o6
7
8
9
Time [hi Fig. 8.12. Effect of permeate flux and shear rate on transmembrane pressure in t-PA recovery (from Ref. [85] with permission).
10
8 - - MEMBRANE BIOSEPARATIONS
389
shown in Fig. 8.12. The open circles refer to operating conditions of high inlet wall shear rate (8000 s-~) and high flux (50 L / m 2 h-l), while the closed circles represent operation at low-shear (4000 s-l), low-flux (27 L / m 2 h -1) conditions. The behavior exhibited in Fig. 8.12 is qualitatively consistent with that shown previously in Figure 8.10. Strikingly, a cell concentration factor of 9.5 was attained in the run conducted at low-shear, low-flux conditions before the TMP increased to its limit value of 70 kPa (10 psi). In contrast, a concentration factor of only 2.8 was reached at the more aggressive operating conditions. Ultimately, a concentration factor of fifteen was realized in routine, full-scale t-PA production. Achieving high yield is a matter of paramount importance in the recovery of a high-unit-value therapeutic protein like t-PA. In principal, several factors may tend to reduce protein yields in microfiltration: (i) adsorption of protein onto the membrane, (ii) rejection of protein due to membrane sieving, (iii) denaturation of protein, and (iv) loss of protein in the cell concentrate. The first three factors proved insignificant in this particular application. However, nearly 7% of the t-PA protein (i.e., =1/15 of the product) would have been discarded with
Fig. 8.13. Flow diagram for cross-flowmicrofiltration system for t-PA recovery(from Ref. [85] with permission).
390
8 - - M E M B R A N E BIOSEPARATIONS
Fig. 8.14. Photograph of 180 m2cross-flow microfiltration system for t-PA recovery from cell culture (from Ref. [85] with permission). the cell concentrate if Genentech's system had been operated at a concentration factor of fifteen without taking steps to avoid this loss. Accordingly, a staged process was designed and implemented wherein the initial cell concentration step was followed by constant-volume diafiltration to improve t-PA recovery. Product yields in excess of 99% were achieved with less than 7% product dilution by initially concentrating fifteen-fold and then diafiltering with two volumes of phosphate-buffered saline. The reader is referred to Section 8.5.1.3 for additional discussion of diafiltration and equations useful in predicting its impact on product recovery. A process flow diagram and photograph of the 180-m 2 cross-flow MF system ultimately installed and operated at Genentech for this application are shown in Figs. 8.13 and 8.14, respectively. Since the late 1980s, this impressive system has operated efficiently and reliably at an inlet wall shear rate of 4000 s -1 to process t-PA-containing cell suspensions at a feed flowrate of about 33,000 L h -1 and a permeate rate of 4800 L h -1 (i.e., 27 L m 2 h-l). Kilogram quantities of t-PA are routinely recovered at yields in excess of 99%.
8 -- MEMBRANE
BIOSEPARATIONS
391
8.4.4 Generalizations and Design Guidance Cross-flow MF and UF can now be considered established technologies for the concentration of both microbial and mammalian cell suspensions. The same can be said of their application to the clarification of fermentation broths and cell culture supernatants containing either macromolecular or low-molecularweight bioproducts (e.g., recombinant therapeutic proteins and antibiotics, respectively). As the above examples demonstrate, the unique characteristics of membranes practically guarantee that cross-flow membrane filtration will be adopted in certain "niche" applications where the nature of cells a n d / o r supernatant precludes the use of centrifugation or rotary drum vacuum filtration. Beyond these special cases, however, cross-flow MF and UF filtration will also be competitive with more conventional techniques where transmembrane fluxes approach or exceed about 100 L / m 2 h -1 [66]--fluxes that are achievable under reasonably favorable circumstances. The clarification of fermentation broths and cell culture supernatants that contain significant levels of cell debris remains a much more formidable objective, however. No existing separation technique--- including membrane filtration [58,76] --- really excels at this difficult task. In fact, the lipids associated with disrupted cell membranes and intracellular organelles are particularly troublesome to membranes by virtue of their propensity to cause severe and irreversible membrane fouling (see Section 8.6). For the separation of intact microbial and mammalian cells, however, filtration rates ranging from about 25 to 100 L / m 2 h -1 may be assumed for preliminary design purposes. Flux estimates may be refined further by taking into account the particular type of cell and the density of the cell suspension to be handled, as well as the pertinent experience (if any) of others with related systems. Membrane system capital costs are notoriously difficult to gauge a priori in cell separation applications. However, it has been estimated that the capital-related costs of clarifying a mammalian cell culture supernatant might range from about $0.05 to $0.15/L of filtrate based on a plant capital investment of $ 5 , 0 0 0 / m 2 of membrane area [75]. Generalizations regarding operating costs are even riskier to make, but processing costs of the order of about $0.01 to $0.10/L of permeate might be expected with relatively simple-to-handle feedstreams characterized by low solids a n d / o r low protein contents [75,89]. The operating costs associated with "problem" streams characterized by high solids a n d / o r protein concentrations and requiring frequent membrane cleaning a n d / o r replacement due to fouling may be several times higher [89]. Permeate fluxes in the range of 25-100 L / m 2 h -1 have been documented for both MF and L~ membranes used to treat process streams derived from various microorganisms and cell lines. As noted in Section 8.4.1.2, the "correct" type of
392
8 - MEMBRANE BIOSEPARATIONS
membrane to use depends largely on the nature of the product to be recovered. Several early studies [64,65,71,72] indicated that higher fluxes could be realized with UF membranes than with MF membranes--- a counterintuitive observation sometimes attributed to the presumed blocking of relatively large MF membrane pores by deformable cells. Now, however, it is appreciated that MF membranes can function just as well as UF membranes if the former are operated under conditions of permeate flux control [76,85,86]. We subscribe to the notion that the better performance of ultrafilters as compared to microfilters in these early studies is probably attributable to their operation under "freeflow" conditions wherein transmembrane pressures (TMPs) were fixed and permeate fluxes were allowed to "float" [85]. Under these operating conditions, polarization and secondary membrane formation are inherently less severe with relatively low-flux UF membranes than is the case with relatively open, high-flux MF membranes. The steep initial flux loss invariably experienced with MF membranes operated at fixed TMPs can be minimized by controlling the permeation rate rather than the TMP as discussed above, thus leveling the playing field for MF membranes. Because process performance can be highly dependent on the particulars of the biological system being processed, it is important that laboratory and pilot experiments be performed early in the design process to validate key assumptions. Once optimal operating conditions have been established for a particular bioseparation, it then becomes critical that membrane module scale-up be accomplished as faith~lly and rigorously as possible--e.g., maintaining a fixed fluid path length as one proceeds from laboratory to pilot to productionscale membrane modules. Indeed, the scalability of membrane bioseparations is one of the principal benefits of using membrane technology in this arena.
8.5 PROTEIN RECOVERY AND CONCENTRATION BY UF Ultrafiltration, and the related process of diafiltration, have a long history of use in the recovery and concentration of proteins from aqueous solutions [90-93]. Eykamp discusses the fundamentals of UF in another chapter in this book, and the application of this technology in the food and beverage industry is the subject of yet another chapter by Cheryan and Alvarez. The use of UF in the production of de-ashed whey protein concentrates and various other cheese products are among the most economically important industrial-scale applications of ultrafiltration today. Clearly, much of what the food processing industry has learned about using UF to concentrate the severely fouling proteinaceous solutions encountered there translates directly to bioprocessing applications. Accordingly, the interested reader is referred to these other two chapters for additional information.
8 - - MEMBRANE BIOSEPARATIONS
393
8.5.1 Design Equations 8.5.1.1 Concentration by Ultrafiltration Design equations for ultrafiltration-based processes are obtained by combining the material balance equations for the solute of interest with an expression relating permeate and retentate concentrations [50,94-97]. The extent of protein concentration in batch ultrafiltration is readily estimated from the initial volume of the feed solution (Vo), the final volume of retentate (Vr), and the membrane rejection coefficient o for the particular protein of interest, defined as
o = 1 - Cp/Cr In a typical molecular-weight cut-off curve, the rejection coefficient o is plotted as a function of solute molecular weight. Given these definitions and a minimal amount of algebra, final and initial protein concentrations can be related to one another as follows: Cr = Co"
(Vo/V ) ~
In the limit of complete protein rejection (i.e., a = 1), the protein is obviously concentrated by the same factor by which the solution volume is reduced.
8.5.1.2 Purification by Ultrafiltration Less obvious but no less important is the ability of ultrafiltration to purify proteins by effecting their separation from lower-molecular-weight contaminants. Contaminating microsolutes consist of salts, simple sugars, and other metabolites that are either initially present in the fermenter feed or cell culture media or that are produced in the bioreactor. In other instances, contaminants may be introduced in the course of subsequent downstream processing steps. For example, salts and simple organic solvents are frequently used both as protein precipitating agents and as eluents in column chromatography. Because UF membranes exhibit very small rejection coefficients for lowmolecular-weight contaminants (i.e., o, = 0), while they exhibit very high rejection coefficients for macromolecular solutes like proteins (i.e., OM = 1), ultrafiltration can separate a protein from low-molecular-weight contaminants at the same time as the protein is concentrated. The degree of removal of membranepermeable microsolutes relative to membrane-retained macromolecular solutes during batch ultrafiltration may be estimated as follows: (C./CM), =
[(CJCM)o] "
-Corn- %)
where C, and CM represent the concentrations of micro- and macro-solutes, respectively. In producing protein concentrates from cheese whey (the liquid
394
8 -- MEMBRANE BIOSEPARATIONS
fraction separated from the curd in cheesemaking), protein purity expressed as a fraction of total solids content is typically increased several-fold during concentration, as a consequence of the permeation of low-molecular-weight contaminants (chiefly lactose and inorganic salts) across the UF membrane. This process is known as "de-ashing".
8.5.1.3 Purification by Diafiltration The extent to which a protein can be purified by ultrafiltration alone is rather limited. As UF-mediated concentration of a proteinaceous solution proceeds, the viscosity of the feed solution rises sharply, and concentration polarization becomes flux-limiting. Boosting protein purity still further by ultrafiltration alone is no longer viable; additional enrichment of protein must rely on depleting contaminating microsolutes rather than concentrating the macromolecular solute. The feed-and-bleed process of diafiltration, which combines some of the elements of dialysis and ultrafiltration, can accomplish this objective. Several examples of the use of diafiltration in bioprocessing have already been encountered in Sections 8.4.2.2 and 8.4.3 above. In its simplest embodiment, diafiltration is a constant-feed-volume process wherein protein-containing solution is recirculated past a protein-impermeable, contaminant-permeable UF membrane. Water or fresh buffer is continually added to the feed tank at the same rate as permeate is withdrawn, thereby maintaining constant feed/retentate volume - - and, where ~M = 1, a fixed concentration of protein in the retentate (CM,r). Membrane-permeable microsolutes are selectively washed through the UF membrane and away from the desired macromolecular product. The concentration of microsolutes (e.g., salts or solvent) in the retentate (C,,r) falls off exponentially with diafiltrate volume as given by the following expression: C,,r = C,,o" exp [- (Vd/Vo) 9(1 - C~,)] where Va is the volume of water or buffer added to the feed solution during diafiltration, and (Va/Vo) is typically referred to as the diafiltration or dilution ratio. A similar expression can obviously be written for the concentration of retained macrosolute (CM,r). The following equation for the ratio of retained micro- and macro-solute concentrations results from combining the two expressions: (C,/CM)r = (C,/CM)o " exp [- (Vd/Vo) 9(OM - %)1 Because purity depends exponentially on the dilution ratio, diafiltration is quite a powerful purification technique. Practically speaking, it is rare to resort to
8 - - M E M B R A N E BIOSEPARATIONS
395
diafiltration ratios greater than about two or three in order to achieve a desired degree of separation of protein from low-molecular-weight contaminants. Finally, it should be noted that diafiltration is equally effective in increasing the recovery of membrane-permeable solutes in clarification operations (e.g., antibiotic recovery). The equations developed above are useful in estimating the improvement in product yield attainable in this manner.
8.5.2 Typical Applications As discussed in Section 8.3.2, concentration is a ubiquitous operation in downstream bioprocessing. The opportunity to concentrate proteins by ultrafiltration arises in several contexts: immediately following clarification, particularly where the total protein concentration is below about 60 g L-1 [54]; immediately following any purification step that significantly dilutes the protein (e.g., column chromatography); and as a post-purification, terminal concentration step just prior to product isolation and formulation. The particular benefits of ultrafiltration as applied to protein concentration are several. On the one hand, the diluteness of fermentation broths and cell culture supematants makes it important that the method of concentration be energy-efficient and productive; ultrafiltration is both. Moreover, the relatively gentle nature of ultrafiltration minimizes the tendency of many proteins to denature. The objective, after all, is recovery of protein activity, not just mass. With regard to the gentleness of ultrafiltration, it should be noted that concerns were raised early on in the application of UF in bioseparations that the fluid shear fields encountered in pumping protein solutions through UF systems might be generally damaging to proteins [96,98,99]. It has since been demonstrated, however, that proteins - - while readily undergoing denaturation at gas/liquid interfaces (e.g., at free liquid surfaces in contact with air in vessels) - - are, in fact, quite resistant to very high shear rates in the absence of other threats to their stability [100-102]. Sensitivity to fluid shear during UF is now regarded as an issue only for the most fragile proteins or insofar as shear exacerbates other mechanisms of protein denaturation such as deposition on membrane pore surfaces [103]. A more serious concern regarding the use of ultrafiltration in downstream processing is that this technique generally concentrates macromolecular contaminants along with the particular protein of interest. Accordingly, undesirable contaminants like cellular DNA and bacterial endotoxins may be concentrated many-fold during ultrafiltration, whereas alternative unit operations like ion-exchange chromatography may actually reduce DNA a n d / o r endotoxin levels while achieving some modest degree of protein concentration. -
-
-
396
8 ~ M E M B R A N E BIOSEPARATIONS
Many of the early large-scale applications of ultrafiltration in concentrating proteins involved the recovery of fermentation-derived enzymes, an application that continues to be economically important [96,104-107]. Substantial purification of high-molecular-weight enzymes can be achieved along with concentration by ultrafiltration under favorable circumstances. For example, a 26-fold increase in enzyme specific activity (corresponding to 97% removal of bulk protein contaminants) has been reported in one instance [108], and 50% removal of proteinaceous contaminants from enzyme has been documented in another [105]. For the most part, however, ultrafiltration must be regarded as a non-selective concentration process where mixtures of proteins are concerned. Instances where significant protein purification is also accomplished remain the exceptions to the rule. The selection of particular ultrafiltration membranes for use in concentrating proteins is a matter of some importance. As part of a protocol designed to screen and evaluate candidate membranes, one group of investigators measured membrane sieving coefficients in the ultrafiltration of thymosin fraction 5 [15]. Their intention was to purify this bovine thymus extract by effecting a relatively tight molecular-weight "cut" with UF. Their data demonstrated quite convincingly that actual membrane sieving coefficients correlated quite poorly with nominal MWCO values reported by membrane manufacturers--- a result that probably would have surprised few of the latter. As the biotechnology industry has emerged, the focus has shifted somewhat to the use of ultrafiltration for the concentration of higher-unit-value therapeutic proteins derived either from fermentations using genetically engineered microorganisms or from mammalian cell culture. An important use of UF is in concentrating protein solutions both before the crude solutions are loaded onto chromatography columns and after the purified protein is eluted from them. On the one hand, the throughput of column chromatography is frequently flow-rate-limited; thus, preconcentration can increase the productivity and reduce the size of chromatography columns. At the same time, the elution of proteins from these purification columns is frequently accompanied by significant dilution, thus necessitating a "post-elution" concentration step. An example of the use of ultrafiltration both upstream and downstream of chromatography has been thoroughly documented for the case of the recovery and purification of a monoclonal antibody produced in batch suspension cell culture [109]. In the "large-scale" process depicted in Fig. 8.15, a 100 kD MWCO polysulfone UF membrane housed in a plate-and-frame cassette was first used to concentrate the IgG2a antibody (molecular weight =146 kD) approximately ten to twenty-fold; 280-L batches of clarified supernatant were processed with better than 95% antibody recovery. Preconcentration by UF in this manner facilitated the antibody's subsequent purification on an affinity chromatography column by avoiding throughput limitations associated with the soft gel
397
8 - - MEMBRANE BIOSEPARATIONS
Antibody-Rich Supernatanl
Concentrate Supernatant 10-20X by Tangential Flow Filtration With 100,000 Dalton Membrane
1 Day
Optional Storage at - 30~ Protein A Sepharose Affinity Column
I
Elute IgG2a at pH 4.0 Optional Storage at - 30"C
1 Day/Column 3-5 Columns per Batch
Pool Ab-Rich Fractions
1
Concentrate to 20 mg Protelnlml by Tangential Flow Filtration With 100,000 Dalton Membrane
1 Day
Formulation
Sterile Filtration
t
Aliquot Portions of Bulk Sterile Product
1 Day
l
Fig. 8.15. Antibody purification processes with UF for pre- and post-column concentration.
media employed (Protein A immobilized on Sepharose CL-4B). Following affinity purification, the pooled antibody-containing eluent fractions were concentrated for a second time using the same 100 kD MWCO ultrafilter. This "post-elution" concentration step increased the total protein concentration to 20 g L-1. Quite apart from its role in post-elution concentration of proteins, ultrafiltration also finds frequent use in buffer, salt, and solvent removal or exchange operations conducted downstream of column chromatography. As noted above, the elution of proteins from chromatographic media is frequently
398
8 - MEMBRANEBIOSEPA_~TIONS
brought about by using elution buffers that have pH values, ionic strengths, a n d / o r concentrations of specific ions or organic solvents that differ substantially from those used in loading the media and that are occasionally extreme. Indeed, elution buffers are sometimes quite hard on eluted protein, designed as they are to disrupt the normal binding of protein to the chromatographic sorbent. Accordingly, the eluted (and frequently diluted) protein finds itself in a solution of buffer, salts, a n d / o r solvents that may be denaturing or that may be incompatible with the next bioprocessing step. Another opportunity to desalt protein solutions via diafiltration arises in the context of the use of concentrated solutions of electrolytes (e.g., ammonium sulfate) to selectively precipitate or "salt out" proteins. Diafiltration is employed to transfer proteins into more suitable solution environments ~ e.g., perhaps into a solution with a pH or salt concentration adjusted for a subsequent ion-exchange purification step, or perhaps into the final formulation buffer. Buffer exchange or solvent switching are accomplished by diafiltering the protein-containing solution with several "diavolumes" of whatever solution into which it is desired to put the protein. Diafiltration competes in these buffer exchange and desalting applications with gel filtration, a column chromatography operation based on size-exclusion gels like Sephadex. The advantages of ultrafiltration include minimal loss of purified protein and avoidance of dilution. In fact, diafiltration is often combined with ultrafiltration to desalt and concentrate proteins simultaneously. In principle, the desalting of biotechnology-derived proteins can also be accomplished with membrane electrodialysis or ED [110]. Indeed, ED has been used for years to desalt cheese whey. Apart from its large-scale use in desalting dextran solutions [111], however, electrodialysis is infrequently used at present in bioprocessing. Yet another important bioprocess objective achievable with diafiltration--namely, reduction of product losses suffered in clarification operations-- has already been encountered in Section 8.4 above. Specifically, we refer the reader to our discussion there of two large-scale diafiltration processes designed to increase the yield of a soluble and membrane-permeable product by washing it away from membrane-retained solids, thereby permitting the product to be recovered in the permeate in high yield. In the first instance, cephamycin C was recovered in high yield from a fermentation broth by a combined UF/diafiltration process conducted at Merck (see Section 8.4.2.2); in the second, t-PA was recovered in high yield from cell culture supernatant at Genentech employing a diafiltration process based on a protein-permeable but cell-impermeable microfilter (see Section 8.4.3). The latter example involving MF membranes nicely illustrates that the use of diafiltration is not restricted to UF membranes capable of discriminating between macromolecules and microsolutes. Rather, diafiltration can be conducted with any type of permselective membrane (e.g.,
8 - - MEMBRANE BIOSEPARATIONS
399
MF membranes) capable of separating one class of materials (e.g., suspended solids) from another (e.g., dissolved solutes). Finally, an interesting alternative to the recovery of soluble proteins by ultrafiltration has been pursued by the group at University College London. These investigators have considered the merits of isoelectric precipitation of soya protein prior to its concentration by cross-flow MF [112,113] or UF [114,163]. The separation of precipitated protein particles by MF or UF membranes with pores ranging from 0.1 to 10 ~m in diameter promised to be faster than concentrating the soluble protein by UF. However, membrane fouling was severe at these conditions of low protein solubility (see Section 8.6.2), and the scope of the technique is presumably limited to stable proteins. Given the wide range of specific applications encountered and the spectrum of behaviors exhibited by protein solutions (which range from being relatively straightforward to nearly impossible to process), it is perhaps foolhardy to cite a "typical" value for the flux of an ultrafiltration membrane in a downstream bioprocessing application. Because of the dominant role of concentration polarization and membrane fouling in determining transmembrane fluxes, permeation rates in bioprocess applications typically have little to do with intrinsic membrane permeability and everything to do with the particulars of the system involved (i.e., membrane, protein, other foulants and contaminants, and operating conditions.) Having said this, flux values in the range of 5 to 40 L / m 2 h -1 can reasonably be expected in many bioprocessing applications. Additional guidance may be found in the numerous references cited in this chapter as well as in those written by Eykamp, Mulder and Smolders, and Cheryan and Alvarez.
8.6 F L U X - L I M I T I N G
PHENOMENA
IN MEMBRANE
BIOSEPARATIONS
The topics of concentration polarization and membrane fouling are treated quite capably and thoroughly elsewhere in this volume in chapters by Mulder and Smolders ("Polarization Phenomena and Membrane Fouling") and by Eykamp ("Microfiltration and Ultrafiltration"). However, no discussion of membrane bioseparations would be complete without recognizing the particular significance of these phenomena in processing feedstreams of biological origin [64,115-120]. 8.6.1 Concentration Polarization in MF and UF
In previous sections of this chapter, we provided several examples of the effect of concentration polarization in reducing MF and UF filtrate fluxes in bioseparation applications. In particular, we have seen that MF and UF membranes afford surprisingly similar filtrate fluxes in cell harvesting operations
400
8 ~ MEMBRANE BIOSEPARATIONS
and in the clarification of fermentation broths and cell culture supernatants (see Sections 8.4.2 and 8.4.3). Indeed, typical ultrafiltration fluxes realized in the concentration of proteins are generally not all that different from typical microfiltration fluxes realized in the separation of cell suspensions. The vastly different intrinsic permeabilities of MF and UF membranes to pure water would seem to have little bearing on the permeate fluxes observed in actual bioseparations. While several factors contribute to this situation, concentration polarization is surely the greatest "equalizer" of membrane permeation rates. Considerable progress has been made in recent years toward a better appreciation of the fundamentals of concentration polarization. The theory of concentration polarization has been most completely and successfully developed for the case where solutions of macromolecules (e.g., proteins) are concentrated by ultrafiltration [91,121-127]. The classical gel-polarization model describes the accumulation and back-diffusion of macromolecular solutes within the stagnant boundary layer at the membrane surface, along with the effect of this polarization on membrane flux. Here, one often finds fairly good agreement between the predicted and observed effects on flux of the key variables-- namely: (i) protein concentration, (ii) solution-phase mass transfer coefficients, and (iii) transmembrane pressure. Unfortunately but understandably, the acceptance of corresponding theories for the membrane filtration of particulate and colloidal suspensions (e.g., cells and cell debris) has been much slower in coming. Separate camps and alternative lxypotheses still persist to some extent, and a common mechanism and model capable of rationalizing a majority of the flux data obtained in the cross-flow microfiltration of cells still eludes us [128]. The situation is even more complicated when polarizable solutes like proteins are present in the feed stream along with particulates. Having said this, a reasonably well-developed, semi-quantitative theoretical foundation has emerged within recent years [126,129,130], reducing some of the confusion that has persisted in this area. For example, membrane scientists were puzzled at one time by the observation that their gel-polarization model, which had been applied so successfully to describe the ultrafiltration of proteins, substantially underpredicted the fluxes observed during the microfiltration of cell suspensions--- in fact, by more than an order of magnitude in some instances. This so-called "flux paradox" has now been rationalized by invoking various other transport phenomena (e.g., shear-induced diffusion and inertial lift forces) capable of assisting in the back-transport of particulate and colloidal species away from the membrane surface. In addition to many of these theoretical issues having been resolved in recent years, applications engineers have also been developing a much better understanding of how operating procedures and module and system design can affect the severity of these polarization phenomena. For example, in Section
8 - MEMBRANE BIOSEPARATIONS
401
IV.D several early studies were cited that suggested that UF membranes might exhibit higher fluxes than MF membranes in cell separation and clarification [64,65,71,72]. However, it is now generally appreciated that MF membranes can provide sustainable high fluxes if the filtration rate (as opposed to the transmembrane pressure) is controlled directly [76,85,86]. With permeate flux control, the initial period of severe MF membrane flux decline associated with polarization and pore blocking can be avoided, with the result that higher average transmembrane fluxes are achieved over the longer term. Mention should also be made here of several innovations in membrane module design that promise to provide better control over solution hydrodynamics and to reduce membrane polarization [69,131-134).
8.6.2 Membrane Fouling Control of membrane fouling is an all-too-frequent preoccupation of those who would apply porous membrane filtration in bioseparations. While fouling is encountered to some degree in most membrane separations, it is particularly severe in downstream bioprocessing. Moreover, pretreatment of the feedstream to the membrane is not a viable option in bioseparation applications, whereas extensive pretreatment may be conducted to minimize fouling in other applications of membranes (e.g., in the production of potable water by reverse osmosis). The prevalence and severity of membrane fouling in bioprocess applications is largely a consequence of the fouling-prone nature of many of the components present in fermentation broths and cell culture supernatants--- namely, cell debris, proteins, and lipids derived from cell membranes and organelles. We first discuss approaches for minimizing the severity of membrane fouling and then turn to the matter of regenerating membranes once they become fouled. The interactions of particulate, colloidal, and macromolecular species of biological origin with membrane pores and pore-wall surfaces are complex and almost always undesirable. Not surprisingly, attempts to avoid or minimize membrane fouling often center on minimizing the extent of such interactions. For example, many proteins are notorious for their tendency to adsorb or deposit on membrane surfaces, with monolayers building to multiple layers and eventually leading to protein denaturation. (It should be noted that some membrane scientists reserve the term "protein adsorption" to describe membrane/protein interactions that occur at zero-flow or low-shear conditions; they use the term "protein deposition" to describe protein/protein interactions induced by flow through membrane pores [119]. We make no such distinction here.) Membrane fouling by protein adsorption may be reduced to some degree by processing proteinaceous solutions at conditions that maximize the solubility of the protein. In particular, amphoteric protein molecules exhibit their mini-
402
8-- MEMBRANEBIOSEPARATIONS
m u m solubility at pH values corresponding to the point of zero net charge--i.e., at their isoelectric point or pI. Thus, it is generally advisable to process a protein solution at a pH value far removed from its pI, consistent of course with its stability [113,135]. Unfortunately, since any given protein is invariably encountered in a complex mixture containing many other proteins with different pI values, this strategy for avoiding fouling is more simply stated than executed. Another approach to controlling protein/membrane interactions involves manipulation of the membrane surface chemistry so as to reduce protein deposition thereon. This generally involves modifying membrane surfaces to be as hydrophilic and minimally charged as possible [12]. Hydrophobic memb r a n e s - - in particular, polysulfone ultrafilters-- are notorious for engaging in hydrophobic-hydrophobic interactions with the hydrophobic "patches" present on the exterior surfaces of many proteins; rendering a membrane surface hydrophilic by appropriate surface chemistry dearly eliminates this cause of protein adsorption. However, membrane hydrophilicity cannot be achieved simply by incorporating electrically charged groups on the membrane surface; if present, such moieties could then interact electrostatically with either positively or negatively charged "patches" that coexist in the manner of a mosaic on the surfaces of proteins. Ideally, the membrane surface should present polar but electrically neutral functional groups to protein-containing solutions. These polar groups can either belong to the membrane polymer or polymer blend itself [107,136], or they may be added by some appropriate surface treatment such as coating, grafting, or other suitable chemical modification of the membrane surface [137-143]. Careful fundamental studies of the causes and control of protein adsorption on MF and UF membranes will undoubtedly aid in the development of strategies to minimize and cope with membrane fouling in the future [144]. Other troublesome membrane foulants frequently found in bioprocess streams are-the antifoams traditionally used in fermentation operations [59,61,66]. These hydrophobes (e.g., silicones, polypropropylene glycols, etc.) severely fouled polysulfone UF membranes when the latter were first used with antifoam-containing streams. The result was that UF membranes quickly earned a bad reputation in the bioprocessing industry. However, it is now appreciated that this type of fouling can be minimized or avoided in several ways: (i) by reducing the quantity of antifoam used, (ii) by relying on mechanical foam breakers, (iii) by operating at temperatures well removed from an antifoam's cloud point [67,145], and (iv) by using antifoams specifically designed to be with compatible with membranes (e.g., Pluronic F-68 and Dow Corning 1920). Having just emphasized the importance of membrane surface chemistry, it is humbling to note that one of the more visible and successful large-scale
8 -- MEMBRANE
BIOSEPARATIONS
403
applications of MF membranes in biotechnology, the clarification of t-PA-containing cell culture supernatants at Genentech, is conducted with a hydrophobic polymeric membrane--- namely, Akzo's Microdyn polypropylene MF membrane. It is conceivable that proteins deposit on the initially hydrophobic membrane surface upon first exposure to cell culture supernatant, thus rendering the surface hydrophilic and limiting further protein deposition. This is consistent with the fact that periodic cleaning of the membrane renders its surface hydrophobic once again, making it necessary to wet the pores in the dry membrane with alcohol prior to its subsequent use. Once a membrane is fouled, various physical and chemical techniques may be used to restore at least some fraction of its initial permeability. The approaches of back-flushing and permeate closure (wherein cross flow is maintained in the absence of transmembrane flow) are examples of hydraulic cleaning techniques. More effective methods for membrane cleaning involve chemical agents. Solutions that have been found useful in membrane sanitization a n d / o r cleaning include the following [65,74-76,85]: - alkaline solutions such as dilute sodium hydroxide at concentrations up to about 2 to 5% (w/v); - disinfectants such as sodium hypochlorite (=250 ppm), hydrogen peroxide (=0.01%), and formaldehyde; - detergents including alkaline phosphates (=1% sodium tripolyphosphate), sodium dodecylbenzenesulfonate (=0.05%), and various non-ionic detergents; - chelating agents such as tetrasodium ethylenediaminetetraacetic acid (0.05%); and - acidic solutions (e.g., phosphoric, acetic, and citric) at concentrations up to about I M. These chemicals are often used in combination or in a sequence of sanitization and cleaning steps.
8.7 OTHER
MEMBRANE
BIOSEPARATIONS
8.7.1 Microsolute Concentration and Purification
Given the diluteness of typical fermentation broths, dewatering is a particularly common bioprocessing task. Several membrane technologies - - most notably, reverse osmosis (RO) and pervaporation (PV) - - c a n accomplish this operation. The energy efficiency with which xeverse osmosis can separate water from low-molecular-weight solutes is, of course, well established where seawater and brackish water desalting are concerned. In bioprocessing, this benefit can
404
8 ~ M E M B R A N E BIOSEPARATIONS
be particularly significant--especially in the recovery and concentration of certain heat-labile fermentation products like antibiotics that require processing at ambient temperature or below. Reverse osmosis competes in such applications with vacuum evaporation, a particularly energy- and capital-intensive unit operation [146-148]. Some years ago, a pioneering study at Merck concluded that a heat-sensitive antibiotic could be concentrated by RO at higher yield and with one-thirtieth the energy requirement of vacuum evaporation [146]. Other bioproducts that have been concentrated by RO include various amino acids and organic acids [149-151]. In at least one instance, RO has been shown to have the potential for purifying (as opposed to simply concentrating) a fermentation-derived solution of itaconic acid. At sufficiently low pH, this low-molecular-weight organic acid becomes preferentially membrane-permeable [152]. Despite these potential advantages, however, the application of RO in bioprocessing remains limited for several reasons: membrane fouling can be severe, and extensive pretreatment is not a viable option; RO membrane fluxes are frequently inadequate as a consequence of intrinsically low membrane permeability and/or appreciable osmotic pressures generated by nutrient sugars and salts present in fermentation broths; and more traditional unit operations like solvent extraction compete effectively in many applications. Although little used to date, the process of nanofiltration (NF) or "loose RO" based on the like of Dow/FilmTec's NF-40 or NF-70 membranes has potential in bioprocessing applications by virtue of the high water fluxes afforded by these thin-film-composite membranes [153]. The lower selectivities afforded by nanofiltration membranes are of little consequence since bioproducts like antibiotics are fairly easily rejected. Although they find limited use in bioprocessing today, other membrane technologies which show promise for the recovery and concentration of lowmolecular-weight bioproducts include pervaporation [154], membrane solvent extraction or MSX [155,156], and liquid membranes [12]. Pervaporation, by far and away the most important of these processes, finds use in dehydrating a number of solvents produced by fermentation--- most notably, ethanol. Indeed, the 150,000 L/day ethanol dehydration plant at BetheniviUe, France, which went on stream in 1988, represents the largest application of pervaporation to date; it houses some 2400 m 2 of PV membrane area [157]. Membrane solvent extraction has been investigated for the dispersion-free isolation of mevinolinic acid (a precursor to the cholesterol-lowering drug mevinolin) from an emulsion-prone fermentation broth [158]. -
-
-
8 -- MEMBRANE
BIOSEPARATIONS
405
8.7.2 Sterile Filtration and Contaminant Removal
The removal of potentially harmful contaminants from therapeutic products is a constant preoccupation at all stages in downstream processing. The task begins even upstream of the bioreactor with the production of contaminant-free water for cell culture media and of sterile feed air for fermentation, and it extends to sterile filtration of the final product itself. The list of contaminants that are unacceptable in therapeutic drugs is long, but microorganisms, viruses, foreign DNA, immunogenic proteins, and bacterial endotoxins are the primary offenders [159]. The sterile filtration by MF of pharmaceutical preparations like small-volume parenterals ranks as one of the highest-value-added membrane separations in existence, especially on the basis of the mass of contaminants removed. Where there is a substantial difference in size between the pharmaceutical and the contaminant to be removed, microfiltration or ultrafiltration can be employed. For example, solutions of small-molecule drugs (e.g., antibiotics) are routinely and reliably microfiltered to remove microbial contaminants. Sterile filtration is perhaps the only instance in bioprocessing in which microfiltration systems are operated in a dead-ended as opposed to cross-flow mode [160]. One might also expect it to be a relatively straightforward matter to exclude viruses from cell culture fluids using ultrafiltration, but this is hardly the case. Although viruses are large (e.g., tens to hundreds of nanometers) and thus are readily rejected by most UF membranes, the problem lies in the extraordinary degree of virus removal required. Twelve-log reduction of viral contaminants is routinely specified and sought via the application of multiple, "orthogonal" approaches. Unfortunately, the presence of the occasional defect or very large pore prevents most ultrafilters from performing well in this application. Recently, Millipore has developed a composite membrane with improved virusrejection characteristics which promises to make one- or two-stage ultrafiltration viable in these applications [161,162]. Finally, we note that certain contaminant removal problems are not amenable to membrane separation technology at all - - or, for that matter, to more conventional methods. For example, while a number of approaches (including membranes) are effective in removing bacterial endotoxins from water, their removal from therapeutic proteins is extraordinarily difficult. Affinity tech._iques, a membrane-based version of which is discussed briefly in the following section, have some potential for accomplishing this.
8.7.3 Affinity Membranes Affinity separation processes for the recovery and purification of proteins are conventionally carried out using adsorbent particles (e.g., agarose or silica)
406
8 ~ M E M B R A N E BIOSEPARATIONS
packed in columns. However, despite the high selectivity that affinity processes provide, their application on the process scale has been hampered by the inability of affinity columns to handle high fluid flow rates at reasonable ligand utilization efficiencies. Affinity membrane devices are based on rnicroporous hollow-fiber membranes activated by covalent attachment of affinity ligands to their interior pore-wall surface area [49]. On the one hand, affinity membranes are capable of processing high volumetric flow rates of dilute protein solutions by virtue of their uniquely small aspect ratio as compared to columns ~- that is, membranes provide very short fluid-flow path lengths in comparison to the superficial area provided for flow. Thus, pressure drop does not limit the feed flow rate during the loading step as it can with conventional chromatography columns. Moreover, convection of protein-containing solution through ligand-activated membrane pores nearly eliminates diffusional resistances associated with the porous or gel-type adsorbent particles normally used in affinity column separations, because the diffusion distance of a target protein molecule to a nearby ligandactivated pore wall is always short. As a consequence, the speed and scalability of affinity-based bioseparations can be improved significantly with membrane supports, and ligand turnover numbers can be increased. Pressure drop and intraparticle diffusion cease to be flow-rate-limiting, as other factors such as adsorption kinetics place new but less restrictive limits on performance [164]. These conceptual arguments for adopting affinity membranes in protein capture applications are powerful ones, and ambitious attempts to commercialize this technology have been made within the last few years [165]. Emphasis has been placed on the introduction of products based on (i) membrane-bound Protein A (for the capture of therapeutic monoclonal antibodies) and (ii) immunoaffinity membranes activated with monoclonal antibodies for the capture of various recombinant proteins [166]. Affinity membranes have had a slow start in large-scale bioprocess applications, largely because of the ambitious specifications that the membranes must meet in order to perform to their potential. Ligand binding capacity (i.e., the mass of target protein bound per unit volume of membrane matrix) must be reasonably high despite the fact that affinity membranes are cycled rapidly in use, and the rate and extent of membrane fouling cannot be excessive. These problems in affinity membrane surface chemistry and morphology are gradually being solved, however, with the result that the promise of affinity membranes comes closer to being realized. Indeed, affinity membrane technology may afford a paradigm for future trends in the development of ever more selective membrane bioseparations.
8 - - MEMBRANE BIOSEPARATIONS
LIST OF SYMBOLS
BHK CA/CN CHO CM C.
Co Cr DMF DNA ED
IgG IgG2a MF MSX MWCO PAN PBS Pf pI Pin Pout
PV PVC PVDF Q Qf RO TMP t-PA UF
Vd Vo Vr
Cell line from newborn hamster kidney cellulose acetate/cellulose nitrate cell line from Chinese hamster ovary macrosolute concentration microsolute concentration initial concentration (mol L-1) concentration in retentate (mol L-1) drug master file deoxyribonucleic acid electrodialysis immunoglobulin immunoglobulin of subclass 2a microfiltration membrane solvent extraction molecular-weight cut-off polyacrylonitrile phosphate-buffered saline filtrate pressure (kPa) isoelectric point feed channel inlet pressure (kPa) feed channel outlet pressure (kPa) pervaporation polyvinylchloride polyvinylidine fluoride feed flow rate (L s-1) filtrate flow rate (L s-1) reverse osmosis transmembrane pressure (kPa); [(Pin- Pout)/2] - Pf tissue plasminogen activator ultrafiltration volume of diafiltrate (L) initial volume (L) volume of retentate (L)
Greek letters:
~M
solute rejection coefficient; critical cell membrane tension (dyne/cm) microsolute rejection coefficient macrosolute rejection coefficient
407
408
8 -- MEMBRANEBIOSEPARATIONS
REFERENCES CITED
1 Fermentationand Biochemical Engineering Handbook (1983). (H.C. Vogel, ed.), Noyes Publications, Park Ridge, New Jersey. 2 Atkinson, B. and Mavituna, F. (1991). Biochemical Engineering and Biotechnology Handbook, 2nd Ed., Stockton Press, New York. 3 Belter, P.A., E.L. Cussler, and Hu, W.-S. (1988). Bioseparations: Downstream Processingfor Biotechnology, John Wiley & Sons, New York. 4 Bailey, J.E. and Ollis, D.F. (1986). Biochemical Engineering Fundamentals, 2nd Ed., McGraw-Hill, New York. 5 Wang, D.I.C., Cooney, C.L., Demain, A.L., Dunnill, P., Humphrey, A.E. and Lilly, M.D. (1979). Fermentation and Enzyme Technology, John Wiley & Sons, New York. 6 Borman, S., FDA approves 32 new drugs, biologics in 1992. C&E News, Jan. 18,1993, p. 8. 7 Thayer, A.M., Poor 1992 Earnings, Shaky Stocks Plague Biotechnology Firms. C&E News, Mar. 29, 1993, pp. 17-19. 8 Humphrey, A. (1990). Problems and Challenges in the Production and Processing of Biologically Active Materials. In: Frontiers in Bioprocessing (S.K. Sikdar, M. Bier and P. Todd, eds.). CRC Press, Inc., Boca Raton, Florida, pp. 1-13.9. Strathmann, H. (1985). Trends in Biotechnol., 3: 112. 10 Cussler, E.L. (1989). Bioseparations, Especially by Hollow Fibers. Ber. Bunsenges. Phys. Chem., 93: 944. 11 Membrane Separations in Biotechnology (1986). W.C.McGregor, ed., Marcel Dekker, Inc., New York. 12 Michaels, A.S. and Matson, S.L. (1985). Desalination, 53: 231. 13 Fane, A.G. and Radovich, J.M. (1990). Membrane Systems. In: Separation Processes in Biotechnology (J.A. Asenjo, ed.). Marcel Dekker, New York, pp. 209-262. 14 Drioli, E. (1986). Membrane Processes in the Separation, Purification, and Concentration of Bioactive Compounds from Fermentation Broths. In: Separation, Recovery, and Purification in Biotechnology 0.A. Asenjo and J. Hong, eds.). ACS Symp. Ser. 314, American Chemical Society, Washington, DC, pp. 52-66. 15 McGregor, W.C. (1986). Membrane Separations in Biotechnology, Marcel Dekker, Inc., New York, pp. xvii-xix, 1-36. 16 Ratafia, M. (1987). Biotechnology, 5: 692. 17 Cooney, C.L. (1983). Science, 219: 728. 18 Gaden, E.L. (1981). Sci. Amer., 245:180. 19 Chisti, M.Y. (1989). Airlift Bioreactors, Elsevier Applied Science, London. 20 Nelson, K.L. (1988). Biopharm. Manuf., 1: 42. 21 Rhodes, M. and Birch, J.R. (1988). Bio/Technology, 6: 518. 22 Glover, J.F. (1991). Genetic Engr. Biotechnol., 11: 18. 23 Hennighausen, L., Ruiz, L. and Wall, R. (1990). Current Opinion in Biotechnol., 1: 74. 24 Gannon, F., Powell, R., Barry, T. and McEvoy, T.G. (1990). J. Biotechnol., 16: 155. 25 Animal Cell Biotechnology (1985). R.E. Spier and J.B.Griffiths, eds., Academic Press, New York. 26 Large-Scale Mammalian Cell Culture (1985). J. Feder and W.J. Tolbert, eds., Academic Press, New York. 27 Darnell, J.E., Lodish, H.F. and Baltimore, D. (1990). Molecular Biology of the Cell, 2nd Ed., Scientific American Books, New York. 28 Hopkinson, J. (1985). Bio/Technology, 3: 225.
8 -- M E M B R A N E
BIOSEPARATIONS
409
29 Inlow, D., Maiorella, B. and Shauger, A. (1992). U.S. Patent No. 5,156,964. 30 Maiorella, B., Shauger, A., Poulhazan, M., Howarth, B., and Inlow, D. (1992). Paper presented at the 203rd ACS National Meeting, Abstract No. BIOT-112, American Chemical Society, Washington, DC. 31 Schneider, Y.J. and Lavoix, A. (1990). J. Immunol. Methods, 129: 251. 32 Van Brunt, J. (1988). Bio/Technology, 6: 479. 33 Dwyer, J.L. (1984). Bio/Technology, 2: 957. 34 Dunnill, P. (1983). Biochem. Soc. Symp., 48: 9. 35 Builder, S.E., van Reis, R., Paoni, N. and Ogez, J. (1988). Process Development and Regulatory Approval of Tissue-Type Plasminogen Activator. Proceedings of the 8th International Biotechnology Symposium, Paris, France, July 17-22,1988. 36 Belfort, G. (1989). Ber. Bunsenges. Phys. Chem., 93: 939. 37 Fish, N.M. and Lilly, M.D. (1984). Bio/Technology, 2: 623. 38 Rosen, C.G. (1987). Chemtech, 17: 612. 39 Buckland, B.C. (1990). Industrial Fermentation Processes. Biochemical Engineering Summer Course, University College London, London. 40 Horvath, C. (1988). Protein Chromatography Systems. ASME Short Course on Process Equipment Technology for Biopharmaceutical Manufacturing. Univ. of Virginia, Charlottesville, Virginia. 41 Garg, V.K., Costello, M.A.C., and Czuba, B.A. (1991). Purification and Production of Therapeutic Grade Proteins. In: Purification and Analysis of Recombinant Proteins (R. Seetharam and S.K. Sharma, eds.). Marcel Dekker, New York, pp. 29-54. 42 Schultz, J.S. (1987). J. Membr. Sci., 30: 239. 43 Fulton, S.P., Shahidi, A.J., Gordon, N.F., and Afeyan, N.B., (1992). Bio/Technology, 10: 635. 44 Martin, N., and Luker, M. (1987). Chemical Engineer (London), 434: 14. 45 Lightfoot, E.N. (1990). Separations in Biotechnology: The Key Role of Adsorptive Separations. In: Protein Purification: Molecular Mechanisms to Large-Scale Processes (M.R. Ladisch et al., eds.). ACS Symp. Ser. 427, American Chemical Society, Washington, DC, pp. 35-51. 46 Separation and Purification: Critical Needs and Opportunities (1987). National Academy Press, Washington, DC. 47 Penicillin G and Penicillin V, (1986). Chemica Medicinal Chemical Monograph No. 1, M. Barber and Associates, Coulsdon, England. 48 Bonnerjea, J., Oh, S., Hoare, M., and Dunnill, P. (1986). Biotechnology, 4: 954. 49 Klein, E. (1991). Affinity Membranes, John Wiley & Sons, New York. 50 Atkinson, B. and Mavituna, F. (1991). Biochemical Engineering and Biotechnology Handbook, 2nd Ed., Stockton Press, New York, pp. 873-904, 964-991. 51 Ostlund, C. (1986). Trends in Biotechnol., 4: 288. 52 Garg. V.K. (1990). Large-Scale Purification of Monoclonal Antibodies for Therapeutic Use. In: Targeted Therapeutic Systems (P. Tyle and B.P. Ram, eds.). Marcel Dekker, New York, pp. 45-73. 53 Fulton, S.P. (1989). The Art of Antibody Purification, Amicon/W.R. Grace & Co., Danvers, Massachusetts. 54 Prokopakis, G.J. and Asenjo, J.A. (1990). Synthesis of Downstream Processes. In: Separation Processes in Biotechnology (.A. Asenjo, ed.). Marcel Dekker, NewYork, pp. 571--601. 55 Wheelwright, S.M. (1987). Biotechnology, 5: 789. 56 Asenjo, J.A. (1990). Selection of Operations in Separation Processes. In: Separation Processes in Biotechnology 0.A. Asenjo, ed.). Marcel Dekker, NewYork, pp. 3-16.
410
8 - MEMBRANEBIOSEPARATIONS
57 Griffiths, J.B. and Riley, P.A. (1985). In: Animal Cell Biotechnology (R.E. Spier and J.B. Griffiths, eds.). Academic Press, New York, pp. 1748. 58 Mackay, D. and Salusbury, T. (1988). Chemical Engineer (London), 447: 45. 59 Hanisch, W. (1986). Cell Harvesting. In: Membrane Separations in Biotechnology (W.C. McGregor, ed.). Marcel Dekker, Inc., New York, pp. 61-88. 60 Wichmann, R., Wandrey, C. and Grosse-Wiesmann, J. (1990). Appl. Microbiol. Biotechnol., 32: 373. 61 Zahka, J. and Leahy, T.J. (1985). Practical Aspects of Tangential Flow Filtration in Cell Separations. In: Purification of Fermentation Products (T. Leahy and D. LeRoith, eds.). ACS Symp. Ser. 271, American Chemical Society, Washington, DC, pp. 51-69. 62 Ludwig, K. and O'Shaughnessey, K. (1989). American Biotechnology Laboratory, 7: 41. 63 Conversion of Bioreactors to Continuous Perfusion Using Hollow Fiber Cell Separators. (1990). Microgon, Inc., Laguna Hill, California. 64 Defrise, D. and Gekas, V. (1988). Proc. Biochem.,23:105. 65 Bailey, F.J., Waft, R.T. and Maigetter, R.Z. (1990). Enzyme Microb. Technol., 12: 647. 66 Kroner, K.H., Schutte, H., Hustedt, H. and Kula, M.-R. (1984). Proc. Biochem., 19: 67. 67 Kroner, K.H., Schutte, H., Hustedt, H. and Kula, M.-R. (1984). In Third European Congress on Biotechnology, Verlag Chemie, p. III-549. 68 Kroner, K.H., Nissinen, V., and Ziegler, H. (1987). Bio/Fechnology, 5: 921. 69 Kroner, K.H., Nissinen, V. (1988). J. Membr. Sci.,36: 85. 70 Bell, D.J. and Davies, R.J. (1987). Biotechnol. Bioeng., 29: 1176. 71 Cheryan, M. (1979). Ultrafiltration Handbook, Technomic Publishing, Lancaster, Pennsylvania, p. 279. 72 Gatenholm, P., Paterson, S., Fane, A.G., and Fell, C.J.D. (1988). Proc. Biochem., 23: 79. 73 McDonogh, R.M., Bauser, H., Stroh, N. and Chmiel, H. (1992). Chem. Eng. Sci., 47: 271. 74 Gravatt, D.P. and Molnar, T.E. (1986). Recovery of an Extracellular Antibiotic by Ultrafiltr~tion. In: Membrane Separations in Biotechnology (W.C. McGregor, ed.). Marcel Dekker, Inc., New York, pp. 89-97. 75 Mir, L., Michaels, S.L., and Goel, V. (1992). Cross-Flow Microfiltration: Applications, Design, and Cost. In: Membrane Handbook (W.S. Ho and K.K. Sirkar, eds.). Van Nostrand Reinhold, New York, pp. 571-594. 76 Maiorella, B., Dorin, G., Carion, A. and Harano, D. (1991). Biotech. Bioeng., 37: 121. 77 Born, C., Zhang, Z., A1-Rubedai, M. and Thomas, C.R. (1992). Biotech. Bioeng., 40: 1004. 78 Papoutsaki's, E.T. (1991). Trends in Biotechnol., 9: 427. 79 Petersen, J.F., McIntire, L.V. and Papoutsakis, E.T. (1988). J. Biotechnol., 7: 229. 80 Kretzmer, G. and Schugerl, K. (1991). Appl. Microbiol. Biotechnol., 34: 613. 81 Smith, C.G., Greenfield, P.F. and Randerson, D.H. (1987). Biotechnol. Tech., 1: 39. 82 Abu-Reesh, I. and Kargi, F. (1989). J. Biotechnol., 9: 167. 83 Tramper, J., Williams, J.B., Joustra, D. and Vlak, J.M. (1986). Enzy. Microb. Technol., 8: 33. 84 Zydney, A.L. and Colton, C.K. (1984). Chem. Eng. Commun., 30: 191. 85 van Reis, R., Leonard, L.C., Hsu, C.C. and Builder, S.E. (1991). Biotech. Bioeng., 38: 413. 86 Automated, Scalable Cell/Protein Separations (1991). Product brief, Sepracor Inc., Marlborough, MA. 87 Werynski, A., Malchesky, P.S., Sueoka, A., Asanuma, Y., Smith, J.W., Kayashima, K., Herpy, E., Sato, H. and Nose, Y. (1981). Trans. Am. Soc. Artif. Intern. Organs, 27: 539. 88 O'Connor, J.L. and Kessler, S.B. (1983). ASAIO Abstracts, 12: 59. 89 Colton, C.K. (1991). Private communication. 90 Blatt, W.F., Feinberg, M.P., Hopfenberg, H.P., and Saravis, C.A. (1965). Science, 150: 224.
8 -- MEMBRANEBIOSEPARATIONS
411
91 Michaels, A.S. (1968). Ultrafiltration. In: Progress in Separation and Purification, Vol. 1 (E.S. Perry, ed.). Wiley-Interscience, New York, pp. 297-334. 92 Wang, D.I.C., Sinskey, A.J., and Butterworth, T.A. (1970). Enzyme Processing Using Ultrafiltration Membranes. In: Membrane Science and Technology (J.E. Flinn, ed.). Plenum Press, New York, pp. 98-119. 93 Porter, M.C. and Nelsen, L. (1972). Ultrafiltration in the chemical, food processing, pharmaceutical, and medical industries. In: Recent Developments in Separation Science, Vol. 2 (N.N. Li, ed.). CRC Press, Cleveland, Ohio, pp. 227-267. 94 Eykamp, W. and Steen, J. (1987). Ultrafiltration and Reverse Osmosis. In: Handbook of Separation Process Technology (R.W. Rousseau, ed.). Wiley-Interscience, New York, pp. 826-2839. 95 Breslau, B.R. (1982). Ultrafiltration, Theory and Practice. Paper presented at the 1982 Corn Refiners Association Scientific Congress, Lincolnshire, Illinois, June 16-18,1982. 96 Flashel, E., Wandrey, C., and Kula, M.-R. (1983). Ultrafiltration for the Separation of Biocatalysts. In: Advances in Biochemical Engineering/Biotechnology, Vol. 26: Downstream Processing (A. Fiechter, ed.). Springer-Verlag, New York, pp. 73-142. 97 Kulkami, S.S., Funk, E.W., and Li, N.N. (1992). Ultrafiltration: Module and Process Configuration. In: Membrane Handbook (W.S. Ho and K.K. Sirkar, eds.). Van Nostrand Reinhold, New York, pp. 432-445. 98 Charm, S. and Wong, B. (1970). Biotechnol. Bioeng., 12: 1103. 99 Charm. S. and Wong, B. (1980). Enzyme Microb. Technol., 3: 111. 100 Narendranathan, T.J. and Dunnill, P. (1982). Biotechnol. Bioeng., 24: 2103. 101 Virkar, P.D., Narendranathan, T.J., Hoare, M., and Dunnill, P. (1981). Biotechnol. Bioeng., 23: 425. 102 Truskey, G.A., Gable, R., DiLeo, A. and Manter, T. (1987). J. Parenter. Sci. Technol., 4: 16. 103 Bowen, W.R. and Gan, Q. (1992). Biotechnol. Bioeng.,40: 491. 104 Kerkhof, P.J.A.M. (1988). Chem. Biochem. Eng. Quart.,2:192. 105 Neubeck, C.E. (1980). U.S. Patent No. 4,233,405. 106 Hummel, W., Schutte, H., and Kula, M.-R. (1982). Eur. J. Appl. Microbiol. Biotechnol., 12: 22. 107 Levy, P.F. and Sheehan, J.J. (1991). BioPharm, 4: 24. 108 Barbaric, S., Kozulic, B., Ries, B. and Mildner, P. (1980). Biochem. Biophys. Res. Commun., 95: 404. 109 Lee, S.M., Gustafson, M.E., Pickle, D.J., Flickinger, M.C., Muschit, G.M. and Morgan, A.C. (1986). J. Biotechnol., 4:189. 110 Jain, S.M. (1983). Ann. N.Y. Acad. Sci., 413: 290. 111 Strathmann, H. (1992). Electrodialysis: Applications. In: Membrane Handbook (W.S. Ho and K.K. Sirkar, eds.). Van Nostrand Reinhold, New York, pp. 255-262. 112 Devereux, N., and Hoare, M. (1986). Biotechnol. Bioeng., 28: 422. 113 Bentham, A.C., Ireton, M.J., Hoare, M. and Dunnill, P. (1988). Biotechnol. Bioeng., 31: 984. 114 Devereux, N., Hoare, M. and Dunnill, P. (1986). Chem. Eng. Commun., 45: 255. 115 Zeman, L.J. (1983). J. Membr. Sci., 15: 213. 116 Le, M.S. and Gollan, K.L. (1989). J. Membr. Sc/., 40: 231. 117 Nilsson, J.L. (1990). J. Membr. Sci., 52: 121. 118 Chmiel, H., Bauser, H., Schulenberg-Schell, H. and Weber, H. (1990). Pharm. Ind., 52: 223. 119 Bowen, W.R. and Gan, Q. (1991). Biotechnol. Bioeng.,38: 688. 120 Suki, A., Fane, A.G. and Fell, C.J.D. (1984). J. Membr. Sci., 21: 269. 121 Blatt, D.F., Dravid, A., Michaels, A.S., and Nelsen, L. (1970). Solute Polarization and
412
8 -- M E M B R A N E
BIOSEPARATIONS
Cake Formation in Membrane Ultrafiltration: Causes, Consequences, and Control Techniques. In: Membrane Science and Technology 0.E. Flynn, ed.). Plenum Press, New York, pp. 47-97. 122 Vilker, V.L., Colton, C.K. and Smith, K.A. (1981). AIChE J., 27: 620. 123 Jonsson, G. (1984). Desalination, 51: 61. 124 Porter, M. (1986). Concentration Polarization in Reverse Osmosis and Ultrafiltration. In: Synthetic Membranes: Science, Engineering, and Applications (P.M. Bungay et al., eds.). D. Reidel Publishing Co., pp. 367-388. 125 Wijmans, J.G., Nakao, S., van den Berg, G.B., Troelstra, F.R., and Smolders, C.A. (1985). J. Membr. Sci., 2: 117. 126 Belfort, G. (1987). Membrane Separation Technology: An Overview. In: Advanced Biochemical Engineering (H.R. Bungay and G. Belfort, eds.). John Wiley & Sons, New York, pp. 187-218. 127 Aimar, P., Howell, J.A., Clifton, M.J. and Sanchez, V. (1991). J. Membr. Sci., 59: 81. 128 Hodgson, P.H., Leslie, G.L., Schneider, R.P., Fane, A.G., Fell, C.J.D. and Marshall, K.C. (1993). J. Membr. Sci., 79: 35. 129 Zydney, A.L. and Colton, C.K. (1986). Chem. Eng. Commun., 47: 1. 130 Davis, R.H. (1992). Theory for Crossflow Microfiltration. In: Membrane Handbook (W.S. Ho and K.K. Sirkar, eds.). Van Nostrand Reinhold, New York, pp. 480-505. 131 Shmidt, I. and Badiali, M. (1988). U.S. Patent No. 4,790,942. 132 Waal, van der M.J. and Racz, I.G. (1989). J. Membr. Sc/., 40: 243. 133 Knops, F.N.M., Futselaar, H. and Racz, I.G. (1992). J. Membr. Sci., 73: 153. 134 Nichols, R.W. (1990). U.S. Patent No. 4,959,152. 135 Norde, W., MacRitchie, F., Nowicka, F.G. and Lyklema, J. (1986). J. Colloid Interface Sci., 112: 447. 136 Degen, P.J., Martin, J., Schriefer, J., and Shirley, B. (1987). U.S. Patent No. 4,693,985. 137 Dalven, P.I., Hildebrandt, J.R., Shamir, A., Laccetti, L.T., Hodgins, L.T. and Gregor, J.P. (1985). I. Appl. Poly. Sd., 30: 1113. 138 Kim, J., Saito, K., Furusaki, S., Takanobu, S. and Okamoto, J. (1991). J. Membr. Sci., 56: 289. 139 Steuck, M.J. (1986). U.S. Patent No. 4,618,533. 140 Sternberg, S. (1982). U.S. Patent No. 4,340,482. 141 Henis, J.M., Tripodi, M.K. and Stimpson, D.M. (1988). U.S. Patent No. 4,794,002. 142 Azad, A.R.M. and Goffe, R.A., (1990). PCT International Patent Application No. WO 90/04609. 143 Stengaard, F.F. (1988). Desalination, 70: 207. 144 Robertson, B.C. and Zydney, A.L. (1990). J. Colloid Interface Sci., 134: 563. 145 McGregor, W.C., Weaver, J.F. and Tansey, S.P. (1988). Biotechnol. Bioeng., 31: 385. 146 Datta, R., Fries, L. and Wildman, G.T. (1977). Biotechnol. Bioeng., 19: 1419. 147 Kalyanpur, M., Skea, W. and Siwak, M. (1985). Dev. Ind. Microbiol., 26: 455. 148 Trieber, L.R., Gullo, V.P. and Putter, I. (1981). Biotechnol. Bioeng., 23: 1255. 149 McGregor, W.C. (1989). J. Biotechnol., 10: 277. 150 Nielsen, W.K. and Kristensen, S. (1983). Process Biochem., 18: 8. 151 Schlicher, L.R. and Cheryan, M. (1990). J. Chem. Tech. Biotech., 49: 129. 152 Adams, F., Rice, L.F., Ferry, G. and Taylor, R.J. (1970). U.S. Patent 3,544,455. 153 Cadotte, J., Forester, R., Kim, M. Petersen, R., and Stocker, T. (1988). Desalination, 70: 77. 154 Baker, R.W. (1990). Pervaporation in Membrane Separation Systems: A Research Needs Assessment (Vol. II), U.S. Dept. of Energy Report No. DOE/ER/30133-H1.
8 -- MEMBRANEBIOSEPARATIONS
413
Kiani, A., Bhave, R.R. and Sirkar, K.K. (1984). J. Membr. Sci., 20: 125. Kim, B.M. (1984). J. Membr. Sci., 21: 5. Fleming, H.L. (1992). Chem. Eng. Progr., 88: 46. Prasad, R. and Sirkar, K.K. (1989). J. Membr. Sci., 47: 235. Garg, V.K., Costello, M.A.C. and Czuba, B.A. (1991). Purification and Production of Therapeutic Grade Proteins. In: Purification and Analysis of Recombinant Proteins (R. Seetharam and S.K. Sharma, eds.). Marcel Dekker, New York, pp. 29-54. 160 Goel, V., Accomazzo, M.A., DiLeo, A.J., Meier, P., Pitt, A. and Pluskal, M. (1992). Deadend Micro-filtration: Applications, Design, and Cost. In: Membrane Handbook (W.S. Ho and K.K. Sirkar, eds.). Van Nostrand Reinhold, New York, pp. 506-570. 161 DiLeo, A.J. and Allegrezza, A.E. (1991). Nature, 351: 420. 162 DiLeo, A.J., Allegrezza, A.E. and Burke, E.T. (1992). U.S. Patent No. 5,096,637. 163 Devereux, N., Hoare, M. and Dunnill, P. (1986). Biotechnol. Bioeng., 28: 88. 164 Suen, S.Y., Caracots, M. and Etzel, M.R. (1993). Chem. Eng. Sci., 48: 1801. 165 Brandt, S., Goffe, R.A., Kessler, S.B., O'Connor, J.L. and Zale, S.E. (1988). Bio/Technology, 6: 779. 166 Garg, V.K., Zale, S.E., Azad, A.R.M. and Holton, O.D. (1992). Role of Functionalized Membrane Separation Technology in Downstream Processing of Biotechnology-Derived Proteins. In: Frontiers in Bioprocessing II (P. Todd, S.K. Sikdar and M. Bier, eds.). American Chemical Society, Washington, DC, pp. 321-330. 155 156 157 158 159
Membrane Separations Technology. Principles and Applications Edited by R.D. Noble and S.A. Stern 9 1995, Elsevier Science B. 1I. All rights reserved
Chapter 9
Food and beverage industry applications Munir Cheryan a n d Jose R. Alvarez ~
Department of Food Science, 103 Agricultural Bioprocess Laboratory, University of Illinois, Urbana, IL 61801, USA aDepartment of Chemical Engineering, University of Oviedo, Oviedo, Spain
9.1. INTRODUCTION The application of membranes in the food and allied industries increased dramatically in the 1980s. This is a remarkable achievement, considering that food manufacturers are traditionally quite conservative in their approach to innovation and utilization of "new, improved" technology. Indeed, membrane technology, from. its birth in the early 1960s to the early 1980s, was viewed by the food industry with a mixture of interest and suspicion. The principles and concepts behind the science of membrane separations were quite alien at that time compared to the traditional unit operations prevailing in their plants. Since the food industry operates on a smaller margin of profit than most other process industries, it was difficult to justify the expense of discarding what had always worked (e.g., thermal evaporation) and installing a new unit operation (e.g., reverse osmosis) that had not yet been completely proven to "work" in other industries, let alone the food industry. Regulatory agencies, such as the Food and Drug Administration (FDA) and the U.S. Department of Agriculture, were unsure of how to treat this new technology, resulting in further reluctance by the food industry to adopt membrane separations. This explains why, for example, although cheese-making by ultrafiltration (UF) had been developed and patented in France in 1969, it was
416
9 ~ F O O D A N D BEVERAGE INDUSTRY APPLICATIONS
only in the early 1980s that the U.S. dairy industry accepted it as a serious alternative to the traditional method. Today, there are probably few large-scale cheese operations that are not involved with membranes in some way, either for cheese-making, whey treatment, salt brine recovery or other allied processes. The acceptance of membrane technology by such a conservative industry is due in no small part to (a) advances in the material science of membranes (which have resulted in more robust membranes better suited to sanitation standards and cleaning regimes used by the industry), (b) improved module design, (c) a better understanding of the fouling phenomena, and (d) increased awareness by food industry managers of the science and technology of membranes. The 1990s will continue to see a major penetration of membrane technology in all its facets in the food and kindred industries. Some applications that are already commercial or near commercial are listed in Table 9.1. This includes reverse osmosis (for concentration, to complement or replace evaporation), nanofiltration (for desalting and deacidification), ultrafiltration (for fractionation, concentration and purification), microfiltration (for clarification instead of centrifuges, sterilization instead of heat, and fractionation of macromolecules), electrodialysis (for demineralization instead of ion-exchange) and possibly even pervaporation for specialized applications instead of extraction a n d / o r distillation. As Table 9.1 shows, the existing and potential applications of membranes in the food industry are vast and varied, and it is beyond the scope of this chapter to cover all applications in detail. We instead focus on the two largest applications to date: dairy products and fruit juices. Information on other food applications is available elsewhere [1]. Much of the research and development has been largely done by companies and the operating parameters may be somewhat specific to a particular application. Nonetheless, there is sufficient knowledge about these applications to make some general observations about the practice and art of membrane separations in the food industry.
9.2 DAIRY INDUSTRY Among the food industries, diary processing probably accounts for the largest share of installed membrane capacity. Figure 9.1 shows trends in the use of membranes since 1970. Present usage is weighted towards reverse osmosis (RO) and ultrafiltration (UF), although there are expectations of a dramatic growth in the utilization of ceramic membranes for specialized applications. Figures 9.2 and 9.3 are general schematics of the possible applications of membranes in the dairy industry. Processing cheese whey, a by-product of cheese manufacture, was the first successful commercial application. "Nanofil-
9 -- FOODAND BEVERAGEINDUSTRYAPPLICATIONS
417
TABLE 9.1 Food industry applications of membrane technology Dairy
RO:
NF: UF:
MF: ED: Fruits and Vegetables
Juices: Pigments: Wastewater:
(Pre)Concentration of milk and whey prior to evaporation Bulk transport Specialty fluid milk products (2-3X/UHT) Partial demineralization and concentration of whey Fractionation of milk for cheese manufacture Fractionation of whey for whey protein concentrates Specialty fluid milk products Clarification of cheese whey Defatting and reducing microbial load of milk Demineralization of milk and whey Apple (UF,RO), apricot, citrus (MF/UF,RO,ED), cranberry, grape (UF,RO), kiwi, peach (UF,RO) anthocyanins apple, potato (UF,RO)
Animal Products
Gelatin: concentration and de-ashing (UF) Eggs: concentration and reduction of glucose (UF,RO) Animal by-products:blood, wastewater treatment (UF)
Beverages
MF/UF: RO:
Wine, beer, vinegar D clarification Low-alcohol beer
Sugar refining Beet/cane solutions, maple syrup, candy wastewaters --- clarification (MF/UF), desalting (ED), preconcentration (RO) Grain Products Soybean processing:
Corn refining:
Protein concentrates and isolates (UF) Protein hydrolyzates (CMR) Oil degumming and refining (UF,NF) Recovery of soy whey proteins (UF,RO) Wastewater treatment Steepwater concentration (RO) Light-middlings treatment: water recycle (RO) Saccharification of liquefied starch (CMR) Purification of dextrose (MF/UF) Fermentation of glucose to ethanol (CMR) Downstream processing (MF,UF,NF,RO,ED,PV) Wastewater treatment
Biotechnology Production of high quality water (MF,UF,RO,ED) Downstream processing (MF,UF,RO,ED): cell harvesting, protein fractionation, desalting, concentration Bioreactors: enzyme hydrolysis tissue culture plant cells ED: electrodialysis, MF: microfiltration, CMR: membrane reactor, NF: nanofiltration, PV: pervaporation, RO: reverse osmosis, UF: Ultrafiltration, UHT: ultra-high temperature.
9 - - FOODAND BEVERAGEINDUSTRYAPPLICATIONS
418
150 wheu*mllk UF ----o--- w h e u UF 120
-.---4p...-- wheu§ ,
6r
! 3"
RO
w h e u AO
~
90
v
--
J
50
30
o 75o 9
500
I
250
i
3"
milk MF
0
r~ .
70
9
75
.
,,
,
80
i
85
90
Veor Fig. 9.1. Membrane area installed in the dairy industry worldwide. Estimated by Maubois [92].
Cream " - ~ Beverages Fat-free Milk ~ - - = ' - P r o t e i n Isolates
UF Retentate
MILK
_•
UF Permeate ~
Cheese manufacture Specialty milk products Total protein isolates Lactose manufacure Fermented products
Concentrate ~ E v a p o r a t e d Products Dried Milk Products ~--~-Bulk Milk Transport Water t--z.Specialty Products
Hg. 9.2. General schematic of possible membrane applications in milk processing.
tration" or "loose RO" has a specialized application in the dairy industry. Reverse osmosis usage is dependent on prevailing energy costs, since it is used primarily as a substitute for thermal evaporation. Not shown in Fig. 9.1 are electrodialysis and pervaporation; the former has major commercial application (although not on the scale of the pressure-driven membrane processes), but the latter has yet to make its presence felt in the dairy industry.
9 - FOODAND BEVERAGEINDUSTRYAPPLICATIONS
419
UF Permeat
MILK
Cream
UF Retentate
RO Concentrate
Lactose Protein Isolates
Fermentation
Bulk Milk Transport
Cheese Manufacture Specialty Milk Products
Evaporated Milk Products Dried Milk Products
Fig. 9.3. Membrane processing of milk by sequential operations.
9.2.1 Milk 9.2.1.1 Concentration by Reverse Osmosis
The use of reverse osmosis for concentration of milk has been studied since the early 1960s. The major attraction to the dairy industry (apart from the obvious savings in energy) was that, unlike thermal evaporation or freeze concentration, moisture removal was accomplished without a change of phase or having to use extremes of temperatures. The milk is exposed to minimum heat during concentration, which avoids protein denaturation, development of the "cooked" flavor and other heat damaging effects on the constituents of milk. Initial trials with first generation cellulose acetate membranes were discouraging because of the limitations in cleaning, temperature and pH. Sanitation in the early modules also left much to be desired. The development of second generation thin-film composites was a major advancement that largely overcame many of the obstacles, except for their zero-chlorine tolerance (dairy plant operators use chlorine liberally in day-to-day operations as a sanitizer). Figure 9.4 compares the operating parameters of commercially available composite and cellulose acetate membranes. The osmotic pressure of milk is about 600-700 kPa, due largely to the lactose and dissolved salts (Table 9.2). Figure 9.5 shows typical data obtained for the concentration of milk in a spiral wound thin-layer composite membrane. Figure 9.6 shows the contribution of osmotic pressure and concentration polarization to the reduction in flux compared to water. The asymptotic relationship between applied transmembrane pressure and flux is due to concentration polarization of proteins and fat, giving rise to increased hydrodynamic resistance to permeate flow a n d / o r to l'figher osmotic pressure. The decrease in flux at higher pressures is probably due to a compaction of the polarized/fouling layer,
420
9 -- FOODAND BEVERAGEINDUSTRYAPPLICATIONS
Fig. 9.4. Comparison of operating limits of thin-film composite (polyamide) and cellulose acetate membranes.
4o
.-32 X :::) h.J
RO OF $ K I M M I L K ,
30.
SO*C
~
/
PA'99
/
/
15LPM~,fO I. LPM ~4 )#r- 0 ~0.,,v II LPM 9
",9 "&, 4 LPM
IO
o
o ,
0
IOO ,
200 ,
,
300 ,
(psi
400 ,
-
,
I 2 3 (upo) TRANSMEMBRANE PRESSURE
Fig. 9.5. Reverse osmosis of skim milk with a polyamide composite membrane. The variable is flow rate through a 50 mm diameter spiral module. From Cheryan et al. [2].
TABLE 9.2 Composition of selected dairy products Component
Milk
Total solids 12.5 Protein (NX6.38) 3.3 Fat 3.5 Lactose 4.9 Ash 0.7
Cheese whey
Cottage cheese
Feta cheese
Mozzarella cheese
Cheddar cheese
6.0 0.6 0.1 5.0 0.6
20.3 17.3 0.4 1.9 0.7
44.8 14.2 21.3 4.1 5.2
45.8 19.4 21.6 2.2 2.6
63.3 24.9 33.1 1.3 3.9
9 -- FOOD AND BEVERAGE INDUSTRY APPLICATIONS
60 RO
421
of SkimMilk(1.5)0,30~ 2.6 m/s /
50 ....
-v
4O
. . . . "~ l Polarization 3O / ~176176176176176176176176 I effact x ,-v o~176176176 @ 20 =,~s=,,,.ao
10
0 2
i 2.5
I 3
i 3.5
! 4
I 4.5
Transmembrane Pressure (MPa) Fig. 9.6. Effectof various phenomena on reverse osmosis of skim milk. Adapted from Hiddink et al. [94]. giving rise to increased resistance, or to a much higher osmotic pressure [2]. Fouling (which is a decrease in flux with time under constant operating conditions) is generally much less with milk than with whey. The nature of the deposit is mostly protein, but inorganic salts such as calcium phosphate play an important role [3]. This salt could act as a bridge between the membrane and the protein, leading to a higher hydraulic resistance of the protein layer. Operating conditions should be carefully controlled, especially with RO of whole milk. RO of raw milk will give concentrates of poor bacteriological quality and increased free fat content [4]. Suitable preheat treatment at a subpasteurization level ("thermization") can usually avoid such problems, as will operating the RO plant at temperatures of 50-55~ Although the high pressures per se pose no problem, the sudden release of pressure at the outlet of the module can damage fat globules [5]. This can be overcome by proper design of the outlet high-pressure valve. The maximum solids concentration in the retentate is limited largely by the osmotic pressure. Most commercial modules have a limit of about 3-4 MPa, which means a maximum of 3-4X concentration before the flux drops too low to be economical. Some specific applications of reverse osmosis for milk concentration are discussed below: Reduction of milk transport costs Perhaps the greatest potential for RO in the dairy industry is in bulk milk transport, especially in those countries which have large distances between producing and consumption areas. Considering that milk is more than 85% water, preconcentration of the milk prior to shipment to central dairies should
422
9 - - F O O D A N D BEVERAGE INDUSTRY A P P L I C A T I O N S
result in considerable savings in transportation costs, as well as reducing chilling and storage costs [6]. RO-milk products, when reconstituted with good quality water, are indistinguishable from unconcentrated milks in flavor and other quality attributes. If accepted by the regulatory authorities in the countries concerned, this would result in several large RO plants in USA, Australia, Canada, India, China and possibly even the European common market, among others.
Fluid and frozen milk products Milk concentrates produced by RO followed by ultra-high temperature (UHT) sterilization and homogenization may have some market value as such, especially for use in cooking applications. Its viscosity and other sensory qualities may not make it acceptable as a beverage for direct consumption; UF-milk may be better (see later). Ice cream prepared using RO concentrated skim milk has been prepared successfully [7-9].
Savings in dairy plant operations The removal of water from milk during the production of dried milk powder accounts for a significant portion of the product's final cost. Milk (either whole or skimmed) is usually concentrated to 45--50% total solids before spray drying. Because of the upper solids limitation mentioned above, RO cannot be used by itself as a complete substitute for conventional evaporation. RO, however, can be used as a preconcentration step ahead of the evaporators to reduce the time and energy demands of evaporation, or as a means to increase capacity of existing evaporators. Figure 9.7 shows the relative amounts of water to be WATER REMOVAL FROM SKIM MILK 100
[B
Reverse Osmosis ~] Evaporation ]
80
,,... "O |
m
60
0 E ,-
40
20
0 RO EVAP.
9-"18% 9 - - ' 5 0 % TS
18--50%
TS TS
9 -" 27% TS 27-,.-50%TS
Fig. 9.7. Relative amounts of water removed by reverse osmosis and evaporation during concentration of skim milk.
9 -- FOOD AND BEVERAGEINDUSTRYAPPLICATIONS
423
TABLE 9.3 Comparison of energy consumption and surface areas for RO-concentration of milk 2.5X at a feed rate of 1000 kg per hour [100] Process Thermal concentration Open-pan boiling Evaporator: Double-effect evaporator Mechanical Vapor Recompression
Area (m 2)
Energy (kcal/kg milk)
10.4 10.4
455 455
25 32
209 136
65 65 206 93
80 7 16 7
Membrane Process*
Batch, single-pump Batch, dual-pump Continuous, one-stage Continuous, three-stage
* Spiral-womld cellulose acetate membrane. A spiral-wound thin-film composite membrane would use about half this energy [2].
removed by evaporation and reverse osmosis to achieve a 50% total solids (TS) concentrate. Table 9.3 compares the energy consumption of RO and thermal evaporation for a 2.5X concentration of milk. Although the feasibility of concentrating milk by RO has been demonstrated for many years, it is surprising that there are few such installations in the world. There is ample evidence that, for equivalent capital costs, the operating cost of a RO plant is much less than a thermal evaporation plant [2]. The potential energy savings are enormous. In 1986, there were 680,000 metric tons of dried milk products and 864,000 tons of condensed and evaporated milk products produced in the United States alone. This represents potentially about 5.5 million tons of water that can be removed by incorporating a 2.5X RO process in the evaporation plants. Even if only 25% of the condensed, evaporated or dried milk products was processed with RO in this fashion, it represents a savings of at least 300 million MJ per year. Feeding RO-concentrated whole milk into a centrifugal separator can increase the capacity of the separator, with little or no effect on the skimming efficiency. However, when used to make butter, fat losses were higher than normal, and the curd content greatly increased in the butter. The manufacture of "khoa", a heat-desiccated milk product in the Indian subcontinent, has great potential [10].
Fermented products RO-milk concentrates (13-17% total solids) can be used directly in the manu-
424
9 - FOOD AND BEVERAGEINDUSTRYAPPLICATIONS
facture of yogurt. Several investigators [11-13] founded that the culture growth, acid production, acetaldehyde concentration, viscosity, flavor, and other desirable attributes of the product did not differ greatly from yogurt prepared the conventional way with added milk powder. Protein enriched cultured milk products, such as "Ymer", a traditional Danish cultured product, can be prepared by RO concentration of skim milk to 15% TS. This reportedly increases yield by 50%. However, although there has been considerable research on the manufacture of hard cheese by RO [14], ultrafiltration seems to be the preferred method (discussed later).
9.2.1.2 Milk Fractionation by Ultrafiltration Ultrafiltration membranes allow the passage of the lactose and soluble salts while retaining the protein and fat and some of the insoluble or bound salts. Polysulfone-type membranes (e.g., polyethersulfone) are most popular even though they foul more than cellulosic membranes. However, polysulfone has the advantage that higher temperatures can be used (generally 50-55~ to keep the viscosity low, flux high and the growth of microorganisms under control), they can better tolerate extremes of pH (thus making cleaning much easier) and chlorine (for sanitation). It is interesting that milk tends to foul membranes much less than cheese whey despite its higher concentration of solids (Table 9.2). Typical data for UF of milk are shown in Figure 9.8. Permeate flux increases as the pressure increases, but becomes independent of pressure at a level that
V e l o c i t y (m/s),,
4O
D"
lid
1.97
~
Jr
..----
1.53
--~ 3o ,T 9 20
m 0
E
fo~----o
Q a.
o-- 0.34
IO
3'0
1'0 1'5 2'0 2'5 (Psi) 7'0 110 1~0 (kPa)
Transmembrane Pressure
Fig. 9.8. Ultrafiltration of skim milk in a hollow fiber m o d u l e [95].
9 -- FOOD AND BEVERAGEINDUSTRYAPPLICATIONS
425
TABLE 9.4 Composition of whole milk and PRO-CAL, a low-cholesterol, low-fat, high-calcium milk produced by ultrafiltration [15]. Values are per 100 g serving Component
Regular whole milk
PRO-CAL One
PRO-CAL Zero
Fat (g) Protein (g) Carbohydrate (g) Sodium (mg) Potassium (mg) Calcium (mg) Cholesterol (mg)* Calories Calories from fat
3.5 3.5 4.8 52 161 130 14 65 48
0.87 6.1 4.8 52 161 217 3.5 52 15
0.1 6.1 4.9 52 161 217 0.5 49 4
* Calculated assuming 0.40% of the fat is cholesterol.
depends primarily on the recirculation velocity of the retentate. Concentration polarization is quite severe with milk, and thus it is best to operate at the highest velocity possible. In most cases, maximum total solids obtainable with UF is about 38-42%. Some specific applications are discussed below:
Fluid milk products There is considerable potential in the manufacture of specialty milk-based beverages. Milk is the major source of calcium in the average American diet and a significant source of high-quality protein and other nutrients. In addition, as shown in Table 9.4, while whole milk provides a large number of nutrients, it also contains the undesirable fat and cholesterol. Removal of the fat will reduce these compounds, but the resulting milk has poor texture and taste. To compensate for the poor taste and to maximize the concentration of the desirable protein and calcium, a process has been developed [15] using ultrafiltration as shown in Fig. 9.9. Since calcium in milk is mostly in the insoluble or bound form, or associated with impermeable casein micelles, concentrating skim milk by UF will simultaneously concentrate the calcium and protein, while leaving the concentration of sodium, potassium and lactose unchanged, as shown in Table 9.4 for the PRO-CAL products. Fat can be added back to improve sensory quality if desired. The taste and texture of the UF-milk (called PRO-CAL, to reflect its higher protein and calcium contents) is superior to regular skim milk, even skim milk with added milk solids. The low cholesterol product, with 1% added fat, can be used to make soft-serve ice cream and milk shakes. Processes for the reduction of lactose in skim milk have been proposed by Watters et al. [16] and Rajagopalan and Cheryan [103,104].
426
9 - FOODAND BEVERAGEINDUSTRYAPPLICATIONS
Fig. 9.9. Manufacture of PRO-CAL, a high-protein, high-calcium low-fat milk product by ultrafiltration [15].
9 ~ F O O D A N D BEVERAGE INDUSTRY APPLICATIONS
427
When used for the production of yogurt, UF milk gave a product with better viscosity and firmness than yogurt made from evaporated, milk powder-added or RO-concentrated milks, although organoleptic scores were lower than the others, due most likely to the loss of lactose and salts [17]. "Ymer" has also been manufactured from UF milk. After 2X concentration by UF, cream is added if necessary, followed by homogenization and pasteurization. The concentrate is acidified by the addition of microbial culture. UF Ymer is generally much better in overall quality; furthermore, a 15-20% increase in yield is obtained due to the inclusion of whey proteins.
On-farm ultrafiltration of milk This has been studied in the United States and France with a view to reducing transportation and refrigeration costs. The general consensus from several studies is that, while it is technically feasible for large dairy herds and when the concentrated milk is used for the manufacture of cheese, regulatory and marketing problems would inhibit application of the process. Stability of ultrafiltered milk is satisfactory [18], but there are doubts about the heat treatment given before UF ("thermization" at 65-70~ for 10-20 seconds) and the problem of health and safety compliance requirements on the farm. Nevertheless, the day may come when milk will be processed and packaged on site at dairy farms, leading to decentralization of processing operations [19]. Thus producers will be able to ship value-added finished products rather than raw milk. This will open up new opportunities for UF on the dairy farm.
9.2.1.2.1 Cheese manufacture The principal use of milk ultrafiltration in the dairy industry today is the manufacture of cheese. The pioneering work of Maubois and coworkers in 1969 that resulted in the "MMV" process for the manufacture of cheese has revolutionized the dairy industry. From a membrane technologist's point of view, cheese can be defined as a fractionation process whereby protein (casein) and fat are concentrated in the curd, while lactose, soluble proteins, minerals and other minor components are lost in the whey [1]. Thus one can readily see the application of ultrafiltration: concentrate milk to a protein/fat/solids level normally found in cheese (Table 9.1). This "pre-cheese" is then converted to cheese by conventional or modified cheesemaking methods, as shown in Fig. 9.10. Some cheesemaking options with ultrafiltration are shown in Fig. 9.11. Some of the benefits of using UF in cheesemaking are: An increase in yield of 10-30% with soft and semi-soft cheeses due to the inclusion of the whey proteins. Figure 9.12 shows the potential savings in milk in the manufacture of different cheeses depending on the degree of concentration of the retentate. - A lower requirement of the enzyme (rennet). There is conflicting scientific -
428
9 - - FOOD AND BEVERAGEINDUSTRY APPLICATIONS
TRADITIONAL PROCESS Lactic culture I~_~. cheese v 10-15 kg
~j I COAGULATION j
MILK 100 kg
]
Rennet
_ Whey 85-90 kg
UF PROCESS (MMV) Lactic culture MILK 1O0 kg
~ I
Liquid Pre-Cheese
I COAGULATION I
,
Cheese - 12-19 kg
Rennet
I
TRAFILTRA TION i
~ Permeate 81-87 kg
Fig. 9.10. Traditional a n d UF m e t h o d s for the m a n u f a c t u r e of cheese [92].
I PARTIAL WHEY DRAINAGE Hard, ripened Cheddar Mozzar.lla Edom
-
BULK STORAGE ~
~
, WHEY ~
2 NO WHEY DRAINAGE
WHOLE or SKIM MILK ULTRAFILTRATION
~
I NO SYNERESIS
L ~ [
I PASTEURIZER /
CULTURETANK
I
Soft, ripened Brie,bl.u Camembert Roquefort Rlr Soft, Quark unripened
_
CULTUREDMILK ULTRAFILTRATION
Cream cheese
/
4 ADD wPC TO CHEESE "-~[~] TRADITIONAL C H E E S E ~ PRODUCTION - -
~ !
;~
Quark Cottage cheese t cream Processed cheese
WHEY ULTRAFILTRATION
Fig. 9.11. Cheese-making options with ultrafiltration [50]. evidence in the literature [20]; in some cases it has reduced enzyme requirements by 70-85%. - A reduced volume of milk to handle, reducing the number of cheesemaking vats.
429
9 - - F O O D A N D BEVERAGE INDUSTRY A P P L I C A T I O N S
EFFECT OF UF ON YIELD OF FULL-FAT CHEESE 20
I Camember /' J /
918 o == 16 0 ;i~ 14
E lo 03
edda
8
.=_
g8 c
03
2 0
__
10
A
!
20
30
40
5O
60
Total Solids of UF Retentate (%) Fig. 9.12. Potential savings in milk usage by using ultrafiltration, expressed as a percentage of the total solids (TS) of the UF concentrate [96]. - Little or no w h e y is p r o d u c e d because most of the water and lactose has been already r e m o v e d [21-23]. - Uniformity in the quality of the product. Protein levels can be standardized and the p r o d u c t suffers less from seasonal variations [22,24]. - Ability to use a continuous and a u t o m a t e d process, which i m p r o v e s quality control, especially of moisture in the final product. This also results in i m p r o v e d sanitation and environmental conditions [22-24]. There are some technical difficulties with this process: - The increase in viscosity is dramatic w h e n the protein content of milk exceeds 12-14%. Therefore, it is more difficult to mix the starter culture and rennet. This m a y lead to texture problems in the cheese. This can be partially overcome by addition of NaC1, citrate or acid before UF [21,25]. - The buffer capacity of the retentate is increased, so even if there is a higher lactic acid production, p H does not drop to the desired value, w h i c h is usually p H 4.6 [26]. - Recirculation of retentate, even at the relatively low pressures encountered in UF, m a y lead to a partial homogenization of fat and reduce texture of hard cheeses. In addition, exposure of retentate to heat and air m a y damage w h e y proteins, which m a y affect water content and texture of the cheese. - Semi-hard and hard cheeses have a low moisture content and consequently a high solids content. A true "pre-cheese" cannot be m a d e for these products. However, even a partial pre-concentration can have significant benefits.
430
9 - FOOD AND BEVERAGE INDUSTRY APP[/CATIONS
Standardized Pasteurized Milk
3.5% Fat 3.4% Protein 12.5% T.S.
Preheating 50~
Permeate
IULTRAFILTRATIO~ I 1:5.1
Retentate
5.5% T.S.
0.2% N.P.N.
17.8% Fat 16.4% Protein 39.5% T.S.
Pasteurization 77~ / 1 min Homogenization 50-75 Bars
Cooling 27~ 2-3% Starter 0.1% Rennet
--~ Molding 2-3%
Syneresis 18-20 min
Whey
4.5% Protein 10.0% T.S.
,,
Salting
Ripening
1 FETA
CHEESE
17.5% Fat 22.0% S.N.F. 3.0% Salt 43.0% T.S.
Fig. 9.13. Manufactureof feta cheese by ultrafiltration [92].
Some specific examples of UF cheese are presented below: Feta Cheese. The advantages of ultrafiltration in the production of feta cheese are especially remarkable (Fig. 9.13). The inclusion of whey proteins makes the cheese smoother in texture th~'~ the traditional product. The heat treatment denatures the whey protein, giving smoothness to the cheese, as well as higher moisture. If the Feta cheese is required to have similar texture to the traditional
9 --F(X)DAND BEVERAGE INDUSTRY AI:TLICATIONS
SKIM MILK 9.0 % T.S.
431
)
Heat 955~~ rain C~176 24~
Culturing ~J
Rennet
Coagu1ation 18h Stir/Cut
5.Permeate 5%T.S. =.._ ..~
1
Retentate
17-20% T.S.
Cool
Cream
-~ Pack (}UARG
Fig. 9.14. Manufactureof quargby ultrafiltration [93].
one, some whey drainage has to be considered, and less UF is done (typically only to 2.5X rather than the 5X shown in Fig. 9.13). Quargis an unripened, soft, smooth curd cheese, produced from skim milk. It is low in calories and high in protein, similar to the shrikhand popular in the Indian subcontinent. Quarg is another UF success story (Fig. 9.14). To minimize possible bitterness due to high residual minerals in the product, ultrafiltration should be done at a low pH (which will solubilize the minerals and allow them to permeate). If the UF is done at the end of fermentation, a L~ system capable of handling this coagulated product has to be used.
432
9 - - FOOD A N D BEVERAGE INDUSTRY APPLICATIONS
)~
92~
.........----
~o
Holding tube (I0 min)
_I v I Ultrafiltration o
Acid >82~ |
i Ricotta Cheese
d. ~ -
..o"
pH 5.3-5.5
>70~ Holding tube (i0 rain)
~~~Deproteinated ~ w h e y
Fig. 9.15. Manufactureof ricotta cheeseby ultrafiltration [29]. Camembert is another variety of soft cheese with a special surface ripening. The internal part remains soft mainly due to the migration of lactic acid, along with minerals, to the surface. This explains the need to control the mineral content of the retentate in order to ensure good quality in the final product. Whey proteins do not significantly affect the texture of the cheese, and so its inclusion has no detrimental effect; in fact, it helps to increase the yield. Ricotta manufacture by UF has been developed by Maubois and Kosikowski [28]. More recently, Modler [29] proposed a continuous method (Fig. 9.15) where coagulation takes place in 30 m of heavy wall tygon tubing of 3.8 cm diameter. The coagulated curd is separated from the deproteinated whey by a conveyor belt. Mozzarella cheese was another challenge for UF (Fig. 9.16), because whey proteins affect stretchability and meltability of the cheese. When cheese is made from low-concentrate retentates, it has stretching and melting characteristics similar to the regular mozzarella. Most UF processes for mozzarella include reduction of calcium by acidification of the milk to about pH 5.8 before ultrafiltration, followed by diafiltration of the retentate. This is considered essential for the development of stretching properties of the cheese. Homogenization of milk is known to reduce the stretchability of the cheese; therefore, skim milk is ultrafiltered, and the fat content is adjusted later by adding cream. High whey
433
9 - - F O O D A N D BEVERAGE INDUSTRY A P P L I C A T I O N S
~
MILK
Separate ~
Skim
Cream
milk
Pasteurize Preacidi fy
--
.....~---~ "
UF
Permeate
Water
Permeate
I' Cream
,
._ "~
Retentate (Cool)
Culture Rennet Coagulat e / A c i d i
fy
'
~--
Milling
Cooking/Stretching MOZZARELLA
CHEESE Packing ~
Salting
-4-------Moulding
Fig. 9.16. Manufactureof mozzarella cheese by ultrafiltration [92]. protein in the mozzarella results in poorer melting quality. Denaturated whey proteins allow the entrapment of moisture, lowering the melting quality; complexes between whey protein and casein are also likely to be responsible. Cheddar by UF has long been considered the ultimate challenge for the cheesemaker. Most semi-hard cheeses require a relatively long period of maturation (aging) in order to achieve the desired texture and flavor. The proteolytic activity of the coagulant is a key factor in ripening. Slow proteolysis reported in early studies of UF hard and semihard cheeses was due to the low levels of
434
9 - RX)D AND BEVERAGEINDUSTRYAITLICATIONS
~ WATER ~'~"~~
90%
""""-.....~
'1
_
10%
1 PASTEURIZATION 1 |~-. STARTERCULTURE FERMENTATION
.IT
_ fco,Ti,uoos t.C~ 1 CUTTING
I
CONTINUOUS~ ~ SYNERESIS
CHEDDAR
WHEY
CHEESE
Fig. 9.17.Manufactureof cheddar cheeseby ultraf~tration using the APV Sirocurd process [24,31]. residual rennet. Therefore, more residual rennet is required in the UF cheese to obtain the same rate of ripening. There are numerous publications on the problems of making cheddar cheese by ultrafiltration [1,30]. Perhaps the only successful solution comes from CSIRO in Australia, after more than a decade of development. A schematic of the process is shown in Fig. 9.17. In order to obtain a "pre-cheese" of the same total solids content (62%), a nine-fold concentration has to be done. This is not possible with most common UF equipment. Some expulsion of moisture during curd handling (instead of during UF) is necessary to reach that solids level. The effect of whey proteins on the properties of UF cheeses is still a matter of debate. Undernaturated whey proteins appear to be resistant to the action of rennet, starter and plasmin. Whey proteins could act as an inert filler, giving the cheese a smoother texture or have a diluting effect which limits the accessibility of enzymes to the casein micelles.
9 --- F(X3D AND BEVERAGE INDUSTRY APPUCATIONS
435
Cheddar cheese yields are not as high as those of soft cheeses. If a 5X milk concentrate is used, inclusion of whey proteins would increase yield by 2.5%. If the water of hydration is included, yield should increase by 5%. If there are no losses of casein, it raises yield up to 6%. Furthermore, if 95% fat retention is obtained, then yield increase should go up to 8%, which has been reported in commercial manufacture [24,31]. By 1986, the first commercial cheddar cheese plant using the "APV Sirocurd" process was installed at the Murray Golburn dairy in Cobram (in Victoria, Australia) producing cheddar cheese reportedly indistinguishable from that produced by the conventional batch process. A larger plant designed to handle 42,000 liters of whole milk per hour was installed in 1990 at Land O'Lakes, Minnesota. Whole milk is standardized and pasteurized before being concentrated 5X in a nine-stage UF system utilizing polyethersulfone spiral modules (not all nine stages are used at start-up; a few are kept in reserve to be brought online during the processing day to compensate for flux decline). The final three stages include diafiltration to reduce the lactose content of the retentate (this is necessary for proper texture and flavor development of the finished cheese). The retentate (38-40% total solids) is split into two streams. About 10% is repasteurized and is fermented with the starter culture; this is then mixed with the rest of the retentate and enzyme (rennet) in a continuous coagulator. The coagulum is then cut and cooked in two syneresis drums where generation of curd and whey occurs. The curd-whey mixture is then pumped to a draining and matting conveyor and a standard cheddaring system before packaging. The permeate from the UF plant is sent to a RO plant to produce sterile water for cleaning and diafiltration. From a commercial viewpoint, the Sirocurd process is attractive because of its continuous nature, higher yields and better control of moisture in the final cheese.
9.2.1.3 Milk Microfiltration The development of inorganic/ceramic membranes has opened up a new set of applicatior~ of membranes in milk processing. Although a relatively small application today in terms of installed membrane area (Fig. 9.1), this is expected to increase rapidly in this decade. It is interesting that, although several studies have shown that these inorganic membranes also suffer from typical fouling problems caused by interactions between the membrane, protein and/or minerals [32-35], it has not prevented them from being used for separations of milk components by a mechanism that is not fully understood. The main applications of microfiltration in milk processing are fat separation, bacterial removal and caseinate concentration. As shown in Fig. 9.18, casein micelles (milk protein in suspe/~sion) are considerably smaller than the bacteria and fat. A membrane with pores around 0.3--1.0 microns should be able
436
9 -- FOODAND BEVERAGEINDUSTRYAPPLICATIONS
SIZE
DISTRIBUTION
OF
MAJOR
MILK
COMPONENTS
Fa
1
5
10
50
100
S I Z E OF M O L E C U L E
500
1000
OR P A R T I C L E
(run)
5000
Fig. 9.18. Size distribution of major milk components. Not shown are the carbohydrate (lactose) and soluble salts, which are much smaller than the components shown.
to separate the fat and bacteria from the rest of the milk components, provided the membrane had a fairly uniform and narrow pore size distribution and the appropriate physical and chemical properties to minimize fouling. However, attempts with polymeric membranes failed, due to the formation of a "dynamic" or secondary membrane of polarized solutes that quickly caused MF membranes to behave like UF membranes, i.e., the caseins and whey proteins were also rejected. To minimize the formation of this secondary membrane, the modules had to be operated at extremely high velocities (over 6 m s -1) and low transmembrane pressure (less than 5 psig or 40 kPa) to minimize compaction of the polarized layer. This appears to be a contradiction, since high velocities, especially in narrowdiameter tubes (e.g., < 3 mm), result in high pressure drops. A pressure profile along the length of a tubular module is shown in Fig. 9.19 (top left). Typically, the permeate channel is operated at low (close to atmospheric) pressures. The retentate side is operated with a high inlet pressure and low outlet pressure to maintain high velocity. This results in severe fouling (by compaction of polarized solutes) at the inlet of the module; on the other hand, the low pressure at the outlet means that some of the available membrane area towards the outlet was not being utilized effectively. The resulting performance would be as shown in Fig. 9.19 (bottom left): a rapid drop in flux and an increase in protein rejection to the extent that the microfilter behaves as an UF membrane. The key to the eventual successful development of the "Bactocatch" process (a trade name for the system developed by Alfa-Laval) is the "constant pressure" or "high-flux, low-fouling (HFLF)" mode of operation [36]. As shown in
437
9 -- FOODAND BEVERAGEINDUSTRYAPPLICATIONS GONVENTIONAL MF
CPF MF
A
.~_ ~w
W 0. v
.=
e
h._ ffl
W W
m
.= Permeate HH,,
O.
o.
,,,,,
I
,
I
Inlet
Permeate
8
Outlet
I
"1
Inlet
Outlet
Rejection
Rejection ,,,
Fig. 9.19. Pressure profiles (top) and flux (bottom) during microfiltrationof milk. Left: Conventional microfiltration. Right: Constant-pressure or HFLF microfiltration, as shown in Fig. 19.20.
Co-Current Permeate Flow (CPF) Microfiltration Feed ~tentate
Feed Pump
T M P = P~ " PPi
= Pro " PPo
Fig. 9.20. Constant-pressure or high-flux, low-fouling (HFLF) microfiltration. The feed is pumped through retentate channels at high velocity. The permeate is pumped through the shell side of the module with the same pressure drop as the retentate.
Fig. 9.20, this requires the simultaneous operation of a retentate p u m p i n g loop and a p e r m e a t e p u m p i n g loop, to simulate a p s e u d o - ' b a c k w a s h i n g " operation, b u t in a continuous m a n n e r rather than the periodic or intermittent m a n n e r practiced traditionally. With two parallel flows adjusted so that the pressure DROP was the same on the permeate and retentate sides of the module, the
438
9 - - FOOD AND BEVERAGEINDUSTRY APPLICATIONS
2000 . S K I M M I L K IHLF ('l/aJ,t. De..~ / L o 4 ~ .
I
1990)
/Lane~,aj.j~,
6acteztia R e t e n t i o n - 9g. TS Cmsotin R e t e n t i o n - 1-3~
- - o - 0 . 8 lan k -- 10 -+-
1,4 IIn k10 9"~'" 1.4 k - 20
rE 1000
+,,.% ,-,.-+-+,
X
~. ~ k
"+-+-+-+
.
...4-+.
.
q--
e
"a,...
&..&...&.. , &. , ,
~ . - ,-,a, . . i 9
"1"
0
I
0
+:,"
a . , r - , & .. . . . . .
-
I
go
+~.
, ,~,,-A.
""~"~"~'"
I
180
time
o
., " ~ " ' &
i
270
,
360
450
(minutes)
Fig. 9.21. Microfiltration of skim milk in a ceramic MF m e m b r a n e [34].
pressure profile would be more like that shown in Fig. 9.19 (top right). The performance would then be much better (Fig. 9.19, bottom right). This combination of tubular ceramic membranes (Bactocatch uses Membralox membranes) and the double loop, constant-pressure operation has produced dramatic results. Fluxes of 500-700 liters m -2 h -1 can be achieved over a period of 6 hours (Fig. 9.21). If needed, the transmembrane pressure can be increased slightly by 0.05-0.1 bar (0.75-1.5 psi) to compensate for fouling (Fig. 9.22).
SKIMMILK M F - -
"Bactocatch"
(Plaid, 1989) FLUX
(lira 2 h)
0.3 9 k 710 kv It=1 r i=m M
550
~
0.1
.
.
!
1
.
.
!
2
.
,
!
w
w
3
4
5
6
,,.--
TIME (hours}
Fig. 9.22. Microfiltration of skim milk in a ceramic MF m e m b r a n e (the "Bactocatch" process). F r o m Plett [37].
9 - - FOOD AND BEVERAGE INDUSTRY APFLICATIONS
1200
439
MICROFILTRATION
OF
MILK
(Plot
et
al
1987)
1000
8OO
N
=
600
L
D.65
bar
4o0 0~85 2oo-I
bar
a m
\o
0
10
20
30
40
50
60
Time (rain)
Fig. 9.23. Microfiltration of milk: effectof transmembrane pressure on flux. From Piot et al. [32]. Under these operating conditions of high velocity and low transmembrane pressures, performance is very sensitive to operating pressures (Figs. 9.22 and 9.23). Bacterial retention is 99% with the microbial load usually found in milk [37]. On the other hand, there is no significant change in the concentration of other components, so the permeate is essentially bacteria-free skim milk. The Bactocatch process became commercial in 1988-89 in Sweden. Its application is supposed to result in more stable pasteurized and refrigerated milk products. Perhaps it could be most useful in subtropical and tropical countries, where inadequate refrigeration and transportation facilities results in high microbial loads in the milk coming in to dairy plants. A Bactocatch system on the receiving dock to lower the microbial load can significantly improve the quality of the milk products in these countries. The production of enriched casein by MF has been studied by Fauquant et al. [33]. If 0.02 micron microfiltration membranes are used, it will separate out the caseins and allow the whey proteins to be isolated.
9.2.2 Cheese Whey Whey is the liquid fraction that is drained from the curd in cheese making. Every 100 kg of milk used in cheese manufacture results in 10-20 kg of cheese and 80-90 kg of whey. The general composition of whey is shown in Table 9.2. Even though individual components of cheese whey (proteins and lactose) have
440
9 - FOOD AND BEVERAGE INDUSTRY APPLICATIONS
WHE~
w e,
ED"
Fal Casein Desalted whey
Whey protein concentrate
Concentrate~ whey Individual whey proteins
Concentrated lactose
Membrane Reactor Protein Fractionation
Membrane Reactor
1 Hydrolyzate
Fuels Chemicals
Fig. 9.24. Membrane processing of cheese whey.
uses by themselves, whey itself was difficult to dispose of or utilize, due to its unfavorable lactose-to-protein ratio and high biological oxygen demand of 30,000--50,000 ppm. Ultrafiltration offered a way to improve the ratio in favor of the protein. In fact, whey processing is one of the first successful industrial applications of membranes. Figure 9.24 shows a general schematic of possible applications of membranes in whey treatment. There are two kinds of cheese whey: sweet whey (resulting from cheeses that are produced by enzyme action, and thus the pH is above 5.6) and acid whey (which results from cheeses made by acidification, with a pH of about 4.6). The latter generally has twice the amount of calcium phosphate and more lactic acid. Calcium phosphate is more soluble at low pH and low temperature. Thus the operating conditions of temperature and pH are selected based on the behavior of calcium salts, in addition to considerations of viscosity, protein denaturation and microbial growth.
9.2.2.1 Concentration by Reverse Osmosis Cheese whey was the first liquid food to be concentrated on a commercial scale using membrane technology. Early designs utilized 25 mm diameter tubular cellulose acetate membranes. Modern operations focus more on spiralwound modules using thin-film composite membranes, although many plants successfully continue to use cellulose acetate membranes, sometimes because of excessive fouling with polyamide-based composites. The degree of concentration done by RO depends on prevailing energy costs: if it is to be used as a pre-concentrator, it is probably best to do a 2X concentration to 12% total solids (TS) by RO, and the rest (1245% TS) by evaporation. However, concentration to 18-27% TS may be justified if bulk transport of whey is the primary goal. This
441
9 -- FOOD AND BEVERAGE INDUSTRY APPLICATIONS
could explain why many plants in the United States still remain at the 12% TS level of concentration, while in Europe, probably due to higher energy costs, the TS concentration has been raised to 24%. The limiting factors to high concentration by RO are osmotic pressure, viscosity and solubility of the lactose and calcium salts, which may precipitate out at high concentrations, especially if temperature and pH are not regulated.
9.2.2.2 Whey Fractionation by Ultrafiltration Today, whey protein concentrates produced by ultrafiltration are well-established in the food and dairy industries [38]. Owing to the relatively mild process conditions of temperature and pH, the functionality of the whey proteins remain good, giving rise to a wide range of applications (Table 9.5). The initial protein content of 10-12% (dry basis) can be increased by ultrafiltration to result in 35, 50 or 80% protein products, with a concomitant decrease in lactose and some salts. Further fractionation of the components into beta-lactoglobulin and alpha-lactalbumin fractions can be done as shown in Fig. 9.25. Whey is a very severe foulant of ultrafiltration membranes. It appears to foul hydrophobic membranes (e.g., polysulfone) much more than hydrophilic membranes (e.g., cellulose acetate). Numerous studies [1,39-44] have shown that membrane fouling in whey ultrafiltration is due to proteins and salts. Interestingly, it appears that 0c-lactalbumin is the principal foulant, even though it is TABLE9.5 Reported uses of whey protein concentrates [101] Baked custard Beverages Acid--clear Acidmturbid Neutral Biscuits Breads Cakes Cake fillings Candy Caramel Milk chocolate Nougats Canned refried beans Chocolate drinks
Coffee whitener Cream fillings Cream icings Cream sauces Cream desserts Cultured beverages Dougluluts Egg white replacer Egg yolk replacer Gravies Hot dogs Ice cream Imitation cream cheese Imitation milk Macaroni
Meat analogs Meat extenders Meat loaf Meringues Noodles Pasta Potato flakes Puddings Hot dogs Sausage Sherbet Snack foods Tortillas Whipped toppings Yogurt
442
9 --- F O O D A N D BEVERAGE INDUSTRY A P P L I C A T I O N S
30X WHEY - - ~
CLARIFICATION
Whey Protein Concentrate
HCI to pH 3.8
~ ICENTRIFUGATIONIi Supernatant
Diafiltration
HEAT TREATMENT 55~ 30 min, Stir
Pellet ~ Water, 56~ Wash 4 times ~ -.=------NaOH to pH 7 Clarification
Freeze-Drying I~-LACTOGLOBULIN
t
Freeze-Drying a-LACTALBUMIN
Fig. 9.25.Fractionationof wheyproteins using membranes[38,92]. present in the lowest concentration among the major proteins in milk [1,39]. The minerals and salts, primarily calcium phosphate, also play a very important role by themselves, e.g., they can precipitate on the membrane or within the pores, and/or they can enhance protein fouling by interacting with the membrane, perhaps forming "bridges" between the membrane and proteins. The appropriate pretreatment is important for high fluxes. Heat treatment at about 55~ for about 30-90 minutes appears to improve flux, perhaps by forming protein-mineral complexes that cannot interact with the membrane [1]. Kuo and Cheryan [40] proposed lowering pH to increase solubility of the salts so that they would remain soluble (Fig. 9.26). Patocka and Jelen [41] suggested pretreatments with citric acid and EDTA at pH 2.5 to sequester the calcium; this resulted in a 25% increase in flux. Addition of calcium chloride decreased flux. On the other hand, Kim et al. [42] proposed the addition of calcium chloride after cooling to 0-5~ followed by pH adjustment to 7.3 and heating to 50~ The precipitate formed was then removed by centrifugation or decantation. The UF flux almost doubled. However, these pretreatments could reduce the functionality of the whey protein concentrates. A sequential combination of centrifugal clarification and microfiltration, or microfiltration alone, are also effective [40,43,44] and will probably have less detrimental effects on the product, and indeed, may even improve them by removing the fat. Salt and protein deposition have also been implicated with fouling of ceramic membranes by whey [45,46]. The operating conditions also have a serious effect on the fouling. In general, the pH should be far away from the isoelectric point of the proteins and the
9-
443
FOOD AND BEVERAGE INDUSTRY APPI/CATIONS
Spiral-wound, SEPA 20K APt=310 KPa, 50~
60
COTTAGE CHEESE WHEY
50
- -'-..=
401~"
-
~
~
pH2
pH 3 3O
pH 4 . 5
2O
10
pH 7 '
o
9
9
;o
'
,'o
9
'1
'
9
.o
'
9
.'o
!
,oo
Time (rain)
Fig. 9.269Effect of pH of acid whey on flux with a polysulfone spiral-wound membrane [40].
FOULING OF POLYSULFONE UF MEMBRANES BY CHEESE ,WHEY
I
LOW PRESSURE CALCIUM
-.--.I-.--.'
TRANSFER
EFFECTS
I i
EFFECTS
I i
LOW VE,oC','ru
MASS
SOLUBILITY
30*C
i/ TEMPERATURE
Fig. 9.27. Fouling of polysulfone UF membranes by cheese whey. Left: Effect of transmembrane pressure and flow velocity on rate of fouling. Right: Effect of temperature on flux. temperature should be far a w a y from 30~ As s h o w n in Fig. 9.27, low temperatures will result in higher flux because of i m p r o v e d calcium solubility, while temperatures above 30~ improve flux because of the favorable effect on vis-
444
9-
ULTRAFILTRATIOH
OF
FOOD AND BEVERAGE INDUSTRY APPLICATIONS
SWEET
(7ong el u~. 1988)
WHEY
-.-e.,,--..... ~ _ _
Hucor pusillus
tehet
,.
o
"
2'o
"
4'o
"
,'o
"
8'o
"
,;o
"
,~o
.
!
,4o
-
,,,.
,;o
.......
,8o
Process time (rain)
Fig. 9.28. Effectof enzyme coagulant used in the manufacture of cheese on flux of the whey during ultrafiltration [47]. cosity and diffusivity, which leads to improved mass transfer and flux [1]. There is an optimum combination of pressure and velocity to minimize fouling (Fig. 9.27); high velocities decrease rates of surface fouling and polarization if the net transmembrane pressure is low. However, at high operating pressures, high velocities seem to aggravate fouling, even though initial fluxes may be much higher [40]. Even the coagulant used in cheese-making can have an effect on membrane fouling (Fig. 9.28). Mucor pusillus rennet gave the highest permeate flux, while the traditionally used calf rennet had the worst effect [47]. It is interesting that whey produced from cheese made with calf rennet, when subjected to the action of Mucor pusillus, resulted in increased flux almost to the level of the whey obtained with the Mucor pusillus whey.
9.2.2.3 Microfiltration of Whey The major application of MF is as a pretreatment for UF of whey. Whey usually contains small quantifies of fat (in the form of small globules of 0.2-1 microns) and casein (as fine particulates of 5-100 microns). Centrifugal separation of whey does not completely remove the fat and casein fines. Thus when the whey is ultrafiltered, these components can have detrimental effects on the functional properties of the whey protein concentrates, especially the lipid-con-
9 -- FOOD AND BEVERAGEINDUSTRYAPPLICATIONS
445
taining components. A process similar to the HFLF or "Bactocatch" described earlier, with tighter membranes of about 0.2 microns, can effectively remove substantial quantifies of these undesirable components. Fat-to-protein ratios of 0.07-0.25 in whey can be reduced to 0.001-0.003 by microfiltration [34]. In addition, some of the precipitated salts may be removed, and there is a considerable reduction in microbial load. 9.2.2.4 Demineralization
There are currently three ways to obtain demineralized whey: ion exchange, electrodialysis and nanofiltration. Owing to the high salt content of whey, ion exchange is operated for short periods of time, with frequent regeneration of the resin, which involves large amounts of regeneration chemicals and water to rinse excess chemicals from the weak anion resin. There may also be a wide variation in pH which can cause the proteins to destabilize. Electrodialysis (ED) could be an attractive alternative. Since the demineralization rate and efficiency, as well as costs, depend on the conductivity of the solutions, whey is usually concentrated prior to electrodialysis. This also reduces the processing volume. However, electrodialysis cannot complete a 100% demineralization because of the rapid increase in resistance as the ions are being depleted. It appears that the best option is to use ED to obtain 50-70% demineralization, followed by ion exchange up to the required amount. Typical composition of partially demineralized whey is shown in Table 9.6. TABLE 9.6 Composition of demineralized lactose whey [102] Component
Delactosed whey powder
(%)
55% Demineralized delactosed whey powder (%)
Protehl Lactose Fat Ash Moisture Organic milk salts Potassium Sodium Calcium Magnesium Phosphate Chloride
26 48 1.5 16 2.5 6 4.5 1.6 1.1 0.3 4.2 3.2
30.2 54 1.8 7 2.5 4.5 1.2 0.7 0.8 0.2 2.6 0.6
446
9 ~ FOOD AND BEVERAGE INDUSTRY APPLICATIONS
The term "nanofiltration" is used for membranes with more open pores than RO membranes. In general, compounds with a molecular weight of 200-500 daltons are completely rejected. This corresponds hypothetically to pores of 10 ,/~ (1 nm). The idea of "loose" reverse osmosis membranes is not new, but with the improvement in performance of thin-film composites, it opens up a new range of applications in whey processing as a means of demineralization instead of electrodialysis or ion exchange. The "Ultra-Osmosis" process developed by Filtration Engineering (United States) is used to treat "salty" whey. These cheese whey drippings may be 6% NaCl out of a total solids concentration of 12%. At present, cheese plants are not permitted to process salt drippings or blend with sweet whey, due to its high salt content (48). Membranes such as the Film-Tec NF-40 or Desal-5 operated at 1.5-2.5 MPa and 40-55~ can reduce the Na, K and Cl contents significantly without loss of other minerals and components. The salty whey is collected throughout the day and held at 52~ until the cheese-making process is completed. After centrifugation, the salty whey is concentrated to 50% of its original volume, followed by diafiltration at constant volume until conductivity reaches about 10-20% of the initial value, indicating that 80-90% removal of K or Na ions has taken place. The desalted whey is now further concentrated to 25% of its original volume, resulting in a net 95% removal of the salt. At this point the whey resembles sweet whey and it may be reintroduced into the regular whey stream for handling. To overcome flux decline during the above process, a single-step process can be done, where diafiltration is carried out adding water at half the rate that permeate is removed. This results in 90% demineralization when the initial volume is reduced to 22.5% of the original. USDA guidelines are now available for the "Ultra-Osmosis" process [48]. 9.3 FRUIT JUICES A N D EXTRACTS
There are three primary areas where membranes can be applied to the processing of fruit juices: (1) Clarification, e.g., in the production of sparkling clear beverages using microfiltration or ultrafiltration; (2) Concentration, e.g., using reverse osmosis to produce fruit juice concentrates of greater than 42~ (3) Deacidification, e.g., electrodialysis to reduce the acidity in citrus juices.
9.3.1 Clarification Clear single-strength fruit juices (e.g., from apples, pears, grapes, cranberries, pineapples, etc.) have traditionally been produced in batch operations,
9 - F O O D A N D BEVERAGE INDUSTRY APPUCATIONS
447
UNIT OPERATION FOR FRUIT JUICE
CONVENTIONAL PROCESS
SUSPENDED SOLIDS REMOVAL
Centrifugation
None
PECTIN/STARCH HYDROLYSIS
Enzyme Treatment
Not critical
COLLOID AND HAZE REMOVAL
Fining Treatment
ULTRAFILTRATION PROCESS
Diatomeaceous
FINING AGENT REMOVAL
Earth Filtration
FINAL FILTRATION
Polish Filtration
CLARIFIED JUICE
Yield Process time
80 - 94% 12 - 36 hours
95 - 99% 2 - 4 hours
Fig. 9.29.Manufactureof apple juiceby the traditional process (left) and the UF process (right). with a series of filtration/separation steps designed to remove suspended solids, colloidal particles, proteins and condensed polyphenols. This usually involved filter presses and large amounts of filter-aids such as bentonite a n d / o r diatomaceous earth (DE). Research in the late 1970s indicated that MF or UF could be used successfully to replace several of these operations [1]. Figure 9.29 compares traditional and UF processes for producing clear juices and Fig. 9.30 shows a typical schematic. UF has several advantages: - Clarification and fining is done in one step. While traditional juice requires the use of fining agents (bentonite, gelatin, etc.), e ~ e s (pectinase, amylase), centrifugafion and diatomaceous earth filtration that may take 12-36 hours, membrane cross-flow filtration avoids these steps to produce a clear and satisfactory product in 2-4 hours. - Increased juice yield. Juice recovery of 96--98% is typical without diafiltration or predilution. In contrast, conventional processes recover only 8094%. This increased recovery comes from the elimination of the DE and fining agent loss. A nominal 1% increase in recovery in a plant processing 350,000 liters per day can increase revenue by $150,000 per season. Elimination of filter-aid and filter presses. This alone can save about $0.02--0.06 per gallon of juice, and save the processing plant the troublesome disposal of the DE and fining agents. - Better product qualit7. The reliable and consistent removal of haze-forming components (suspended solids, colloidal particles, proteins and polyphenols) eventually translates into superior juice quality, typically less than 0.1-0.3 NTU (Nephelometric Turbidity Units) compared to the -
9 n FOOD AND BEVERAGEINDUSTRYAPPLICATIONS
448
Fig. 9.30. Typical schematic of a UF fruit juice plant producing clear apple juice [50].
2-5 NTU from conventional processing. However, higher flavor losses have been observed with polysulfone and polyamide UF membranes compared to conventional plate-and-frame filter presses for apple juice [49]. Enzyme usage is reduced 50-75%, depending on the juice. It can be eliminated altogether, although some pretreatment with enzymes help reduce membrane fouling and viscosity, resulting in higher flux and lower pumping energy. All these advantages result in higher profits for the UF process (Fig. 9.31). For example, a Cadbury-Schweppes' apple juice plant processing over 500,000 liters per day reported savings of $350,000 per year, due to the elimination of more than 350,000 kg per year of DE, a major reduction in labor costs and a 4% increase in yield [50]. -
9.3.1.1 Apple Juice The most work has been done with apple juice, starting with the pioneering work of Heatherbell et al. [51]. The method used for extraction has a profound effect on the suspended solids, and thus the yield (Fig. 9.32). After pressing, a depectinization step is recommended to decrease viscosity of the fluid and
9 - FOODAND BEVERAGEINDUSTRYAPPLICATIONS
449
0.0150 0.0025 Conventional Filtration ~J Membrane Filtration ,-.
0.0020
o
.~_ "~ Q.
0.0015
w r o ,.=.
_= (u
0.0010 4-J W O
o
0.0005
D.E.
Enzyme, Labor Gelatin
Maint.
Power D . E . Cleaning Disposal
Fig. 9.31. Cost advantages of cross-flow membrane filtration versus conventional filtration using diatomaceous earth (D.E.). Based on 1988 estimates [50].
COMMON METHODS OF JUICE EXTRACTION
9 Horizontal Basket-Press (Bucher-Guyer)
JUICE SUSPENDED SOLIDS LOW 0.5%
9 Hydraulic Press (Atlas Pacific) 9 Pneumatic Press (Willmes)
2% 9
Continuous Plate or Belt Press (Willmes, Schenk)
9 Screw Press (Jones, Reeves)
5%
9 Diffuser (DDS) HIGH
10%
Fig. 9.32. Common methods of juice extraction [50].
allow higher permeate flux. Figure 9.33 compares the effect of depectinization on flux for apple juice. Rao et al. [49] also observed almost a doubling of the flux as a result of depectinization with a Romicon 50K MWCO polysulfone hollow fiber membrane. The two most common modes of operation are batch and modified-batch (Fig. 9.30). Operation in batch mode is carried out until the centrifuged solids level in the retentate is 50-80%. If maximum sugar recovery is desired (e.g., if
450
9 - - FOOD AND BEVERAGE INDUSTRY APPLICATIONS
50
~
Juice
40
X U,.. 30 "0 0
m
z No treatment
10
o
I
J
I
10
20
30
,
,
I
9
50
70
-'~c~_=
90
Percent Centrifuged Solids
Fig. 9.33. Effect of pectinase enzyme treatment on apple juice flux with Romicon hollow fiber membranes [98]. juice is going to be concentrated), diafiltration m a y be done at constant volume until there is a volume of permeate with a solids content equal to the volume of the 50% solids concentrate obtained with UF. Padilla and McLellan [52] studied the influence of m e m b r a n e pore size on flux and other quality factors of UF apple juice (Table 9.7). In general, steady-state flux increased with pore size. However, turbidity and polyphenolic concentration also increased. After six m o n t h s storage at 18~ the UF juices processed with the 100K and 500K M W C O m e m b r a n e s s h o w e d large increases in turbidity. Permeate total solids and H u n t e r L values (a measure of the color) were not affected by pore size. TABLE 9.7 Effect of membrane molecular weight cut-off (MWCO) on ultrafiltration of apple juice [52] Molecular weight cut-off of membrane 10K Initial flux (LMH) Permeate solids (%) Turbidity (NTU): Initial After 6 months Total phenolics (mg 1-1) Hunter L values
28 12.39
50K
100K
500K
100 12.53
210 12.57
280 12.57
0.6
2.2 4.0 377 50.4
2.3 6.0 369 50.4
0.4 -
350 51.6
366 51.0
9 - - FOOD A N D BEVERAGE INDUSTRY A P P U C A T I O N $
451
Wu et al. [53] compared two polysulfone ultrafilters of 5,000 and 50,000 MWCO with a ceramic 0.1 micron microfilter. Flux was much higher with the ceramic membrane (110 LMH vs 28 LMH for the 5000 MWCO UF membrane). Although there was no appreciable sensory difference between MF and UF apple juice permeates, the MF juice was considerably darker and was slightly preferred by taste panelists. The metallic membrane developed by CARRE (Seneca, South Carolina) has been used for apple juice with an interesting variation [54]. The membrane (30K-40K MWCO) is zirconia "formed-in-place" on a porous sintered stainless steel substrate in tubes of 25 mm or more in diameter. Membranes can be created with varying molecular weight cutoffs or pore diameters. This "Ultrapress" process combines juice pressing and filtration in one step. Whole apples are pureed and treated with cellulase and pectinase at 50~ for 2 hours to reduce the viscosity of the feed. The resultant slurry is pumped through the tubular membrane system (over 70 m long) designed as a single-pass, once-through process. Pressures are typically 200-350 psi (1.3-2.4 MPa) with 1.25-inch diameter tubes, and 700-800 psi (4.5-5.4 MPa) with 1-inch tubes. Yields obtained were 80-85% with a single pass, which can be increased with multiple passes. The system has reportedly reduced processing costs by $0.026-$0.04 cents per liter [55].
9.3.1.2 Other Juices Among other juices, passion fruit juice has been studied by Yu et al. [56]. Surprisingly, even though they used a UF membrane (PCI BX6, 25K MWCO), over 80% of the flavor compounds were retained. Sugars and organic acids had a retention of 10--40%. Perhaps the high pressures (12 bar) and low temperature (20~ created a dynamic fouling layer that increased retention during processing. Retentivities of these compounds increased with the concentration ratio. Foulants on the membrane were identified as cellulose, hemicellulose, sugars, citric acid and pectin. Kirk et al. [57] studied the ultrafiltration of pear juice with hollow fibers. Membranes of different MWCOs (10K, 30K and 50K) had little influence on permeate juice color. Optimum operating conditions were 157 kPa pressure, 0.15 m/s, 50~ Permeate flux declined with the logarithm of the concentration. Kiwi fruit juice processing has been reported by Wilson and Burns [58]. A dramatic improvement in clarity was obtained, and it allowed the non-thermal sterilization of kiwi fruit juice. Storage for 6 months at 15~ resulted in only very slight deterioration as browning and ascorbic acid loss. Ultrafiltration of strawberry juice apparently has a detrimental effect on color and appearance of the product, due perhaps to a loss of anthocyanins by adsorption on the membrane [59]. Pouliot and Goulet [60] reported that maple
452
9 ---/KX)D AND BEVERAGE INDUSTRY APPLICATIONS
sap could be clarified with a 10K membrane, using pressures of 190-200 kPa. Hart et al. [61] used 0.45-micron ceramic microfilters with enzyme-treated apricot puree to obtain a sparkling, clear apricot juice at fluxes of 90-190 LMH. Concentrating the permeate subsequently by vacuum evaporation resulted in a concentrate with good retention of clarity, flavor and aroma.
9.3.2 Concentration Fruit juice concentration by reverse osmosis is potentially one of the largest applications of membrane technology. The major benefit of RO is that it diminishes thermal damage of delicate aroma components while reducing the amount of energy needed for removal of water.
9.3.2.1 Apple Juice. Early work by Merson and Morgan [62] with apple juice showed that cellulose acetate membranes showed good sugar retention, but aroma/flavor compounds permeated the membrane, which lowered the quality of the concentrate [63]. Aroma is determined by CvC6 alcohols, C4-~C8esters and C2-~6 aldehydes. Three compounds are especially important in providing apple-like characteristics: ethyl 2-methylbutyrate, hexanal and 2-hexenal. High osmotic pressure limits concentration to 20-25~ with conventional RO. Pectins contributed to fouling and viscosity which also affect plant performance. Thus apple juice RO is usually preceded by depectinization by enzymes and clarification (usually by UF), which then makes it one of the easiest liquids to process by RO [64]. Cleaning and restoration of capacity at the end of a process cycle is no problem. This suggests that spiral modules are probably the best design for this application. Polyamide RO membranes retained more of the flavors than cellulose acetate (Fig. 9.34; an overall 45% versus 23%) and also resulted in higher flux (Fig. 9.35). Conventional cellulose acetate membranes (with 97% salt rejection) had much higher flux than high-retention (99% salt rejection) CA membranes, but the flavor retention was much poorer. Table 9.8 shows typical feed and permeate analyses for apple juice concentrated by a polyamide composite membrane.
9.3.2.2 Orange Juice With orange and other citrus juices, many of the flavor compounds reside in an oil phase present in the juice in the form of an emulsion. Since they are sparingly soluble in water, flavor retention should be much better with orange juice than apple juice. Orange juice concentrates are today produced mostly by conventional multi-stage evaporation. Most of the citrus essences are stripped in the first effect, and in the later stages other compounds are destroyed or
453
9 - - F O O D A N D BEVERAGE INDUSTRY APPLICATIONS
60 tBB Polyamide (PA-99) o~ 50 - ~
Cell. Acetate 1CA-991
(~
O "5 40 -
i i
9~-
:
"
-~ 9 30
~..
I
-
i
20
~
lO
I
"\"~
~'~'~ N\\'s
0
"
.~e./.e~BI
~
,rtt,,/~e=te 8cet~te ,., %e~.eoe~
~ot~/~ete ~cetete
acetste
Fig. 9.34. Retention of flavor compounds after reverse osmosis of apple juice with a polyamide composite membrane (PA-99, Osmonics) and cellulose acetate membrane (CA-99, Osmonics). The retention index values indicate various flavor compounds: see Chua et al. for details [99]. TABLE 9.8 Analysis of apple juice feed and permeate from RO through a PCI AFC-99 tubular thin-film composite membrane [64]
Dry matter Sucrose Glucose Fructose Malic acid Citric acid Free amino acids Methyl-ethyl butyrate Butyl butyrate Hexyl acetate Total acidity (meq/1) pH
Feed (ppm)
Permeate (ppm)
Retention (%)
122,700 12,100 28,700 65,400 3,910 341 276.4 0.97 0.1 0.04
327 20.7 57.5 130 21.2 0.9 g.
2 1 0 0.06
0.11
o18
C o s t ($ p e r G a l l o n
olao
olso
Feed)
Fig. 9.38. Flavor-cost comparisons of orange juice manufactured by various processes [70].
An interesting variation of this theme (to reduce the net osmotic pressure difference across the membrane) is "direct osmosis". Milleville [74] describes a system which uses 2-inch diameter tubes, each 10 feet long, with RO membranes of 100 MWCO. The fruit juice flows in the tubes at 31~ while the osmotic agent (concentrated sugar solution) flows in the shell side at 45~ The difference in concentration on either side of the membrane results in a chemical potential difference that will cause the water to flow from the dilute side to the concentrated side. It is claimed that concentrates of 42-60~ can be produced by this method. The reported advantage of this system is that no transmembrane pressure is applied, which reduces energy consumption and reduces fouling. The diluted osmotic agent (sugar syrup on the shell side) can be reconcentrated or used within the plant. The economics of this process will, of course, depend heavily on the latter factor.
9.3.2.3 Tomato Juice Concentration of tomato juice presents a difficult problem, because it has a high pulp content (25% fiber) and a high viscosity (which behaves in a nonNewtonian manner). The rheological properties of the juice are affected by the method of juice manufacture. The break temperature, which is the temperature to which tomatoes are exposed after chopping, can give different levels of enzyme inactivation which, in turn, affects final viscosity. A cold break (at 65~ results in less inactivation of the natural enzymes, which results in high viscosity. Thus, RO-concentration of tomato juice is limited by both the osmotic pressure and the viscosity. If the fibers were separated, the remaining serum would behave as a water-like liquid. The usual concentration of natural tomato juice is 4.5-5~ Commercial
458
9 - - FOOD A N D BEVERAGE INDUSTRY APPLICATIONS
tomato sauces are 8-12~ and tomato pastes are 28-29~ Because of the fiber content and particle size, tubular modules are probably best; for example, little fouling has been reported with the PCI AFC-99 tubular membrane [75,76]. In addition, flux was unaffected by the feed velocity in the range 0.3-4 m s-1. This has been attributed to a "tubular pinch" effect, i.e., the solids are suspended in the middle of the flow channel, and thus away from the wall where the membrane is located. Rejection of natural tomato soluble solids was 9499%. Flux is 39.7 LMH at 72~ and 55.2 bar after 52 hours of operation, and 41 LMH at 78~ and 41.4 bar after 717 hours [76]. Tomato juice concentration using a dynamically formed zirconia membrane has been reported by Watanabe et al. [77]. The first RO plant for tomato juice has operated since 1984 with PCI AFC-99 tubular membranes, processing more than 250 tons per hour (during the season) of 4.5~ juice to 8~ Retention of organic acids (citric and L-malic), sugars (glucose, fructose), mineral ions (K, Mg, Na, PO4, C1) and free amino acids was excellent [78]. Some loss of low molecular weight volatiles (methanol, ethanol) were observed. The color was very good, and showed none of the browning normally associated with evaporation. This color quality is retained when the RO juice was evaporated to 28--30~ paste because of the reduced time in the evaporator. Despite aggressive cleaning regimes, this plant has operated in Italy for five seasons with the same set of membranes [64]. The original work was stimulated by potential energy savings. Thus further development work has been done to reach 15--20~ although direct RO may not be the most economical way of reaching this concentration. Using the combination of HR (high retention) and LR (low retention) membranes as with the "FreshNote" process has not been successful so far because the reblended pulp and serum concentrate separate out on standing [64].
9.3.2.4 Maple Syrup The interest in RO of maple syrup grew in the 1970s in response to increasing energy prices. Reverse osmosis is able to remove about 60% of water from the maple sap. The concentrate is then boiled in a conventional open pan evaporator to develop the characteristic color and flavor. For 90,000 gallons of maple sap, this results in a decrease of 33% in the processing cost compared to the all-thermal process [79]. The number of installations increased from less than 5 in 1980 to more than 100 today [80].
9.3.2.5 Other Juices Demeczky et al. [63] reported concentration of some other fruit juices. Sour cherries concentrated 2.6-fold at 6.0 MPa showed some losses of acid (14-24% depending on the membrane used); nevertheless, the taste and smell of product
9 ~ FOOD AND BEVERAGE INDUSTRY APPLICATIONS
459
was superior to that obtained by vacuum evaporation. Peach juice could be concentrated from 11 to 30.7%, with some losses of aroma components, acids and sugars. However, RO resulted in better taste than evaporation. Red currant concentration was carried out in two stages. Permeate of first stage was subsequently concentrated to give a final product of 27% solids. In this case, the re-diluted juice did not show any difference from the original single-strength juice, while the juice obtained by evaporation was of lower quality. Black currant juice gave the same sensory results as red currant; it could be concentrated from 11 to 30% (2.6-fold). Strawberry juice was concentrated in two stages to give a final product of 25.4% solids. In spite of color, aroma and sugars losses, panelists could not find significant differences between the rediluted concentrate and the original juice.
9.3.3 Electrodialysis Electrodialysis has potential applications in the deacidification of fruit juice~ but its commercial practice remains small. Conventional electrodialysis has been investigated by Adhikary et al. [81]. A special configuration of only anion-exchange membranes has been used [82], with alternating compartments containing the citrus juice and KOH. Since only anions are able to pass through the membranes, the net effect is the extraction of citrate ions from the juice and their replacement by OH ions from the KOH solution [83]. Energy requirements vary between 0.02-0.1 kWh/equivalent. Audinos et al. [84] studied the use of ED for manufacturing sweetening products from grapes.
9.4 PIGMENTS AND COLORANTS Natural colorants extracted with water from plant sources are usually about 0.1% concentration and are contaminated with a wide variety of dissolved compounds. Two major classes of water-soluble natural colorants used in foods are anthocyanins and betalaines. Anthocyanins are intensely colored, ~,'ater soluble compounds responsible for almost all the red and blue colors of flowers and fruits. Woo et al. [85] describe a process for extracting anthocyanins from cranberry pulp waste and recovering it by UF and RO. PeriUa ant_hocyanins have been recovered from spent brine by UF [86] and electrodialysis [87]. Betalaines are the red betacyanin and the yellow betaxanthin found in red beet, which is the source for commercial betanins. They are very heat-sensitive. Betacyanin (molecular weight 560) accounts for 75-95% of the total colorants. Red beet extracts contain 8-10% dissolved solids with 0.1-0.2% of betacyanin. Membrane applications with red beet juice have been reported by Bayindirli et al. [88], Behr et al. [89] and Lee et al. [90].
460
9 - - F O O D A N D BEVERAGE INDUSTRY APPLICATIONS
Water extracts of grape skins contain 4-6% dissolved solids and 0.08~.150% anthocyanins, the major anthocyanin being 3,5-diglycoside (molecular weight 655). Water extracts are treated by ultrafiltration to separate sugars and pectins. Diafiltration is carried out if higher recovery is desired, and the permeate is then concentrated by RO [91].
9.5 CONCLUSIONS
M e m b r a n e technology will continue to be applied on a large scale in the food industry. A l t h o u g h this review focused on selected industries, the potential is vast as s h o w n in Table 9.1. For example, reverse osmosis has not yet made a major penetration into the fruit juice industry. However, the United States harvest of oranges in the 1985-86 season was 7.5 million metric tons, of which approximately 82% was processed and marketed as frozen concentrate orange juice. Over 700,000 metric tons of apple juice is marketed every year in the United States alone. Annual tomato production in United States is 3,300,000 tons; about 80% is processed into tomato products. Some industries, e.g., wet corn refining and oilseeds, have only recently begun to apply this technology in their operations. Considering the vast a m o u n t s of water used, these industries m a y experience the greatest growth of m e m b r a n e applications in this decade. REFERENCES
1 Cheryan, M. 1986. Ultrafiltration Handbook. Technomic, Lancaster, PA. 2 Cheryan, M., Veeranjaneyulu, B.V. and Schlicher, E.R. 1990. Reverse osmosis of milk with thin-film composite membranes. J. Membr. Sci., 48: 103-114. 3 Kulozik, U. and Kessler, H.G. 1988. Permeation rate during reverse osmosis of milk influenced by osmotic pressure and deposit formation. J. Food Sci., 53: 1377-1347. 4 Abbot, J., Glover, F.A., Muir, D.D. and Skudder, P.J. 1979. Application of reverse osmosis to the manufacture of dried whole milk and skim milk. J. Dairy Res., 46: 663. 5 De Boer, R. and Nooy, P.F.C. 1980. Concentration of raw whole milk by reverse osmosis and its influence on fat globules. Desalination, 35: 201-211. 6 Cox, G.C. and Langdon, I.A. 1985. Economic evaluation of reverse osmosis for reduction in milk transport costs. Australian J. Dairy Technol., 40 (3): 113-117. 7 Bundgaard, A.G. 1974. Hyperfiltration of skim milk for ice cream manufacture. Dairy Industries, 39 (4): 119-122. 8 Iversen, E.K. 1980. Dairy Sci. Abstr., 42: 3326. 9 Sorbensen, J.J. 1980. Dairy Sci. Abstr., 42: 3382. 10 Pal, D. and M. Cheryan. 1987. Application of reverse osmosis in the manufacture of khoa. Process optimization and product quality. J. Food Sci. Technol., 24: 233-238. 11 Davies, F.L., Shankar, P.A. and Underwood, P.A. 1977. The use of milk concentrated by reverse osmosis for the manufacture of yoghurt. J. Soc. Dairy Technol., 30 (1): 23-28.
9 -- F.(X)DANDBEVERAGEINDUSTRYAPPLICATIONS
461
12 Guirguis, N, Versteeg, K. and Hickey, M.W. 1987. The manufacture of yoghurt using reverse osmosis concentrated skim milk. Australian J. Dairy Technol., 42(3): 75--78. 13 Dixon, B.D. 1985. Dairy products prepared from reverse osmosis concentrate. Market milk products, butter, skim milk powder and yoghurt. Australian J. Dairy Technol., 40(3): 91-95 14 Pal, D. and Cheryan, M. 1987. Membrane technology in dairy processing. Part 1. Reverse osmosis. Indian Dairyman, 39: 251-267. 15 Cheryan, M. 1989. PRO-CAL: a high-calcium, low-cholesterol milk produced by ultrafiltration. Unpublished report, University of Illinois, Urbana. 16 Watters, J.C., Rezvani, R. and Klein, E. 1989. Reduction of the lactose content of skim milk by continuous countercurrent cascade ultrafiltration. Separ. Sci. Technol., 24(5/6): 369-382. 17 Abrahamsen, R.K. and Holmen, T.B. 1980. Yogurt from hyperfiltrated, ultrafiltrated and evaporated milk and from milk with added milk powder. Milchwissenschafl, 35: 399-402. 18 Kosikowski, F.V. 1986. New cheese-making procedures utilizing ultrafiltration. Food Technol., 40 (6): 71-77,156. 19 Honer, C. 1990. Does ultrafiltration have a place on the farm? Dairy Field Today, 173 (3): 52. 20 Mehaia, M.A. and Cheryan, M. 1983. Coagulation studies of ultrafiltration-concentrated skim milk. Milchwiss., 38:708-710 21 Lawrence, R.C., Creamer, L.K. and Gilles, J. 1987. Texture development during cheese ripening. J. Dairy Sci., 70: 1748-1760. 22 Ryder, D.N. 1985. Use of membranes in the manufacture of hard and semi-hard cheeses. Desalination, 53: 129-133. 23 Agbevavi, D.R and Mayer, R. 1983. Production and quality of cheddar cheese manufactured from whole milk concentrated by reverse osmosis. J. Food Sci., 48: 642-643. 24 Parrott, D.L. 1990. The application of spiral-wound ultrafiltration membranes in the APV Sirocurd process for the continuous production of cheddar cheese. Proceedings, 1990 International Congress on Membranes and Membrane Processes, Vol. 1, pp. 265-266. 25 Qvist, K.B., Thomsen, D. and H6ier, E. 1989. Effect of ultrafiltered milk and use of different starters on the manufacture, fermentation and ripening of Havarti cheese. J. Dairy Res., 54: 437-446. 26 Mistry, V.V. and Kosikowski, F.V. 1984. Growth of lactic acid bacteria in highly concentrated ultrafiltered skim milk retentates. J. Dairy Sc/., 68: 2536-2543. 27 Patel, R.S., Reuter, H. and Prokopek, D. 1986. Production of quarg by ultrafiltration. J. Soc. Dairy Technol., 39: 27-31. 28 Maubois, J.L. and Kosikowski, F.V. 1978. Making Ricotta cheese by ultrafiltration. J. Dairy Sci., 61: 881. 29 Modler, H.W. 1988. Development of a continuous process for the production of ricotta cheese. J. Dairy Sci., 71: 2003-2009. 30 Pal, D. and Cheryan, M. 1987. Membrane technology in dairy processing. Part II. Ultrafiltration. Indian Dairyman,. 39 (8): 373-391. 31 Jameson, G.W. 1987. Manufacture of cheddar cheese from milk concentrated by ultrafiltration: The development and evaluation of a process. Food Technol. Australia, 39 (12): 56O-564. 32 Piot, P., Vachot, J.V., Veaux, M., Maubois, J.L. and Brinkman, G.E. 1987. Ecremage et epuration bacterienne du lait entier cru par microfiltration sur membrane en flux tangentiel. Technique Laitiere & Marketing. 1016: 42--46.
462
9 -- FOODANDBEVERAGEINDUSTRYAPPLICATIONS
33 Fauquant, J., Maubois, J.L. and Pierre, A. 1988. Microfiltration du lait sur membrane minerale. Technique Laitiere & Marketing, 1028: 21-23. 34 Van der Horst, H.C. and Hanemaaijer, J.H. 1990. Cross-flow microfiltration in the food industry. State of the art. Desalination, 77: 23,5-258. 35 Verier, C., Bennasar, M. and Tarodo de la Fuente, B. 1988. Study of the fouling of a mineral microfiltration membrane using scanning electron microscopy and physicochemical analyses in the processing of milk. J. Dairy Res., 55: 381--400. 36 Malmberg, R. and Holm, S. 1988. Low bacteria skim milk by microfiltration. North European Food Dairy J., 1: 75--78. 37 Olesen, N. and Jensen, F. 1988. Microfiltration. The influence of operating parameters on the process. Milchwissenschaft, 44:476-479 38 Maubois, J.L., Pierre, A., Fauquant, J. and Piot, M. 1987. Industrial fractionation of whey proteins. Int. Dairy Fed. Bull., 212:154-159. 39 Merin, U. and Cheryan, M. 1980. Factors affecting the mechanism of flux decline during ultrafiltration of cottage cheese whey. J. Food Process. Preserv., 4:183-198. 40 Kuo, K.P. and Cheryan, M. 1983. Ultrafiltration of acid whey in a spiral-wound unit: Effect of operating parameters on membrane fouling. J. Food Sci., 48:1113--1118. 41 Patocka, J. and Jelen, P. 1987. Calcium chelation and other pretreatments for flux improvement in ultrafiltration of cottage cheese whey. J. Food Sci., 52: 1241-1244. 42 Kim, S.H., Morr, C.V., Seo, A. and Surak, J.G. 1989. Effect of whey pretreatment on composition and functional properties of whey protein concentrate. J. Food Sci., 54: 25-29. 43 Rinn, J.C., Morr, C.V., Seo, A. and Surak, J.G. 1990. Evaluation of nine semi-pilot scale whey pretreatment modifications for producing whey protein concentrate. J. Food Sci., 55: 510-515. 44 Hanemaaijer, J.H. 1985. Microfiltration in whey processing. Desalination, 53:143-155. 45 Taddei, C., Aimar, P., Daufin, G. and Sanchez, V. 1986. Etude du tranafert de natiere lors de l'ultrafiltration de lactoserum doux sur membrane minerale./2 Lait, 66 (4): 371-390. 46 Aimar, P., Taddei, C., Lafaille, J.P. and Sanchez, V. 1988. Mass transfer limitations during ultrafiltration of cheese whey with inorganic membranes. J. Membr. Sc/., 38: 203-221. 47 Tong, P.S., Barbano, D.M. and Jordan, W.K. 1988. Permeate flux during ultrafiltration of whey: Influence of milk coagulant used for cheese manufacture. J. Dairy Sci., 71: 23422348. 48 O'Shea, D.P. 1990. Filtration Engineering, USA. Personal communication. 49 Rao, M.A., Acree, T.E., Cooley, H.J. and Ennis, R.W. 1987. Clarification of apple juice by hollow fiber ultrafiltration: fluxes and retention of odor-active volatiles. J. Food Sc/., 52: 375-377. 50 Koch Membrane Systems. 1988. Product literature. 51 Heatherbell, D.A., Short, J. and Struebi, P. 1977. Apple juice clarification by ultrafiltration. Confructa, 22(5/6): 157. 52 Padilla, O.I. and McLellan, M.R. 1989. Molecular weight cut-off of ultrafiltration membranes and the quality and stability of apple juice. J. Food Sc/., 54: 1251-1255. 53 Wu, M.L., Zall, R.R. and Tzeng, W.C. 1990. Microfiltration and ultrafiltration for apple juice clarification. J. Food Sc/., 55:1162-1163. 54 Thomas, R.L., Westfall, P.H., Louviere, Z.A. and Ellis, N.D. 1986. Production of apple juice by single-pass metallic membrane ultrafiltration. J. Food Sc/., 51: 559-563. 55 Swientek, R.J. 1987. Metallic membrane filtration. Food Processing, 46 (1): 74-75. 56 Yu, Z.R., Chiang, B.H. and Hwang, L. 1986. Retention of passion fruit juice compounds
9 -- FOODANDBEVERAGEINDUSTRYAPPLICATIONS
463
by ultrafiltration. 1. Food Sci., 51: 841-844. 57 Kirk, D.E., Montgomery, M.W. and Kortekaas, M.G. 1983. Clarification of pear juice by hollow fiber ultrafiltration. J. Food Sd., 48: 1663-1666. 58 Wilson, E.L. and Burns, D.J.W. 1983. Kiwifruit juice processing using heat techniques and ultrafiltration. I. Food Sci., 48:1101. 59 Rwabahizi, S. and Wrolstad, R.E. 1988. Effect of mold contamination and ultrafiltration on the color stability of strawberry juice and concentrate./. Food Sd., 53: 857--861. 60 Pouliot, G. and Goulet, J. 1987. Hollow fiber ultrafiltration of maple sap: a performance study. 1. Food Sd., 52: 1394--1396. 61 Hart, M.R., Ng, K.C. and Huxsoll, C.C. 1989. Microfiltration of enzyme-treated apricot puree. ACS Syrup. Ser., 405: 355-367. 62 Merson, R.L. and Morgan, A.I. 1968. Juice concentration by reverse osmosis. Food Technol., 22 (5): 97-100. 63 Demeczky, M., Khell-Wicklein, M. and Godek-Kerek, E. 1981. The preparation of fruit juice semi-concentrates by reverse osmosis. In Developments in Food Preservation. pp. 93-119. 64 Pepper, D. 1990. RO for improved products in the food and chemical industries and water treatment. Desalination, 77: 55-71. 65 Mats~ura, T., Baxter, A.G., Sourirajan, S. 1974. Studies on reverse osmosis for concentration of fruit juices. J. Food Sc/., 39: 706-711. 66 Watanabe, A., Kimura, S. and Kimura, S. 1978. Flux restoration of reverse osmosis membranes by intermittent lateral surface flushing for orange juice processing. J. Food Sc/., 43: 985-988. 67 Peri, C. 1974. Concentration of orange juice by reverse osmosis. Sci. Tec. Degli Alimenti, 4 (1): 43-47. 68 Medina, B.G. and Garcia, A. 1988. Concentration of orange juice by reverse osmosis. J. Food Process Engr., 10: 217-230. 69 Braddock, R.J., Nikdel, S., and Nagy, S. 1988. Composition of some organic and inorganic compounds in reverse osmosis-concentrated citrus juices. J. Food Sc/., 53: 508-512. 70 Cross, S. 1988. Achieving 60~ with membrane technology. Presented at the 49th Annual Meeting, Institute of Food Technologists, New Orleans, June 19-22. 71 Walker, J.B. 1990. Membrane process for the production of superior quality fruit juice concentrates. Proceedings, 1990 International Congress on Membranes and Membrane Processes, Vol. 1, pp. 283-285. 72 Watanabe, A., Nabetani, H., Nakajima, M., Ohmori, T., Yamada, Y. and Isiguro, Y. 1990. Development of multi-stage RO combined system (MRC) for high concentration of apple juice. Proceedings, 1990 International Congress on Membranes and Membrane Processes, Vol. 1, p. 282. 73 Koseoglu, S.S., Lawhon, J.T. and Lusas, E.W. 1990. Use of membranes in citrus juice processing. Food Technol., 44 (12): 90-97. 74 Milleville, H.P. 1990. Direct osmosis concentrates juices at low temperature. Food Processing, 51 (1); 70-71. 75 Pepper, D., Orchard, A.C.J. and Merry, A.J. 1985. Concentration of tomato juice and other fruit juices by reverse osmosis. Desalination, 53:157-166. 76 Merlo, C.A., Rose, W.W., Petersen, L.D., White, E.M. and Nicholson, J.A. 1986. Hyperfiltration of tomato juice. Pilot-scale high temperature testing. J. Food Sc/., 51: 403--407. 77 Watanabe, A. Ohtani, T., Kimura, S., Kimura, S. 1982. Performance of dynamically formed zirconia-PAA membrane during concentration of tomato juice. Nippon Nogei
464
9 m FOODANDBEVERAGEINDUSTRYAPPLICATIONS
Kagaku Kaishi, 54: 339-344. 78 Gherardi, S., Bazzarini, R., Trifiro, A., Voi, A.L. and Palamas, D. 1986. Pre-concentration of tomato juice by reverse osmosis. Int. Fruchtstafl-Union, Wiss.-Tech. Komm. (Berlin),. 19:241-252. 79 Sendak, P.E. and Morselly, M.F. 1984. Reverse osmosis in the production of maple syrup. Forest Products J., 34(7/8): 57-61. 80 Gekas, V., Hallstrom, B. and Tragardh, G. 1985. Food and dairy applications: The state of the art. Desalination, 53: 95-127. 81 Adhikary, S.K., Harkare, W.P., Govindan, K.P. and Nanjundaswamy, A.M. 1983. Deack~,fication of fruit juices by electrodialysis. Ind. J. Technol., 21 (March): 120-123. 82 Smith, R.N. and Lacey, R.E. 1982. Electromembrane process for the food industry. Proc., Scientific Conference, Corn Refiners Association, Lincolnshire, Illinois, June 16-18. pp. 91-118. 83 Lopez-Leiva, M.N. 1988. The use of electrodialysis in food processing. Part 2. Review of practical applications. Lebens. Wiss. Technol., 21:177-182. 84 Audinos, R., Lurton, L. and Moutounet, M. 1985. Advantage of electrodialysis for manvfacturing sweetening products from grapes. Csi. Aliments, 5 (4): 619-637. 85 Wo~ A., Von Elbe, J., and Amundson, C.H. 1980. Anthocyanin recovery from cranberry pulp wastes by membrane technology. J. Food Sc/., 45: 875--879. 86 Chung, M.Y., Hwang, L.S. and Chiang, B.H. 1986. Concentration of perilla anthocyanins by ultrafiltration. J. Food Sci., 51:1494-1496. 87 Lin, S.S., Chiang, B.H. and Hwang, L.S. 1989. Recovery of periUa anthocyanins from spent brine by diafiltration and electrodialysis. J. Food Engr., 9: 21-34. 88 Bayindirli, A., Yildiz, F. and Ozilgen, M. 1988. Modelling of sequential batch ultrafiltration of red beet extract. J. Food Sc/., 51: 369-372. 89 Behr, N., Goebel, G. and Pfeiffer, H. 1984. Red beet juice concentrate with improved neutrality and stability. Ger. Offenbach. DE 3,229,345. 90 Lee, Y.N., Wiley, R.C., Shen, M.J. and Schlimme, D.V. 1982. Purification and concentration of betalaines by ultrafiltration and reverse osmosis. J. Food Sc/., 47: 465-471. 91 Philip, T. 1984. Purification and concentration of natural colorants by membranes. Food Technol., 38 (12): 107-108. 92 Maubois, J.L. 1989. Paper presented at North American Membrane Society annual meeting, Austin, TX. June 1989. 93 Phillips, D.J. 1989. Application of membrane processing to cheese manufacture. In: Process Engineering in the Food Industry: Developments and Opportunities (R.W. Field and J.A. Howell, eds). Elsevier, New York. pp. 249-257. 94 Hiddink, J., R. De Boer and P.F.C. Nooy. 1980. Reverse osmosis of dairy liquids. J. Dairy Sci., 63:204-214 95 Chiang, B.H. and M. Cheryan. 1986. Ultrafiltration of skimmilk in hollow fibers. J. Food Sci., 51: 340-344. 96 Dejmek, P. 1986. Milk saving in cheesemaking by ultrafiltration. Milchwissenschaft, 41: 686-688. 97 Plett, E. 1989. The constant pressure difference method for microfiltration. Presented at the Third International Conference on Fouling and Cleaning in Food Processing, Prien, Bavaria, W.Germany, June 4-7. 98 Romicon,Inc. 1988. Personal communication. 99 Chua, H.T., Rao, M.A., Acree, T.E. and Cunningham, D.H. 1988. Reverse osmosis concentration of apple juice; flux and flavor retention by cellulose acetate and polyamide membranes. J. Food Process Engr., 9: 231-245.
9 - FOODAND BEVERAGEINDUSTRYAPPLICATIONS
463
100 Cheryan, M., Sarma, S.C. and Pal, D. 1987. Energy considerations in the manufacture of khoa by reverse osmosis. Asian J. Dairy Res., 6: 143-153. 101 Marshall, K.R. and Harper, W.J. 1988. Whey protein concentrates. Int. Dairy Fed. Bull., 233: 22-32. 102 Batchelder, B.T. 1987. Electrodialysis applications in whey processing. Int. Dairy Fed. Bull., 212: 84-90. 103 Rajagopalan, N. and Cheryan, M. 1991. Total protein isolates from milk by ultrafiltration: Factors affecting product composition. J. Dairy Sci., 74: 2435-2440. 104 Rajagopalan, N. and Cheryan, M. 1991. Process optimization in ultrafiltration. Flux-time considerations in the purification of macromolecules. Chem. Engr. Comm., 106: 57-69.
Membrane Separations Technology. Principles and Applications Edited by R.D. Noble and S.A. Stern 9 1995, Elsevier Science B.V. All fights reserved
Chapter 10
Membrane contactors Bradley W. Reed, Michael J. Semmens and Edward L. Cussler Hoechst Celanese Corporation, Separations Products Division, Charlotte, NC 28273, USA
10.1 W H A T ARE M E M B R A N E C O N T A C T O R S ?
Membrane contactors are a new way to accomplish separation processes like gas absorption and liquid-liquid extraction. They promise dramatically improved performance over conventional dispersed-phase contactors. They typically reduce the volume of equipment required for gas absorption by more than twenty times, and the volume of equipment for liquid extraction by more than five hundred times. In this section, we first want to describe what these contactors are and how they work. In Section 10.2, we want to give a basic mathematical description of the contactors, stressing the simple case of dilute solutions. We discuss the practical issues to be considered in contactor design, and the advantages and disadvantages of membrane contactors in Section 10.3. In Section 10.4, we catalogue specific examples as a guide to future designs, and finally, in Section 10.5, we present a bibliography of published applications. What are membrane contactors? The easiest way to see is by means of the specific example of antibiotic extraction. Conventionally, antibiotics are produced by fermentation. The fermentation beer, which is the feed, originally contains the antibiotic and the microorganisms. The beer is filtered to remove the microorganisms; the filtrate is then extracted with an organic solvent, frequently a higher alcohol, an alkyl acetate or methylene chloride. The organic extract contains more concentrated antibiotic. This valuable solute is often further purified by additional extraction, by adsorption and by crystallization. The extractions can often be the most expensive step in this chain.
468
10--- MEMBRANE CONTACTORS
Par.allel Fl,,ow Conta..ctor ......
Cross Flow Contactor .,,
i
i.,
,.
.
i
i
|
ill
Fig. 10.1.Commercial hollow-fiber membrane contactors. A membrane contactor can be used effectively for this extraction. Membrane contactors are typically hollow-fiber modules like those shown schematically in Fig. 10.1. Filtered beer is fed to the module; and fresh solvent is fed countercurrently. Antibiotic is extracted from the beer, diffuses across the membrane and into the bulk solvent phase. The result is an extract containing much of the antibiotic. The contactors in Fig. 10.1 have three major advantages and one potential disadvantage over conventional equipment. The advantages are: (1) High surface area per volume. Membrane contactors can supply twenty to one hundred times more surface area per volume than conventional equipment. (2) Complete loading. Membrane contactors give this large area even at small flow rates where conventional packed towers are compromised. (3) No flooding. Membrane contactors can reduce or avoid solvent and raffinate entrainment, which can inhibit both packed towers and mixer-settlers.
10---MEMBRANECONTACTORS
469
The disadvantage is potentially serious: (4) Slower mass-transfer. The membrane may retard mass-transfer between the feed and the solvent. This typically occurs only when the resistance of the contained phase in the membrane pores is significant compared to the bulk phase resistances. The success of membrane contactors depends on the three advantages being more important than the disadvantage. This discussion shows that the membrane must be carefully chosen to retard the mass-transfer as little as possible. In practice, this choice has not been a major problem. The choice has suggested two heuristics. First, choose the membrane so that it is wet by the fluid in which the solute of interest is "more" soluble. For example, if the antibiotic partitions more strongly into the solvent vs. water, then choose a membrane wet by the solvent. If the antibiotic partitions more strongly into the aqueous feed than into the solvent, then choose a membrane wet by water. The second heuristic is to choose a membrane which hinders solute diffusion as little as possible. In many cases, this has been realized by choosing a microporous membrane. Such a membrane is wet by either the solvent or the feed; in either case, solute diffuses easily through the pores. Such a microporous membrane does risk convective flow through the pores. Such flow, a significant risk, can usually be eliminated either by applying a static pressure or by using gel coated hollow-fibers, solutions described in Section 10.3. Thus membrane contactors are usually hollow-fiber modules offering fast mass-transfer because of their large surface area per volume. They avoid problems of loading and flooding, but can slow mass-transfer in some applications. Their performance and design are detailed in the remaining sections of this chapter. Before begLnning this section, we want to make two more points about these devices. First, membrane contactors are unusual in this book in that the membrane's chemistry is relatively unimportant. In reverse osmosis, the membrane's chemistry controls salt rejection, flux rates and chlorine resistance, factors which dominate performance. In gas separation, membrane chemistry controls oxygen/nitrogen selectivity, which drives the economic potential of this most important of membrane separations. But for membrane contactors, the membrane's chemistry should "not" influence mass-transfer. The goal for contactors is a membrane whose effect is not negative, rather than a membrane "whose effect is positive because it is selective. The second interesting point about membrane contactors involves their comparison with conventional separation equipment. This conventional equipment usually aims at achieving some kind of fluid-fluid contact. Most commonly, this contact tries to achieve a large surface area per volume. In all these conventional cases, the shape of the fluid-fluid contact is an accident of nature;
470
10 ~ M E M B R A N E
CONTACTORS
we accept these accidental interfaces between fluids because we have no choice. Membrane contactors open a new horizon because they can give us any shape of fluid-fluid interface that we want. They can provide large surface area per volume which has been our past goal. This interfacial contact area is achieved without dispersion and, as a result, is controllable. New designs entering the marketplace utilize a "crossflow" configuration on the shellside (outside the hollow-fiber) of the device, nurturing Taylor vortices to accelerate mass-transfer. This raises a new question: what shape of fluid-fluid interface is best for mass-transfer? We do not know, but we look forward to using membrane contactors to find out.
10.2 QUANTITATIVE DESCRIPTION OF CONTRACTORS In this section, we present the basic mathematical description of membrane contactors. This description is common with separation equipment grouped as "differential contactors". As such, the general equations and appropriate coefficients are given in most textbooks on unit operations. We do not re-derive the equations here; instead, we give basic results specifically useful for membrane contactors. We will restrict our presentation to dilute solutions because the equations are much simpler algebraically and because the concentrated parallels are in those same textbooks. 10.2.1 K e y E q u a t i o n s
When we consider using a membrane contactor, we often want to know how large a unit we need for a specific job, or how good a separation we can achieve with a particular module. Answering these questions commonly depends on the basic equation for any dilute absorption or extraction L = HTU . NTU
(10.1)
where L is the module length, HTU is the height of a transfer unit, and NTU is the number of transfer units. The NTU are roughly parallel to the number of equilibrium stages in distillation, or the number of mixer-settlers in extraction. However, the NTU do not refer to the equilibrium limit commonly approached in staged distillation or extraction. In the same sense, the HTU roughly parallel the length of a distillation stage, or the depth of a mixer-settler. The HTU are even more parallel to the "height of an equivalent theoretical plate" often used to describe analytical chromatography. Alternatively, one can think of the NTU as signaling the difficulty of the separation and the HTU as measuring the efficiency of the equipment. Th~ way of thinking has dominated the design of separation processes for fifty years.
471
10 - - MEMBRANE CONTACTORS
Commonly, Eq. (10.1) is expressed in terms of the operating parameters in the following form:
QsK L=
QsK
[ Q-1
In ~ _ Kxl
(10.2)
The quantity in square brackets is the HTU, that in braces is the NTU and: Vois the superficial feed velocity; k is the overall mass-transfer coefficient; a is the surface area of membranes per volume of bed; Qs,QF are the solvent and feed flows, respectively; K is the partition coefficient, the concentration at equilibrium in the solvent phase divided by that in the feed; and x, y are the solute mole fractions in the feed and solvent, respectively. The subscripts "o" and "l" refer to the feed inlet and the raffinate outlet, respectively. The quantity (QsK/QF) often appears in expressions like these, and is sometimes called the "absorption factor" or the "extraction factor". Expressions like Eq. (10.2) are the cornerstone of any analysis of mass-transfer. Equation (10.2) is limited to dilute solutions undergoing countercurrent contacting. In countercurrent contacting, the feed and solvent flow past each other in opposite directions. Because countercurrent contacting gives the most complete separation, it is most frequently used. Occasionally, crossflow is used, in which solvent flows perpendicular to the feed. Newer designs utilize a baffled design to couple crossflow with a countercurrent flow profile. Rarely is cocurrent processing used, in which feed and solvent flow in the same direction. We will not discuss crossflow and cocurrent contacting here, although relations similar to Eq. (10.2) are easily derived for these cases. One limit of Eq. (10.2) that is especially useful occurs when the extracting solvent flow is in excess. In this case, Eq. (10.2) becomes (10.3) or Yl
Cl
_ e-kaL/Vo
(10.4)
Yo Co in which Co and Cl are the inlet and outlet concentrations of solute in, for example, moles/(dm) 3. While this limit occurs infrequently in industrial practice, its algebraic simplicity makes it an easy way to learn about contactor design. We will use it in the simplest examples given in Section 10.4. Equations (10.1)-(10.4) allow the design of membrane contactors for separating solutes from dilute solutions. In most cases, most of the quantifies in these
472
10 ~ M E M B R A N E C O N T A C T O R S
equations will be specified. For example, we may know how much we want to extract and how much feed and solvent flow we want to use. We can then discover how big a membrane contactor we need if we know how to find the mass-transfer coefficient k. But what is the mass-transfer coefficient? We need its value to design our contactor. As a result, we next turn to its estimation.
10.2.2 Mass-Transfer Correlations Mass-transfer coefficients describe how fast membrane contactors function. An engineering concept, they are buried within mass-transfer textbooks and so can be a hard concept for many to understand. As such, they have an undeserved reputation for being difficult. Mass-transfer coefficients can be tricky because they sometimes involve messy unit conversions, but they are not inherently difficult. The easiest way to understand mass-transfer coefficients is to return to Eq. (10.3) given above. This equation gives the concentration in a membrane contactor as a function of the residence time (L/vo) in that contactor. As a result, the product (ka) is just a rate constant characterizing absorption or extraction. As such, this product is much like a first order chemical reaction rate constant, with the familiar units of reciprocal time. As such, (ka) is closely related to the idea of a reaction half-life in nuclear chemistry or to the idea of a decimal reduction time in microbiology. These characteristics of the mass-transfer coefficient have two implications. The first, less important implication is that membrane contactors separate with a declining efficiency. If I m of contactor can extract 90% of the solute, then 2 m will extract 99%, 3 m, 99.9%, and so on. Strictly speaking, such behavior is predicted only by the limit represented by Eq. (10.3); in practice, such behavior is qualitatively characteristic. The second, more important implication of these mass-transfer coefficients is the hidden difference from chemical reaction rate coefficients. Chemical reaction rate coefficients obviously depend on chemistry but are independent of fluid flow. For example, the chlorination of benzene and of hexane proceed with very different rates, but both rates are independent of stirring velocity. In contrast, mass-transfer coefficients depend on fluid mechanics as well as on chemistry. The air stripping of benzene and hexane from water depends not only on their vapor pressures, but also on the air and water velocities. This dependence on physical quantities is why in medicine, a mass-transfer coefficient is sometimes called "the velocity of diffusion". To estimate mass-transfer coefficients, we must first recognize that the overall coefficient k in Eqs. (10.2) and (10.3) includes contributions from the fluids flowing on either side of the membrane and the membrane itself.
10 ~
MEMBRANE
CONTACTORS
1 1 1 1 k = k(feed) + k(membrane ) + Kk(solvent)
473
(10.5)
This relation is usually justified by drawing an analogy with Ohm's law. The first term (1/k) represents the overall resistance to mass-transfer. This equals the sum of the resistances due to the fluid inside the feed, the membrane itself, and the solvent, which are the three terms on the right hand side. Thus Eq. (10.5) says that the overall resistance is the sum of the three resistances in series. The expression is slightly complicated by the partition coefficient K, which defines the distribution of the solute between the feed and the solvent at equilibrium. K is incorporated so that the mass-transfer may be expressed in terms of the solute concentration in the phase of interest. In this case Eq. (10.4) is written in terms of the concentrations in the feed. We must now estimate the three terms in Eq. (10.5). Correlations for doing so, given in Table 10.1, are best known for hollow-fibers, which are the form of membrane contactor used most commonly and stressed in this review. These correlations are sometimes based on theory, but are more commonly determined from collections of experimental results. They are best grouped as those without chemical reaction and those with chemical reaction. If the membrane is porous the membrane resistance will depend upon which phase wets the membrane; and if it is nonporous, the partition coefficient between the phase of interest and the membrane must be incorporated. The equations in Table 10.1 for the membrane give the effective mass-transfer coefficient when mass-transfer is expressed in terms of feed concentration. Corresponding relations for the opposite case are easily found by switching the definition of the feed and the solvent. In doing so, however, we must be careful to also change the definition of the partition coefficient.
(a) Correlations Without Chemical Reaction The correlations summarized in Table 10.1 merit discussion: Eq. A, given for inside the hollow-fiber, is by far the best established. Originally derived theoretically, it has been accurately checked with a wide variety of experiments in liquids. It is also consistent with related heat transfer experiments, which differ only in replacing the factor of 1.62 with the factor of 1.86; we suspect the higher heat transfer factor is due to free convection. Equation E, derived experimentally, has not been as completely checked for gases, and shows some sign of failing at low flow. Equations B, C and D, given for transport across the membrane, represent three different possible membranes. In Eq. B, the membrane is nonporous; past examples of such membranes include those used for kidney dialysis. Such membranes are unusually stable, even when feed and solvent flows are erratic. Their disadvantage is that their diffusion coefficient and their partition coefficient may be small and cause an unnecessarily high membrane resistance. Still,
474
1 0 - MEMBRANE CONTACTORS
TABLE 10.1 Mass-transfer correlations for membrane contactors Basic situation
Correlation
Definitions
Remarks
D = diffusion coefficient d ---fiber diameter v = actual feed velocity L = module length K' = equih'brium concentration in membrane divided by that in feed 1 = membrane thickness 1---membrane thickness r = void fraction/tortuosity 1= membrane thickness K - partition coefficient (cf. Eq. 10.2) r = void fraction/tortuosity
The most accurate estimate
Without Chemical Reaction
(A) Inside Fiber
kd
(B) Across nonporous membrane
k-
(C) Porous membrane wet by feed
k=
(D) Porous membrane wet by solvent
k=
(E) Outside Fiber Parallel How
(F) Perpendicular How "Crossflow"
fd2v'~/3 , 9
DK" 1
D/~ 1
_~(~)
D is the value in the membrane
The factor ~/~ is often about 0.1 The key is often the value of K
M. lde2vo10"80/DI'~ de = equivalent diameter - f f = 1.3 L-~'-v) Vo = superficial velocity L -- module length v = kinematic viscosity Probably reliable kd (dv.~ d = fiberdiameter ~-= 1.4[--~-J Vo = superficialvelocity if no channeling across fibers
With Chemical Reaction
(G) Fast Reaction
k = ~RD
(H) Instantaneous Reactions
k' = k 1 + n[solvent])
I [reas;ent]~l
kR = reaction rate coefficient k' = coefficient with reaction k = coefficient without reaction
Can often apply to non-first order reactions Reaction so fast that reactants do not coexist
t h e y m e r i t m o r e a t t e n t i o n t h a n t h e y h a v e r e c e i v e d to date. E q u a t i o n s C a n d D a r e for fluid-filled p o r o u s m e m b r a n e s a n d t h u s are a f f e c t e d b y t h e m e m b r a n e ' s v o i d f r a c t i o n r a n d t o r t u o s i t y z. V o i d fractions r a n g e f r o m 0.2 to 0.9 a n d c l u s t e r a r o u n d 0.35; t o r t u o s i t i e s are c o m m o n l y a r o u n d 2 to 3, b u t c a n r a n g e as h i g h as ten. T h u s t h e factor (~/z) is u s u a l l y a r o u n d 0.1, t h o u g h v a l u e s as h i g h as 0.8 a n d as l o w as 0.03 o c c a s i o n a l l y occur.
10 - - M E M B R A N E C O N T A C T O R S
475
Decreases in mass-transfer due to void fraction and tortuosity can often be avoided by carefully choosing a membrane wet by feed or by solvent. For gas transfer applications using an aqueous feed, a hydrophobic membrane is preferred. Diffusion resistance in gas-filled pores is negligible compared to the liquid-phase resistance. For a hydrophilic solute in solvent extraction applications, we choose a hydrophilic membrane, hoping that k(membrane) will be much larger than k(solvent), and so leave the mass-transfer unaltered (cf. Eq. (10.4)). For a hydrophobic solute, we choose a hydrophobic membrane, hoping that a larger K will increase k(membrane) beyond k(feed). These hopes, based on the choice of membrane properties, frequently are justified by experiment. In passing, we should note that the size of any membrane pores does not explicitly appear in Eqs. B, C and D. It does appear implicitly through the diffusion coefficient. The effects on the diffusion coefficient can be large for large solutes in nonporous membranes, and may be significant for diffusion in gas-filled pores where Knudsen diffusion is important. In many cases with liquid-filled membrane pores, the effect of pore size is minor. We next return to mass-transfer outside the fibers, described by Eq. E. This equation is the least reliable of any in Table 10.1 because the experiments on which it is based are often compromised by channelling and backmixing outside the fibers for "parallel-flow" (axial flow along the outside of the fibers) contactors. Quarrels over the factor 1.3, especially its variation with void fraction, will probably continue to be fruitless. At present, we can only recommend that this result be used for initial estimates. Eq. F, for flow perpendicular to the fibers, is a sound start, but it needs extension to modules with helically and spirally arranged fibers. Such promising fiber bundle designs will certainly receive close attention in the future. (b) Correlations with Chemical Reaction Two final equations in Table 10.1 deal with the effect on mass-transfer of chemical reactions. Because this difficult subject is detailed elsewhere, we include these equations largely as a reminder of the increases in mass-transfer which reaction can cause. Still, we want to make two points about these equations which help understand both the literature and the examples given below. Chemical reactions affect mass-transfer when their kinetics are rapid. These rapid kinetics are commonly discussed in terms of two limits, "fast" and "instantaneous". At first glance, these two limits might seem redundant: after all, surely an "instantaneous" reaction is "fast". While this may be true in popular usage, it is not true in this case. A "fast" reaction is one in which the chemical kinetics influence mass-transfer, but are not so rapid that the reagents can not coexist. In this case, the Hatta number must be large, i.e.:
476
10- MEMBRANECONTACTORS
.~lkRD " k >>1
(10.6)
One common example occurs during the mass-transfer of chlorine into water, where the chlorine reacts to produce hypochlorous and hydrochloric adds. In this case, dissolved chlorine and water can locally coexist, even though they later react. In contrast, an instantaneous reaction is so rapid that the reagents can not coexist. One good example is the absorption of hydrogen sulfide in aqueous sodium hydroxide to produce sodium bisulfide. Near the gas-water interface, dissolved H2S is present, but hydroxide is not. In the bulk aqueous solution, hydroxide exists, but dissolved H2S does not. Between these two regions, there is a reaction front at which the reaction occurs; but away from this front, both reagents never coexist. Many acid-base reactions are instantaneous, but not all. Carbon dioxide absorption is often an exception. To see how these limits can be distinguished experimentally, we again turn to a specific example, detailed in one of the problems below. Imagine air containing hydrogen cyanide gas (prussic acid) is being fed on the shell side of hydrophobic hollow-fibers and an aqueous sodium hydroxide solution is fed to the fibers' lumen. The prussic acid will diffuse out of the air and across the fibers' gas-filled pores to react in the aqueous stream: HCN + NaOH ~ NaCN + H20
(10.7)
We want to use Table 10.1 and some experiments to determine the step controlling this process. We expect the mass-transfer in the liquid will be the slowest step and hence control the process. In other words, we expect the overall coefficient k will approximately equal that within the fiber lumen. Without reaction, this coefficient would be, from Eq. A,
k = 1.62 -~-
~-~-j
(10.8)
If the reaction is instantaneous, it will be
D ~d2v'~l/8{ [NaOH] } k=1.62--~(-~j 1+ [HCN]
(10.9)
where [NaOH] is the concentration of sodium hydroxide in the bulk liquid, and [HCN] is the concentration of prussic acid in pure water at equilibrium with the local prussic acid partial pressure. Because this concentration ratio is often much greater than one, the correction for instantaneous reaction, given in the braces of Eq. (10.9), is often major.
10- MEMBRANECONTACTORS
477
Alternatively, if the reaction is fast, the results are very different. The reaction rate r for the reaction in Eq. (10.7) is r = {kR[NaOH] } [HCN]
(10.10)
When the hydroxide is in excess, the quantity in braces is nearly constant and the reaction is effectively first order. From Eq. G, we then have k = ~kR[NaOH]D-
(10.11)
This result is a sharp contrast with that for the instantaneous reaction given in Eq. (10.9). For that case, k depends on the velocity v, varies linearly with the hydroxide concentration and is unaffected by chemical kinetics. In the fast reaction case in Eq. (10.11), the mass-transfer coefficient is independent of the velocity (v) and varies with the square root of the hydroxide concentration and is a function of chemical kinetics. These mass-transfer correlations, both with and without chemical reactions, can serve as a basis for analyzing and designing membrane contactors. How this is done is discussed in detail in the next two sections.
10.3 PAST EFFORTS Applications utilizing membrane contactors, which are covered in this section, fall in one of four basic categories: (i) gas/liquid mass-transfer using porous membranes; (ii) gas/liquid mass-transfer using nonporous membranes; (iii) liquid/liquid mass-transfer using porous membranes; (iv) liquid/liquid mass-transfer using nonporous membranes. Such processes are referenced in literature using a variety of terms such as membrane gas transfer, pervaporation, immobilized gas membranes, membrane distillation, membrane extraction, perstraction, immobilized liquid membranes, supported liquid membranes, contained liquid membranes and facilitated transport membranes. A catalogue of published applications is presented in the bibliography at the conclusion of this chapter. The bibliography is not intended to be exhaustive, but provides a listing to assist the reader in locating prior work related to a specific separation of interest. The advantages and disadvantages of using membrane contactors in these separations are discussed at length below.
10.3.1 Advantages of Membrane Contactor$ Membrane contactors provide a novel means of accomplishing gas/liquid
4'/8
1 0 - MEMBRANECONTACTORS
and liquid/liquid separations. Separation may be accomplished readily without having to mix the two phases intimately. In contactors using a porous membrane, the membrane simply acts as a barrier between the phases and does not impart any additional selectivity to the separation beyond that dictated by the equilibrium chemistry between the two phases. This equilibrium is typically quantified by the Henry's Law constant for gas/liquid systems or a distribution coefficient for liquid/liquid systems. In contactors using a nonporous membrane, the membrane may be selective because the solutes must partition into, and diffuse through, the solid membrane barrier. Both the partition coefficient K' and the diffusion coefficient in the membrane phase can determine the rate of solute transport across the membrane. The requirement of the solute to "permeate" the polymer membrane is evidenced by the name given to such processes as pervaporafion and pertraction. Just as in gas separations, a nonporous polymer membrane which enhances selectivity decreases the flux across the membrane. Aside from the enhanced selectivity possible with nonporous membranes, when should one consider the use of membrane contactors? The advantages of using membrane contactors are:
(a) High Surface Area per Volume The efficiencies of conventional dispersed-phase contactors are typically expressed by their overall mass-transfer coefficient multiplied by the surface area per volume k.a. The area is key. The more interfacial area a contactor provides between phases, the more efficient the contactor becomes, and the smaller its required size for a given separation. Typical values for surface area per volume supplied by various contacting devices are listed below: TABLE 10.2 The specific surface areas of different contactors Contactor
Surface area per volume (ft-1)
Free dispersion columns
1-10 10-100 50-150 500-2000
Packed/trayed columns Mechanically agitated columns Membranes
Clearly, membrane contactors provide up to several orders of magnitude more surface area per volume than conventional contactors. For hollow-fiber contactors, the surface area provided per volume is directly influenced by the fiber diameter. As the hollow-fiber diameter is decreased, the surface area that may be housed within a given volume of contactor increases.
~o-
MEMBRAt~CONTACrO~
479
(b) No Loading and Flooding Limitations As membrane contactors operate without phase dispersion, independent adjustment of the feed and solvent fluids is possible without constraint. The membrane provides a fixed interfacial area that is independent of fluid mechanics. Thus flooding, the entrainment of the dispersed phase at high continuous phase flows, is eliminated and much higher capacities are possible. Conversely, complete loading is achieved even at low flow conditions.
(c) Reduction of Dispersed Phase Backmixing Backmixing has long plagued the operation of dispersed phase contactors by limiting the number of transfer units, or NTUs, achievable. This limitation with conventional equipment is partially overcome by redistribution at various stages in the device. In the membrane contactor, if the phase flowing within the fibers is considered equivalent to the dispersed phase in a conventional mixer-settler, then the continuous phase flows countercurrently outside of the fibers. The flow of each phase is forced inside or between the hollow-fibers, and the opportunity for backmixing is reduced. By reducing dispersed phase backmixing, higher NTUs and lower solvent/feed ratios can be realized.
(d) Accommodates Near-Identical Phase Densities One of the first requirements in selecting a solvent for use in liquid/liquid extraction is a density different from the feed. If the two densities are similar, phase separation after dispersion may be difficult. As membrane contactors operate without dispersion, near-identical feed and solvent phase densities are possible without operating problems.
(e) Direct Scale-up Membrane contactors are modular in design. When an application requires several contactors in series or parallel, this modular design allows a given process to be tested on a reduced scale. For instance, assume design calculations indicate that a particular separation will require a system of 24 contactors, 6 parallel streams of 4 contactors in series. The full scale process can be simulated using a single set of 4 contactors it,, series at one-sixth the total flow.
(jr) Coupling of Process Steps The ability of membrane contactors to facilitate mass-transfer between phases without dispersion leads to interesting possibilities for combining what are typically distinct process steps. Such coupled processes are referred to as gas membranes, immobilized liquid membranes and contained liquid membranes (see Fig. 10.2). Take, for example, the recovery of ammonia from waste water. If the desired process is ammonia removal without ammonia release into the air, two packed towers are required: one to selectively strip free ammonia from the aqueous
480
I 0 - - MEMBRANE CONTACTORS Immobl
I ized
Liquid
Membrane
< ~ ~
Aqueou~J Sr
I p p I rig Sl:ream
~ u ~ ~ ~ ~ ~ ~ ~ I ~ ~ i ~ u ~ M ~ M ~ M ~ u ~ L I qu i d Membrane
Aclueous Sir" 11301no ~3r'ea~
I m m l s c l b le O r g a n i c
Conta
I ned
L I quid
Membrane
IIIIIIIIIIilIIIIIIIIIIIIIIIIIIIIIIIIIIII[IIIIIMIIli'.";'-'--';"."|IIIIIIIHIIIIIIIIIIIIIIIIIiIIIIiIIIIIIHIIIIIIIIIIIIII. ;.~.:
llllllllillllllliillllllllllllllllllllllllllllllllllilil/i
ii~!!~~i!!~..~......a..~iiiiiiiiiii!i!iiiiiiiii!iiiii!?~N~!iiii!ii!i!i!i!i?i!??!i!?ii?iiiiii!iiiii!iii!!!i!?i!!!!ii!!i!iii!i!i!!ii?i!i!i!i!iii!ii!! :,
.:.:.:.:.:.:.:.:.:.:.:.:.:.:...:.:...........
.............i!:ii:'"iiiii ..~i;i.i:i.i.i.i.i.i-i~i~i-i.i-i.i.~i.i-i;~i~i:.:.7.:
i!i~~ii::i~::ii~::!~::~~!::!!! .... :!:!:i:i:i:i:i:i:i:i:i:i:i:i:i:i:i:i:i:i:i:i:i:i:i:•:i:i:i:i:i:i...!•::::::•iiiiii7i::77i::::::iiiiii::•i::ii•i::::::::::iiiii::!::iiiiiiiiiii:::: I mmobi
I I zed
Gas
Membrane
< Aqueous
Strip
Stream
IIIlilillllllllllllllilllllllllillMlilililMII /
illl,llIM,,I,Ml,,IMmmml llllll,m, mllimll,, mllllli,llllIMMMmlllmmlll, ~
Irm~bl
llzecl
/ ~ %P - eous S C r l
Sir
am
Fig. 10.2.Coupled processes using membrane contactors. feed into an air stream, and a second to acid scrub the ammonia from the air. If sulfuric acid is used for the scrubbing, the ammonium is recovered as an a m m o n i u m sulfate solution. This two-step process is highly inefficient since ammonia has a low Henry's constant and large volumes of air are needed to effectively strip the ammonia from the wastewater. Capital and operating costs for the air blowers are high. In addition, large columns are needed for air stripping because the desired removal efficiency can only be achieved with very low hydraulic loading rates.
10 - - M E M B R A N E
CONTACTORS
481
Using a membrane contactor can reduce the complexity, size and cost of the equipment needed. A hydrophobic microporous membrane is used in this application. The ammonia-containing water is pumped on one side of the membrane while sulfuric acid is pumped on the other side. The hydrophobic membrane is not wetted, so the pores of the membrane remain dry and gasfilled between the two liquid streams; hence the term "gas membrane". The ammonia partitions from the wastewater feed into the gas membrane, diffuses through the air-filled pores and is absorbed into the acid on the opposite side of the membrane. This neutralization by acid drives mass-transfer. Similar coupled process advantages are possible for liquid/liquid extractions with the use of immobilized liquid membranes. Consider the example of two stage solvent extraction used for the purification and concentration of metals and pharmaceutical products. The first solvent phase can be immobilized in the pores of a microporous membrane support between feed and the second solvent (strip) phase. In this manner the immobilized solvent phase transports the solute from the feed phase to the strip phase within the same device, eliminating the need for two contacting devices. The lifetime of such a "membrane" is dependent on the solubility of the solvent in the feed and strip streams. In time the solvent is leached from the membrane, and the process must be interrupted to refill the membrane pores with fresh solvent. This major disadvantage led to the contained liquid membrane concept using two bundles of hollow-fiber membranes within the same contactor. The feed solution is pumped through one set of fibers and the strip phase is pumped through the second set while the first solvent is circulated on the shell-side of the fibers. The "contained liquid membrane" provides a reservoir between the feed and strip flows, which can be continuously regenerated.
10.3.2 Disadvantages of Contactors Just as we must understand the advantages of membrane contactors when considering equipment options, we must understand their limitations. The disadvantages of using membrane contactors are as follows: (a) The membrane resistance can be significant Conventional contactors, including packed towers, have two resistances to mass-transfer, one in the feed and one in the receiving phase. The overall resistance to mass-transfer depends on the sum of the resistances in these two phases. In membrane contactors~ the membrane provides a third resistance. While this third membrane resistance is often negligible, it can sometimes contribute significantly to the overall mass-transfer resistance. The membrane resistance can be easily estimated as the membrane's thickness divided by its permeability. The thickness can sometimes be measured
482
10 --- M E M B R A N E C O N T A C T O R S
directly; for microporous membranes, it is often around 30 I~m, but for nonporous membranes, it can be as small as 0.01 ~xn. The membrane permeability, often described as P, depends on whether the membrane is porous or nonporous. If the membrane is porous, its permeability is just the diffusion coefficient in the pores times the membrane's void fraction divided by its tortuosity. If the membrane is nonporous, its permeability will be the product of the membrane's diffusion coefficient and a partition coefficient. The particular partitions coefficient is between the membrane and the adjacent phase, and is completely discussed in this book's chapter on pervaporation.
(b) Transmembrane pressure limitations Axial pressure drops are usually modest in membrane contactors. Transmembrane pressures need not be high, as in reverse osmosis or ultrafiltration. The reason is that membrane contactors depend on "diffusion" across the membrane. Unlike reverse osmosis and ultrafiltration, they do not depend on convection across the membrane. Transmembrane pressures are not usually important for nonporous membrane contactors. They are important for porous membrane contactors because they may cause accidental flow across the membrane, causing unwanted froth, foam or emulsion. Such accidental flow, or "breakthrough", can be controlled by applying a higher pressure on the phase which does not wet the pores. This higher pressure must not exceed a critical value, or the nonwetting fluid will penetrate the pores and contaminate the other fluid stream. This critical transmembrane pressure AP resulting in breakthrough is approximately defined by the Young-Laplace equation: AP =
2 (~ cos0
(gas/liquid)
(10.12)
(liquid/liquid)
(10.13)
r
AP = 2 7 cos_______~0 /,
where: c~ = sttrface tension (dynes/cm); T = interfacial tension (dynes/cm); 0 = contact angles; and r = pore radius (cm). The maximum transmembrane pressure for maintaining a stable interface between two phases is a function of the membrane pore size and the contact angle between the phases. Because this contact angle can be depressed by traces of surfactant, this can sometimes be a serious problem, cured by coating the microporous fibers with a thin layer of gel. In most cases, it is not severe, and can be solved by using the generalizations in Table 10.3.
(c) Available material of construction Conventional contactors may be fabricated from a wide range of materials, including metals, polymers, ceramics and glass, whose chemical resistance is
1 0 - MEMBRANECONTACTORS
483
TABLE 10.3 Influence of application on maximum transmembrane pressure Case membrane
Wetting fluid
Nonwetting fluid
t~P Tolerance
Gas/Liquid 1. hydrophobic 2. hydrophobic 3. hydrophobic 4. hydrophobic 5. hydrophilic 6. hydrophilic 7. hydrophilic 8. hydrophilic
gas gas aqueous organic gas gas aqueous organic
aqueous organic gas gas aqueous organic gas gas
function of c~, 0, r unstable function of r 0, r function of r 0, r unstable unstable function of o, 0, r function of o, 0, r
Liquid/Liquid* 1. hydrophobic 2. hydrophobic 3. hydrophobic 4. hydrophobic 5. hydrophilic 6. hydrophilic 7. hydrophilic 8. hydrophilic
organic aqueous nonpolar organic polar organic organic aqueous nonpolar organic polar organic
aqueous organic polar organic nonpolar organic aqueous organic polar organic nonpolar organic
function of'f, 0, r unstable lower than #4 higher than #3 lower than #6 higher than #5 higher than #8 lower than #7
*Taken from: Prasad, R., S. Khare, A. Sengupta and K.K. Sirkar (1990). Studies on novel configurations of liquid-in-membrane pore in membrane solvent extraction. AIChE J., 36, No. 10.
suitable for many operating environments. By contrast, membrane contactors generally employ polymeric membranes and an adhesive resin, used to bond the membranes into the modular casing. Although many polymers and resins have chemical resistance to acid and base, they often have limited resistance in aggressive organic solvents. The chemical compatibility of the materials of construction must be carefully assessed in advance for each application.
(d) Ability to handle solids Unlike typical membrane filtration operations, membrane contactors do not foul due to an accumulation of particulates at the surface of the membrane. Membrane contactors operate on the principle of diffusion flux through the pores, not a convective flux which leads to gel polarization. Although particulates do not typically lead to surface fouling of the membranes, they can plug the flow, particularly at the inlet of the hollow-fibers. For this reason, prefiltration is recommended.
484
10 - - M E M B R A N E C O N T A C T O R S
(e) Capacity When determining the scale-up cost for conventional contacting equipment with higher capacity, the logarithmic relationship known as the "six-tenths factor" is typically applied: C(n) = r 0.6. C
where: C(,) = new plant cost; r = ratio of new to previous capacity; C = previous plant cost. The principle of this relationship is quite simple. A single contactor to handle twice the capacity will not cost twice as much to produce; there is an economy of scale. However, a membrane system to handle twice the capacity will cost approximately twice as much if the same basic module size is used. This lack of an economy of scale for membrane systems has inhibited their acceptance in large-scale gas separation. While the "six-tenths factor" may apply to the cost of larger individual contactors, there will always be a practical upper limit on the manufactured size of membrane contactors. The ability to manufacture devices large enough to compete on a cost basis with conventional contactors will define the upper limits on capacity where membrane contactors find acceptance.
10.4 SPECIFIC EXAMPLES
The design of hollow-fiber membrane contactors is readily accomplished using the simple theory presented above in Section 10.2. The approach used in each of the following examples is as follows: (i) Evaluate the individual resistances to mass-transfer using the appropriate correlations such as those presented in Table 10.1. (ii) Add the individual resistances to determine the overall mass-transfer coefficient, k, for the conditions considered. In most cases it becomes clear on inspection that one resistance is much greater than the others and, therefore, limits the rate of mass-transfer. (iii) With the value of k known, Eq. (10.3) may be used to size hollow-fiber contactors for a given application. As noted above, in the special case where one solvent is present in excess, and it is reasonable to assume that the concentration in equilibrium with the solvent changes very little, Eq. (10.4) may be used. E x a m p l e 1 --- Drug Recovery
The first example is based on mevinolinic acid, a precursor of Merck's product, Mevinolin (Prasad and Sirkar, J. Membr. Sci., 1990). We want to estimate the percent of the drug extracted from water into isopropyl acetate at pH
~0-- MEMBRANECONTACrORS
485
7.4. The water flow to a hollow-fiber module has a superficial velocity of 0.14 cm s -1, which corresponds to an actual velocity within the fibers of 0.5 cm s -1. Each module is 15 cm long and has a surface area per volume of 48 cm2/cm 3 bed. The partition coefficient, K, is 800. Other values are estimated from the literature. We can estimate the extraction using Eq. (10.4) if we can calculate each quantity involved. In particular, from correlation A in Table 10.1 k(feed) d
(.d2x)~/3
(240.10_ cm)2.0.5 cm
k(feed ) 240.10 -4 cm = 1.64 0.8.10 -s cm2/sec
SeC
0"8"10-s ~2"15sec cm
k(feed) = 7.10 -4 cm/sec k(membrane )=
De,K
(thickness) (tortuosity) .5.10 -s
=
.......
(0.57) (800) see
. . . .
(25.10 -4 cm) (3) = 0.3 cm/sec Using Eq. (10.5), we find 1 k
1 k(feed)
+
1 1 + k(membrane ) k(receiving )
k(feed) N o w we can use Eq. (10.4): C _ e_ka L/% Co
,7.10_ 4 cm (48 ~ 2 ) ( 1 5 c m ) = exp
See ~ cm3 tin
o.14 see =0.03
/3
486
10 ~ MEMBRANE CONTACTORS
In other words, 97% of the mevinolinic acid is recovered. The experimental value is about 98%, in reasonable agreement. Similar results are possible for any weak acid or base.
Example 2---Ammonia Stripping As a second example, imagine we want to use a fiber module to strip ammonia from a waste water which is at p H 11.2 (Semmens et al., 1990). The waste water flows at a superficial velocity of 1.0 cm s -1, corresponding to a lumen velocity of 3.3 cm s -1. The module is 1 m long, has a surface area per volume of 35 cm2/cm 3 bed, and has fibers measuring 400 ~m in internal diameter. The membrane wall is 25 larn thick and, under these conditions, the membrane's pores are air-filled. The Henry's law constant is 1.8.10 -'3. A strong acid is p u m p e d over the outside of the fibers and the ammonia gas that crosses the membrane reacts rapidly with the excess acid to form nonvolatile ammonium sulfate. Our solution parallels that given above. From Eq. A in Table 10.1 k(feed) d D
= 1.64
1.8.10
-s cm 2/sec
I
(400.10 -4 cm)2.3.3 ~
k(feed ) 400.10 -4 cm = 1.64
/3
k(feed ) = 1.10 -3 cm sec
We again use Eq. D in Table 10.1 to calculate the membrane resistance but in this case the Henry's constant is used since the pores are air-filled. k(membrane ) = " i -
9H
0.04 cm2/sec(0.5)l.8
9 1 0 -3
25.10 -4 cm (3) =
5.10_ 3 cm sec
where Dp, the pore diffusion coefficient, is the Knudsen value in the small, gas-filled pores (Cussler, 1984). Since an excess of strong acid is provided, the external resistance is negligible and from Eq. (10.5):
lo -- ~ m ~
COmACroms 1 k
487
$ec sec + = 8.10 -4 cm/sec 1.10 -s cm 5.10 -a c m
N o w from Eq. (10.4), C _ e_ka L/~o Co
= 0.06 This 94% recovery is consistent w i t h experiment. In contrast, conventional packed bed technology requires a 13 m bed and an airflow of 3OOft 3 air/gal feed for the same recovery. Utilizing m e m b r a n e contactors, we have a I m bed which requires no air flow.
Example 3--- Oxygen Transfer This example illustrates h o w hollow-fiber m e m b r a n e s can be used to transfer oxygen into water without bubble formation. In this application, sealed fibers are used and the lumen side of the fibers is pressurized w i t h pure oxygen. Water flows over the outside of the fibers and oxygen diffuses across the m e m b r a n e and dissolves into the water. The mass-transfer behavior of sealed fibers was characterized by A h m e d (1992) and the correlations used in this example are d r a w n from this reference. A s s u m e 3000 fibers measuring 61 cm x 280 ~m are housed in a 5-cm diameter pipe. The water flow rate through the pipe is 151 1 min -1, which gives a water velocity of 142 cm s -1 past the fibers. If the water is at a temperature of 15~ and the influent dissolved oxygen 0 9 0 ) concentration is 0.5 m g 1-1, calculate the effluent DO from the module w h e n it is operated at an oxygen pressure of 60 psi inside the fibers. In this application the mass-transfer is controlled by liquid film diffusion on the outside of the fibers. The mass-transfer coefficient can be calculated from the correlation of A h m e d et al.
Sh = 0.018- Re ~
Sc ~
Calculating Reynolds N u m b e r Re = where
~de v
488
10 m MEMBRANE CONTACTORS
de = e q u i v a l e n t d i a m e t e r = d~
-
nd 2
dp + nd (5.0 cm)2 _ (3000.0.028 c m ) 2 5.0 cm + 3000 90.028 cm = 0.25 c m (142 c m / s e c . 0.25 cm) Re =
0.01142 cm2/sec
= 3157
Sc-
V
0.01142 cm2/sec
D
1.688 x 10 -s cm2/sec
= 676 C a l c u l a t i n g Sh f r o m A h m e d ' s C o r r e l a t i o n
Sh = 124 k-
124 D
de 124.1.688.10 -s cm2/sec 0.25 cm
k = 0.0082 c m / s e c The interfacial a r e a / v o l u m e , a, is next calculated. The increase in o x y g e n c o n c e n t r a t i o n in the w a t e r m a y n o w be calculated
a--
4gnd lr.d~- ngd 2 4.3000 90.028 cm (5 c m ) 2 -
3000(0.028 c m )
a = 14.84 cm -1 u s i n g a n e q u a t i o n similar to Eq. (10.4):
2
10
-
-
MEMBRANE CONTACTORS
489
c_."-_Co)= C* - C
In this equation, C* is the concentration of dissolved oxygen at equilibrium with the gas inside the fiber, and is related to the pressure of the gas by the Henry's Constant. At 15~ the value of C~is 220 mg L-1 for pure oxygen at 60 psi. Now we can calculate C
61 )
(220 m s / L - 0.5 m s / L ) = e(0.0082 cm cdot14.8an -I .--------142 cm/s (220 mg / L-C) s 219.5 = 1.053 220 - C .'. C = 12.6 mg/L
The module can, therefore, raise the dissolved oxygen content of the water by more than 12 mg L-1. This result agrees very well with experimental data and has the interesting property of being insensitive to water flow rate. This is because the mass-transfer coefficient is almost linearly dependent upon the water velocity. Doubling the water flow rate therefore doubles the mass-transfer coefficient but the amount of mass-transferred remains approximately constant because the residence time in the reactor (L/~)) is halved. The ability to use hollow-fibers in this way for gas transfer exploits the energy that has already been expended in separating and compressing the pure oxygen. The approach appears to have merit in the aeration of warm, shallow waters and for applications where a high dissolved oxygen concentration must be maintained.
Example 4 --- Nitrogen Stripping of Oxygen from Water In this example water is p u m p e d through the inside of hollow fibers and nitrogen is applied to the shell-side of the membrane module. Ninety-five percent of the oxygen must be removed from a 10 gal min -1 stream of water. We wish to calculate the number of commercial membrane modules required to treat this flow rate. The design of the commercial shell and tube modules is summarized below in Table 10.4. A sufficiently high flow rate of nitrogen is assumed to drive the oxygen partial pressure to near zero in the exiting nitrogen stream. The dimensionless Henry's constant, H, for oxygen in water is 32.37.
490
10--- MEMBRANECONTACTORS
TABLE 10.4 Design information for commercial hollow-fiber contactors ~ Overall dimensions Number of fibers Internal fiber diameter Fiber wall thickness Membrane Porosity Effective membrane pore size Fiber material Membrane tortuosity Effective fiber length
2-in diameter x 24-in length 9000 240 gm 30 pan 30% 0.05 grn polypropylene 2.6 54.6 cm
*Commercial contactor (Cat #5PCM-105) available from Hoechst Celanese Corporation.
We assume that the flow is treated by three modules in parallel, and the feed resistance inside the fibers can be calculated using the now familiar correlation: k(feed)d
D
(d21)~1/3 = 1.62 ~ - )
The water flow rate per module is first calculated (10 8al/min) (3.78 L/gal) (1000 cm3/L) 3 960s/min = 210 cm3/s from which the velocity inside the fibers, ~, is determined: For the membrane resistance we consider Knudsen-hindered diffusion through the small gas-filled pores of the equation. Equation D from Table 10.1 is used. The pore diffusion coefficient, Dp, may be estimated at 25~ (Cussler, 1984). The mass-transfer resistance in the nitrogen phase may be calculated using a modified version of Eq. E in Table 10.1 and is found to be negligible (Prasad and Sirkar, 1988):
1)"
210 cm3/s 94 g. (0.024 cm) 2. 9000
x) = 51.6 cm/s
491
10 - - M E M B R A N E C O N T A C r O R S
k(feed) 9(0.024 cm) = 1.64 ~ (0.024 cm)2.51.6 cm/s l/3 2.5.10 -s cm2/s ~2.5X10 -s crn2/s 954.6 cm .
.
.
.
.
.
.
.
.
k(feed) = 4 . 7 - 1 0 -3 cm/s Dp = 4850 dp =
=
M-W
4850(5.10 - 6
cm)
.....
Dp = 0.078 cm2/s DF~.H kmembrane
=
zl 0.074 cm2/s 90.3 932.37 2.6 90.003 cm
= 96.8 c m / s 0.6
kreceiving de DH
N
0.3
thus 1
1
1
k
4.7x10 -3
96.8
k=
kfeed =
4.7x10 -3 cm/s
U s i n g Eq. (10.4), for 95% r e m o v a l C = 0.05 = e-kaL/u Co
. . . . . . . .
Substitute a n d solve for L using a = 4 / d w h e r e d = internal fiber diameter.
t
-In(0.05) =-(4.7x10 -s cm/s) 0.024 cm 9 L = 198 cm
s
Since each m o d u l e is 54.6 cm in length, 4 m o d u l e s in series are required. In all, 12 m o d u l e s are n e e d e d to treat the 10-gpm flow.
492
10-- MEMBRANECONTACTORS
By comparison, newer membrane contactors utilizing a more efficient, crossflow design are now available which offer larger capacity than previous contactors (Table 10.5). TABLE 10.5 Design information of commercial crossflow contactor" Overall dimensions Number of fibers Internal fiber diameter Fiber wall thickness
4-in diameter x 27-in length 35,500 240 ~tm 30 grn
Membrane porosity Effective membrane pore size Fiber material Membrane tortuosity Effective fiber length
30% 0.05 ~ n polypropylene 2.6 63 crn
"Commercial contactor (Cat #5PCM-113) available from Hoechst Celanese Corporation.
Using similar calculation techniques and crossflow correlations shown in Table 10.1, the total number of contactors required is reduced from twelve to one. For these crossflow devices, the aqueous phase (limiting resistance) flows outside the hollow fibers (shellside) and the nitrogen flows inside the hollow fibers (tubeside). E x a m p l e 5 --- P h e n o l E x t r a c t i o n
Compare the effectiveness of a reciprocating plate extraction column with hollow-fiber membrane modules for extracting phenol from solution using MIBK. Data for the example are d r a w n from Karr and Ramanujan (1988). These authors pilot tested a 3.8 m x 5.2 cm diameter column to treat a water containing 440 p p m of phenol. The conditions tested and relevant data are shown below: = 440 mg 1-1 Influent phenol concentration 1 mg 1-1 Effluent phenol concentration = 40 The partition coefficient K for MIBK = 24 ml s -1 Water flow rate = 27.9 ml s -1 MIBK flow rate = 105~ Temperature = 1.10-s cm 2 s -1 Diffusivity of phenol in water = 3.10-s cm 2 s -1 Diffusivity of phenol in MIBK The experiments on the reciprocating plate extraction column showed that the NTU = 6.61 and the HTU = 55.4 cm.
10 -- M E M e R A t ~
493
Co~rACrORS
H o w m a n y modules are required if modules as described in Table 10.4 are used in this application? The water velocity ~) within the fibers may be calculated v = 24 cm 3 s -1. 4 / x . (0.024 cm) 2. 7500 = 7.1 cm s - 1 We may also calculate a superficial water velocity, ~)o,for the module and the solvent velocity, ~)s. ~o
= 24 cm 3 s -1. 4/7t (4 cm) 2 = 1.9 cm s - 1
us = 27.9 cm 3 s -1. 4 / ~ x (4 cm) 2. 0.43 = 5.2 cm s -1 The mass-transfer coefficients are calculated: kfeed = 1"64 "
"~'~)
-1.64 II'lO-S cma/s)I( (0"024)2 (7'1 c r n / s ) ) ' ~ 0.024 cm 1.10 =s cm2/$) (54.6 cm) = 1.3.10 -3 cm/s DeK k m e m b r a n e --
1%
(3-10 -s cm2/s 90.3.40) 0.003 cm. 2.6
= 4.6.10 -2 cm/s kreceivingiS estimated using the equation of Prasad and Sirkar (1988):
HD [aoq- r 0.53 cm x~ 0.75 _cm2/s
(3•
cm /s')
= 3.33.10 -s cm/s
,J(
54"~ ~mm
)
cm/s C m O~,9_,m 0.53 ~-~s
494
1 0 - MEMBRANECONTACTORS
S u m m i n g the resistances: 1 k
1 1.3x10⁻³
1 1 + 3.33x10 -3 4.6x10 -2
k = 9.4 x 10 -4 cm/s Therefore, C
--=0.023 =e
-9.4.10 4 cm/s x 166 an -I x L.I 7 cm/s
Co
L = 272 cm and five modules are needed in series. The HTU is then calculated for the m e m b r a n e module: 272 .=41.3 cm 6.61 The results of this analysis are s u m m a r i z e d in Table 10.6. TABLE 10.6 Comparison of contactors
Membrane Contactors Recip. Plate Contactor
Membrane/Column Ratio
a (cm-b
H'ru (cm)
Volume required (cm 3)
167 2--4? --80/1
41.3 55.4 0.75/1
3430 7777 0.44/1
Example 6 ~ Oil Extraction of Volatile Organic Compounds (VOCs) from Water In this example we consider the use of an externally coated hollow-fiber m e m b r a n e that allows the fibers to be immersed in oil without wetting. Water is p u m p e d through the fibers while oil is recirculated outside the fibers and the pores of the m e m b r a n e remain dry and air-filled. In this three-phase system, VOCs can readily diffuse across the m e m b r a n e and into the oil as described by Z a n d e r et al, (1989). Tetrachloroethylene (TCE)-contaminated water is treated in a membrane m o d u l e u n d e r the following conditions: external fiber diameter = 450 Ixm internal fiber diameter = 400 Inn
10 --
MEMBRANECONTACTORS
495
sheUside equivalent d i a m e t e r fiber l e n g t h w a t e r velocity superficial oil velocity Kd ( o f f / w a t e r partition coefficient) H ( H e n r y ' s constant) Dair Doil Dwater
oil viscosity Evaluate the resistances: (i)
0.12 cm =30cm = 2.65 c m s -1 = 0.7 cm s -1 = 1000 d i m e n s i o n l e s s = 0.753 d i m e n s i o n l e s s = 7.54 x 10 -2 cm 2 s -1 = 9 x 10 -7 c m 2 8 -1 = 8.9 x 10⁻⁶ cm 2 s -1 = 4.88 x 10-s c m 2 s -1 =
~d2~) ~.33 k,,,a _.1.62L~.) .__D,~ 0.33 -,.62 .[,o.o~ ~,~. 2.~ ~/~J 8.9x10 "~ cm2/s 930 cm
8.9x10⁻⁶ cm2/s 0.04 c m
kwater "- 9x10 -4 c m / s
(ii) D.Hr kmembrane = - T - - " I: n
7.54x10 -2 cm2/s 90.753 90.3 0.0025 cm 2.6 kmembrane - 2.62 c m / s
(iii) koiI -- 1.3
"~-" Ka
4.88x10 -5 9X10 -7 cm2/$
i o.o4s~ ).looo kon = 1.37 cm/s Inspection reveals that mass-transfer is limited b y a q u e o u s diffusion to the m e m b r a n e wall a n d n o t b y the volatility of the c o m p o u n d . I n d e e d , m u c h less volatile organic c o m p o u n d s can be r e m o v e d w i t h equal efficiency. O n l y w h e n H is small e n o u g h to raise the m e m b r a n e resistance to a v a l u e c o m p a r a b l e w i t h
496
10-- MEMBRANECONTACTORS
the resistance in the aqueous phase does it begin to influence VOC removal performance. We m a y calculate the overall removal of TCE in the m o d u l e
C
-kaL/
~'-'e
Co
--e
C Co
-(9•
0. an '2.65~.,/,
- 0.36
i.e. 67% TCE removal.
10.5 BIB LIOGRAPHY OF MEMBRANE C O N T A C T O R APPLICATIONS 1
Prasad, R. and Sirkar, K.K. (1989). Hollow fiber solvent extraction of pharmaceutical prod,,cts: a case study. J. Membr. Sci., 47: 235-259. Application: Liquid/liquid (meviolinic acid). 2 Kang, W. et al. (1988). Evaluation of 02 and CO2 transfer coefficients in a locally integrated tubular hollow fiber bioreactor. Appl. Biochem. Biotech., 18: 35-51. Application: Gas Transfer (02, CO2) 3 Fournier, R.L. (1988). Mathematical model of microporous hollow-fiber membrane extractive fermentor. Biotech. Bioeng., 31: 235--239. Application: Gas Transfer, Liquid/liquid Extraction (02, ethanol) 4 Fleischaker, R. (1988). Review of membrane oxygenation of bioreactors. Bioprocess Engineering Symposium, ASME Winter Meeting. Application: Gas Transfer (02) 5 Prasad, R. and Sirkar, K.K. (1990). Hollow fiber solvent extraction: performances and design. J. Membr. Sci., 50: 153-175. Application: Liquid/liquid Extraction (4-methylthiazole, 4-cyanothiazole) 6 Dahuron, L. and Cussler, E.L. (1988). Protein extractions with hollow fibers. AIChE J., 34 (1): 130-136. Application: Liquid/liquid Extraction (myoglobin, achymotrypsin, cytochrome-c, catalase, urease) 7 Frank, G.T. and Sirkar, K.K. (1986). An integrated bioreactor-separator: in situ recovery of fermentation products by a novel membrane-based dispersion-free solvent extraction technique. Biotech. Bioeng. Syrup. No. 17, pp. 303-316. Application: Gas Transfer, Liquid/liquid Extraction (02, ethanol) 8 Yang, M.C. and Cussler, E.L., Designing hollow-fiber contactors. AIChE J., 32 (11): 1910-1916. Application: Gas Transfer (02, CO2) 9 Servas, F.M. et al. (1983). High efficiency membrane oxygenator. Trans. Am. Soc. Artif Intern. Organs, XXIX: 231-236. Application: Gas Transfer (02, CO2)
10- MEMBRANECONTACTORS
497
10 Yang, M.C. and Cussler, E.L. (1989). Artificial gills. J. Membr. Sci., 42: pp. 273-284. Application: Gas Transfer (CO2) 11 Qi, Z. and Cussler, E.L. (1985). Hollow fiber gas membranes. AIChE J., 31 (9): 1548-1553. Application: Gas Tmasfer (H2S, SO2, NI-I3) 12 Qi, Z. and Cussler, E.L. (1985). Microporous hollow fibers for gas absorption. J. Membr. Sci., 23: 321-345. Application: Gas Transfer (CO2, NH3, H2S, SO2) 13 Semmens, M.J. et al. (1989). Using a microporous hollow-fiber membrane to separate VOCs from water. J. A WWA, Research and Technology (April 1989): 162-167. Application: Gas Transfer (VOCs) 14 Basu, R. et al. (1990). Nondispersive membrane solvent back extraction of phenol. AIChE I., 36 (3). Application: Liquid/liquid Extraction (phenol) 15 Sengupta, A. et al. (1990). Liquid membranes for flue gas desulfurization. J. Membr. Sci., 51: 105-126. Application: Gas Transfer (SO2) 16 Kenfield, C.F. et al. (1988). Cyanide recovery across hollow fiber gas membrane. Environ. Sci. Tech., 22: 1151-1155. Application: Gas Transfer (cyanide) 17 Callahan, R.W., Novel Uses of Microporous Membranes: A Case Study. AIChE Symposium Series, 84, No. 261, pp. 54-63. Application: Gas Transfer (02, H2S, SO2, NH3 CO2) Liquid/liquid Extraction (Gold) 18. D'Elia, N.A. et al. (1986). Liquid-liquid extractions with microporous hollow fibers. J. Membr. Sci., 29: 309-319. Application: Liquid/liquid Extraction (p-nitrophenol, acetic acid) 19 Sengupta, A. et al. (1988). Separation of liquid solutions by contained liquid membranes. Sep. Sci. Tech., 23 (12/13): 1735-1751. Application: Liquid/liquid Extraction (phenol, acetic acid) 20 Prasad, R. and Sirkar, K.K. (1988). Dispersion-free solvent extraction with microporous hollow-fiber modules. AIChE J., 34 (2): 177-188,1988. Application: Liquid/liquid Extraction (succenic acid) 21 Kiani, A. et al. (1984). Solvent extraction with immobilized interfaces in a microporous hydrophobic membrane. J. Membr. Sci., 20: 125-145. Application: Liquid/liquid Extraction (acetic acid) 22 Prasad, R. et al. (1986). Further studies on solvent extraction with immobilized interfaces in a microporous hydrophobic membrane. J. Membr. Sci., 26: pp. 79-97. Application: Liquid/liquid Extraction (acetic acid) 23 Qi, Z. and Cussler, E.L. (1985). Bromine recovery with hollow fiber gas membranes. J0 Membr. Sci., 24: 43-57. Application: Gas Transfer (bromine) 24 Sengupta, A. et al. (1988). Separation of solutes from aqueous solutions by contained liquid membranes. AIChE J., 34 (10). Application: Liquid / liquid Extraction (phenol, acetic acid) 25 Alexander, P.R. and Callahan, R.W. (1987). Liquid-liquid extraction and stripping of gold with microporous hollow fibers. J. Membr. Sci., 35: 57-71. Application: Liquid/liquid Extraction (gold) 26 Yang, M.C. and Cussler, E.L. (1987). A hollow-fiber trickle-bed reactor. AIChE J., 33 (10): pp. 1754-1756.
498
10- MEMBRAt~COtCrAcro~
Application: Gas Transfer (SO2 -~ H2SO4) 27 Danesi, P.R. and Reichley-Yinger, L. (1986). A composite supported liquid membrane for ultraclean co-ni separations. J. Membr. Sc/., 27: 339-347. Application: Liquid/liquid Extraction (Co, Ni) 28 Danesi, J.R. and Cianetti, C. (1983). Induction time in metal permeation processes through supported liquid membranes. J. Membr. Sc/., 14: 175-186. Application: Liquid/liquid Extraction (Cd) 29 Inloes, D.S. et al. (1983). Ethanol production by saccharamyces cerevisiae immobilized in hollow-fiber membrane bioreactors. Appl. Environ. Microbiol., July: 264-278. Application: Gas Transfer (02) Liquid/liquid Extraction (ethanol) 30 Fabiani, C. et al. (1987). Degradation of supported liquid membranes under a osmotic pressure gradient. J. Membr. Sci., 30: 97-104. Application: Liquid/liquid Extraction (trilaurylamine hydrochlorate) 31 Majumdar, S. et al. (1988). A new liquid membrane technique for gas separation. AIChE J., 34 (7): 1135-1145. Application: Gas Transfer (Co2) 32 Evren, V. and Piskin, E. (1985). Membrane oxygenators embodying silicone-coated microporous membranes. Progr. Artif. Organs: 566-569. Application: Gas Transfer (02) 33 Yamaguchi, T. et al. (1988). Amino acid transport through supported liquid membranes: mechanism and its application to enantiomeric resolution. Bioelectrochem. Bioenerg., 20; 109-123. Application: Liquid/liquid Extraction (amino acids) 34 Tromp, M. et al. (1988). Extraction of gold and silver cyanide complexes through supported liquid membranes containing macrocyclic extractants. J. Membr. Sc/., 38: 295-300. Application: Liquid/liquid Extraction (gold & silver cyanide) 35 Johnson, B. et al. (1987). Liquid membranes for the production of oxygen-enriched air. J. Membr. Sci., 31: 31-67. Application: Gas Transfer (02) 36 Shukla, R. et al. (1989). ABE Production in a novel hollow fiber fermentor--extractor. Biotech. Bioeng., 34: 1158-1166. Application: Gas Transfer (02) Liquid/liquid Extraction (acetone, butanol, ethanol) 37 Lee, K.H. et al. (1978). Selective copper recovery with two types of liquid membranes. AIChE J., 24 (5): 860--868. Application: Liquid/liquid Extraction (Cu) 38 Chaundry, M.A. et al. (1989). Transport study ofV(V), Zn(II) and Be(II) using supported liquid membranes. J. Radioanal. Nucl. Chem., 129 (2): 409--423. Application: Liquid/liquid Extraction (V, Zn, Be) 39 Callahan, R.W. (1989). Liquid/liquid extraction with Celgard microporous membranes and component products. Filtration News, 7 (1). Application: Liquid/liquid Extraction (Pd, Cu, Au) 40 Wickramasinghe, S.R. et al. (1991). Better hollow fiber contactors. J. Membr. Sci., 62: 371-388. Application: Gas Transfer (02)
Membrane Separations Technology. Principles and Applications Edited by R.D. Noble and S.A. Stern 9 1995, Elsevier Science B.I/. All fights reserved
Chapter 11
Analysis and design of membrane permeators for gas separation A m i t a v a Sengupta ~ a n d Kamalesh K. Sirkar b
~ Celanese Corporation, Charlotte, N C 28273, USA bNew Jersey Instituteof Technology, Newark, NJ 07102, USA
11.1 INTRODUCTION Compared to other membrane technologies like reverse osmosis and ultrafiltration, commercial gas separation using membranes is relatively new [1]. However, the rate of growth of this technology has been phenomenal. Progress was made based on development of new materials, new membrane fabrication processes and new application developments. The growth is expected to continue through the 1990s, making it perhaps a 100-million-doUar industry by the end of this decade [2-4]. Like its sister technologies, membrane gas separation is commerciaUy appealing for many reasons. These include higher energy efficiency, generally lower capital and operating costs, compact modular construction, low maintenance cost, ease of installation and operation, mechanical simplicity and ease of scale-up. Over the years, a large range of applications has been developed [3]. Membranes are used commercially for separation of H2 from refinery off-gases, ammonia purge gas and syn-gas [5-7], CO2 removal from natural gas --including the enhanced oil recovery (EOR) applications [8-11], acid gas separation [12], air separation and N2 generation [13-15], recovery of solvent from air [16-18] and compressed air-drying [2]. As membrane gas separation technology matures, the need to understand
500
11 - - ANALYSIS AND DESIGN OF MEMBRANE PERMEATORS FOR GAS SEPARATION
the performance of membrane separators in a process configuration becomes increasingly important. The separation characteristics of permeators will directly affect the process economics. The capability of performance analysis and prediction is, therefore, an essential part of the technology development. The performance analysis also aids directly in designing membrane modules for a given separation requirement. Furthermore, membrane separations are often used in hybrid processes, i.e., as processes in conjunction with other separation processes, or other unit operations [19]. Analysis and design of membrane permeators are, therefore, essential tools even in the preliminary process design stage.
11.2 SCOPE OF THIS CHAPTER
Over the years, a great variety of different types and classes of membranes have been developed and reported. Membranes can be classified in various ways [20-22]. For gas separation, membranes can be solid (polymeric or inorganic or metallic) or liquid. Solid membranes can be nonporous, microporous, asymmetric, or composite. Liquid membranes can have different structures, e.g., immobilized or supported liquid membranes, emulsion liquid membranes and contained liquid membranes. Other variations, e.g., solvent-swollen membranes, ion-exchange membranes, etc., have also been developed. Besides these variations, the membrane can be packaged in the permeator module in different forms. The two forms commercially used are hollow fiber and spirally wound fiat sheet. The analysis and design of the permeator may depend strongly on this choice. The actual mechanism of gas transport and separation can also vary. Different postulated mechanisms are solution--diffusion, facilitation, Knudsen diffusion, surface diffusion and molecular sieving. Incorporating such phenomena in a single analytical framework is beyond the scope of the present chapter. The strategy here is to keep the permeator performance analysis as generally applicable as possible. Mechanistic aspects of transport are not considered. It is assumed that the membrane transport and permeation properties are known. The goal is to compute and predict the overall macroscopic separation in a separator 'module' based on known 'local' rates of transport, or to design the module for a required extent of separation. However, as discussed later, the analysis framework developed here can be built upon and extended to simulation of more complex cases. Additionally, a steady-state operation is assumed. Although there have been studies reported in literature on transient response of membrane modules [23], at this time it is likely to be only of academic interest. Therefore, no temporal variation inside the membrane module has been considered here.
11 ~ ANALYSIS AND DESIGN OF MEMBRANE PERMEATORS FOR GAS SEPARATION
501
11.3 GOVERNING EQUATIONS AND USEFUL DEFINITIONS In case of simple permeation, the rate of permeation across a membrane at a given point in a permeator is governed by the following equation: PERMEATION = PERMEABILITY OF SPECIES i OF SPECIES i EFFECTWE MEMBRANE THICKNESS
] PRESSURE DIFFERENCE [OF i ACROSS MEMBRANE
(11.1a) The rate of permeation is a 'point function', much as the local rate of reaction in a reactor. For nonreactive permeation, the permeability is a quantity unique to the permeant-membrane combination and is a function of temperature. For permeation through rubbery membranes, it can be shown to be the product of the diffusivity and the solubility of the permeant in the membrane [24]. For glassy polymers, the 'dual-mode' model has been used [25]. Most commercial gas separation membranes are asymmetric in nature. The permeation is modelled by assuming the membrane has a dense 'skin' backed by an integral porous support with graded porosity. It may not be possible to measure the effective membrane thickness physically. For this reason, and for ease of analysis, the permeability and the effective membrane thickness are often combined together, and their ratio is called the permeance: [PERMEATION RATE] = [PERMEANCE] [AREA] [EFFECTIVE PARTIAL PRESSURE DIFFERENCE]
(11.1b) or [PERMEATION FLUX]
=
[PERMEANCE] [EFFECTIVE PARTIAL PRESSURE DIFFERENCE]
(11.1c) The commonly reported units of these quantities and the appropriate conversion factors are shown in Table 11.1. For a differential permeation area dA, Eq. (11.1b) can be expressed for species i as: dR~ =
(P~tm)
(dA) (Api) = (Qi) (dA) (Api)
(11.2a)
In the case of a nonporous homogeneous membrane, api is the partial pressure difference between the feed gas phase and the permeate gas phase (Fig. 11.1) and can be expressed in terms of the total phase pressures and the corresponding mole fractions at every location inside the permeator: dRi = (Q~) (dA) (PF x i - Pp Yi) = (Qi) (dA) PF ( x i - y Yi)
(11.2b) (11.2c)
where y is the permeate to feed pressure ratio, defined as 7 = PP / PF
(11.2d )
502
11 - - ANALYSIS AND DESIGN OF MEMBRANE PERMEATORS FOR GAS SEPARATION
TABLE 11.1 Definitions, units and conversion factors Quantity
Engineering unit
Permeation rate Permeation flux Perme~ulce Permeability
Std ft3/day Std ft3/(day)(ft2) Std ft3/(day)(ft2)(psi) (Std ft3)~ft)/
(day)(ft~)(psi)
Scientific units Mole/sec
Mole/(sec)(m2) Mole/(sec)(m2)(pa) (Mole)(m)/ (sec)(m')(Pa)
Std cm3/sec Std cm3/(sec)(cm2) Std cm3/(sec)(cm2)(cmHg) (Std cm3](cm)/ (sec)(cm':)(cm Hg)
Notes: 1. Standard condition implies 0~ and I atm. 2. A common unit of permeability is Barrer, defined as I Barrer = 10-l~ (Std cm3)(cm)/(sec)(cm2) (cm Hg). 3. The conversion factors for permeance are: 1 Mole/(sec)(m2)(Pa) = 2.986 x 10¹³Barrer/cm; 1 Std fta/(day)(ft2)(psi) = 6.824 x 10s Barrer/cm.
I
FEED SIDE PF ' Xi MEMBRANE
dR i-((~ /tm) dA(l~ xi- PpYi)
t
PP 'Yi | PERMEATE SIDE Hg. 11.1. Permeation across a differential membrane area.
For p e r m e a t i o n to take place, a positive ap~ is required. There are three w a y s of e n s u r i n g it: (i) a high-pressure feed gas can be used (high PF); (ii) a v a c u u m can be m a i n t a i n e d on the p e r m e a t e or p r o d u c t side (low Pp); a n d (iii) a sweep or carrier gas can be used on the p e r m e a t e side to reduce yi. For commercial gas s e p a r a t i o n processes, only the first two options are viable since use of a sweep or carrier w o u l d be generally c o u n t e r p r o d u c t i v e to separation. A sweep gas m a y be used, h o w e v e r , if the p e r m e a t e d fraction is of no value. Equations (11.2a) and (11.2b) a p p l y to any species i. The relative rates of p e r m e a t i o n of t w o species i and j can, therefore, be expressed as dRJdRj = (QJQj) (ApJApj) = (x (ApdApj)
(11.3)
11 - - ANALYSIS A N D DESIGN OF MEMBRANE PERMEATORS FOR GAS SEPARATION
503
The quantity a(= QJQj) is called the selectivity of species i over species j for the given membrane. The selectivity and the permeance are the two most important characteristics of commercial membranes. In practice, the permeance of the faster permeating species is used in the numerator to define the selectivity so that a is always greater than or equal to unity. The higher the value of 0t, the better is the separation capability of the membrane. A value of a = I means no separation at all. Equations (11.2a)-(11.3) show that the permeation rate increases with increases in permeability and feed pressure, and decreases with increase in the membrane thickness and the permeate pressure. The permeability of a given polymer material is generally constant. The feed and the permeate pressures are process variables which are often fixed also. Therefore, a most commonly sought-after goal in membrane processes is to have an extremely thin membrane. However, a very thin membrane would not be able to withstand high tram-membrane pressure. That is why successful gas permeation membranes have almost always been the asymmetric type or the thin-film composite type [26]. It is important to recognize that as different species permeate at different rates, the effective partial pressure of each species will change along the bulk gas-flow direction. The overall separation, therefore, depends not only on selectivity, but on various other factors as well. Figure l l.2a shows the flow rates and compositions for a so-called membrane separation stage, where L and V are the molar flow rates. An overall material balance can be written as: LF = LR + Vp
(11.4a)
A component material balance for species i can be written as: LF X~r= LR XiR+ Vp y/p
(11.4b)
Three terms are often employed to characterize a membrane separation stage - - stage cut (0), component recovery in the permeate (tPi) and the component recovery in the residue (~i): 0 = Vp/LF
(11.5a)
tPi = YiP Vp/xiF LF
(ll.5b)
~i = XiR LR/XiF LF = 1.0 - ~Pi
(11.5c)
Another term, the enrichment factor (ei), is also used sometimes: ei = yip/X,~
(11.5d)
504
11 - - ANALYSIS AND DESIGN OF MEMBRANE PERMEATORS FOR GAS SEPARATION
MEMBRkNI: SEPARATOR MODULE
RESIDUE
'~
_~LR
'x R
MEMBRANE
FEED LF ,x F -
L.._~Vp 'Yp
PERMEATE (a) GENERAL SCHEMATIC OF A M E M B R A N E SEPARATION STAGE
PERMEATE
O.UAU~
O
STAGE CUT, Vp/LF
II x F
(b) GI~IERAL PERFORMANCE OF A MEMBRANE Si~PARATION STAGE FOR A BINARY SYSTEM
Fig. 11.2. A membrane separation stage.
Using these definitions, the mass balance equations can be reformulated: 0 = ( I i F -- I i R / ( Y m - I i R )
(11.6a)
~Pi = 1.0 - r = ei 0 = 1 - (1 - 0) (X~R/Xm)
(11.6b)
The above terms are used extensively in the literature on m e m b r a n e gas permeator analysis. The theoretical m a x i m u m value of 0 can be 1.0. However, the permeator w o u l d not achieve any effective separation w h e n 0 is 1, and in that case YtP w o u l d equal x~. The m a g n i t u d e of the permeate composition is largest w h e n 0 approaches zero and normally decreases monotonically as 0 increases, especially for binary separation. In an actual permeator, ya, w o u l d be somewhere b e t w e e n the above mentioned m a x i m u m Yt~ and xm. These facts are illustrated in Fig. 11.2b.
11.4 PROCESS D E S I G N O P T I O N S A N D SEPARATION SCHEMES
As in other unit operations, there are two cost elements involved in m e m brane processes ~ the capital cost and the operating cost. Sometimes the cost
11 - - ANALYSIS AND DESIGN OF MEMBRANE PERMEATORS FOR GAS SEPARATION
505
of pretreating the feed gas stream before it enters the membrane processing stage may have to be added to these costs since the membrane may be damaged by an impurity in the feed stream, e.g., H20, NH3, etc. The capital cost for the membrane process is determined primarily by the permeation area required for the necessary separation, whereas the operating cost is influenced essentially by the power requirement for the fluid moving equipment, e.g., compressors. Two major factors in process design are the product purity and the product recovery. The product from a membrane separation step can be either the unpermeated residue stream or the permeate stream. Examples of the former category are nitrogen generation from air (remove 02 from air), dehydration of natural gas (remove H20 from hydrocarbons), sour gas treating (remove CO2 and H2S from hydrocarbons), landfill gas upgrading (remove CO2 from CH4), syngas ratio adjustment (partially remove H2 from H2-CO mixture), etc. Examples of the latter category are hydrogen recovery from refinery streams, production of oxygen enriched air, helium recovery, recovery of CO2 for enhanced oil recovery applications, etc. The process design is influenced very strongly by the separation goal. For example, in nitrogen generation from air, the goal is to remove as much oxygen as possible from the feed air. Along with 02, N2 also permeates since membranes have finite selectivities. Therefore, for a membrane with a given selectivity, the higher the purity of the N2 desired, the larger is the fraction of the feed to be permeated, i.e., the larger the stage cut (and the larger the membrane area required). The quality of the permeate is of no consequence here. However, as stage cut increases, more and more N2 is lost in the permeate, and the fraction of feed N2 that is recovered as the high-purity N2 product is reduced. Thus, in this case, high product purity leads to large membrane area, and low recovery. On the other hand, for producing oxygen-enriched air, it is the 02 level in the permeate that is important. A lower stage cut will produce higher oxygen quality in the permeate. However, that implies a very low oxygen recovery, and most of the feed air will be lost in the residue. If the air is compressed prior to feeding the membrane unit, considerable power is also lost in the residue unless some other uses are found for this residue stream. In the air separation example, the loss of N2 or 02 may not be crucial since the feed is essentially free. In separation of process streams the situation is likely to be quite different. Consider H2 recovery from refinery streams. It would be preferable to have a very high H2 quality in the permeate stream as well as a very high H2 recovery (and negligible loss in the residue stream). However, both objectives may not be achievable with a membrane of moderate selectivity. An optimum has to be developed by including the cost of membrane area, the value of high quality product and the price of lost H2 in the residue in any cost analysis. The permeation process is also influenced strongly by the operating condi-
506
11 - - ANALYSIS A N D D E S I G N OF MEMBRANE PERMEATORS FOR GAS SEPARATION
tions, e.g., the temperature, the feed pressure and the permeate pressure. An increase in temperature will generally increase the permeability but reduce the selectivity. However, all membrane modules have upper limits of operating temperature. The choice of temperature sometimes depends also on the presence of condensibles in the residue stream. The feed and the permeate pressures are in some cases predetermined by existing process conditions. At other times, they can be used as optimizing parameters. A higher feed pressure increases the rate of permeation, and so the required stage cut can be achieved with less membrane area. However, higher feed pressure means higher compression costs, both capital and operating. On the other hand, a low permeate pressure will also increase the permeation rate, but the permeate may have to be recompressed before it can be used further. It is also important to recognize that high selectivity is not always economical. As the selectivity of the membrane increases, the permeate quality (the faster component mole fraction) increases. However, this, in effect, reduces the permeation driving force by increasing the faster component partial pressure in the permeate. Thus more membrane area may be required to achieve a fixed stage cut [16]. For a given range of operating variables, there is an optimum range of membrane selectivity beyond which the separation becomes cost prohibitive. PERMEATE
RESIDUE
FE
FEED RESIDUE (a) ~
mEO1F~110N
Co) s t ~ t f - s r a m m r . ~ c u m
Hg. 11.3.Novel separation schemes.
507
11~ ANALYSISAND DESIGNOF MEMBRANEPERMF~TORSFORGASSEPARATION
These examples illustrate that there is a complex interplay between the design variables, the process variables, the system properties and the operating conditions. A number of factors have to be weighed against one another. Many process design decisions need to be based on the separation goals, and one has to do a permeation analysis before an economic assessment can be made and an optimum process can be designed. The above discussion also suggests that in actual industrial practice, a singlestage membrane separation may often be inadequate. To achieve the target separation at the lowest possible cost, frequently a separation scheme needs to be configured. Staging is a classical example where the unpermeated stream from one stage is introduced (after repressurization, if necessary) as the feed to a subsequent stage. Recycling between stages is also a common practice. If a large number of stages with front and back recycling is used it may resemble a multistage distillation column [27]. Using one enricher and one stripper, Hwang and Thorman [28] introduced the novel concept of a 'continuous membrane column' or the membrane rectification column. On the other hand, a single-stage separation with partial permeate recycling has been studied by Teslik and Sirkar [29] and Majumdar et al. [30]. These two separation schemes are shown in Fig. 11.3. Comparisons between these schemes have been con-
FEED
RESIDUE .....
FEED I
I i
~RESIDUE
,,i
ERM~TE
PERMEATE (a) TWO-gAGE CASCA[I WITH RECYOUNG
(b) TWO-S'rAGE S J E ~ WITH ~ C Y C U N G
FEED
FEED
i
~,,
[
, ~IDUE
[--~i I
' I
!
I
l
RESIDUE
_ll
IT
I ~~FATE
PERMEAT-E (c) THREE-STAGE CASCA[NE wm.I RECYQJq~
(d) SERES w r m TWO-SrAC,ED ~mEATE
Fig. 11.4.Examplesof commercialseparation schemes.
508
11 -- ANALYSISAND DESIGN OF MEMBRANE PERMEATORSFOR GAS SEPARATION
sidered by Matson et al. [20], Teslik and Sirkar [29] and Qiu et al. [31]. In industrial practice, a number of variations are possible. A few examples are: (a) two-stage cascade with recycling [32,33]; (b) two-stage series with recycling [33]; (c) three-stage cascade with recycling [32,12]; (d) series with two-staged permeates [32]. These four schemes are shown in Fig. 11.4. The extent of separation and the membrane area in each stage will depend on cost considerations. Regardless of the separation configuration, for a given stage the permeation analysis or design approach will always be the same.
11.5 IMPORTANT CONSIDERATIONS IN PERMEATION ANALYSIS
A number of aspects need to be addressed for a thorough understanding and analysis of actual membrane gas separation processes. Some of them are briefly considered below.
Membrane Selectivity vs. Stage Separation Factor The term 'separation factor' is often used in separation analyses to characterize the extent of separation in a separator. For example, for a binary system like the one shown in Fig. 11.2a, a separation factor between the faster permeating species #1 and the slower permeating species #2 can be defined, with respect to the feed and the permeate, as (11.7)
O~S,1-2 -~ [YlP X2F]/[XlF Y2P]
The separation factor characterizes the actual overall macroscopic separation in the permeator and will depend on the stage cut. This should be distinguished from the membrane selectivity, which is normally constant irrespective of the permeator size. As pointed out in Section 11.3, the permeation rate changes along the permeator length. At a very low stage cut, the permeate quality is always the highest, and so is the separation factor. As further permeation occurs, the permeation driving force for the faster permeating species decreases. Therefore, the permeate mole fraction of the faster species and the separation factor both decrease. For differential permeation at the inlet of the permeator, the permeate concentrations at this location are determined by the local permeation rates, i.e., YlP/Y2P
= dR1/dR
2
= [ Q I ( x l F -- ~' Y l P ) ] / [ Q 2 ( x 2 F
--
= o~(xlF - y YlP) / (x2F - ~( Y2P]
~/Y2P]
(11.8)
11 ~ ANALYSIS AND DESIGN OF MEMBRANE PERMEATORS FOR GAS SEPARATION
509
So 0~S,1-2---- [YlP X2F] / [ X l F Y2P] ----"O~ {[1 --
'Y(ylP/XlF}/~l -- ')f(y2p/X2F }
(11.9)
Thus, as ? ---) 0, (XS,l-2 --~ (x in this case. For any nondifferential separation with nonzero ~,, the separation factor 003,1_2will always be less than (x.
Passive vs. Active Transport The preceding analyses assumed constant gas permeabilities and considered gas permeation controlled by the partial pressures of the permeants. This is characterized as the passive transport. There can also be active transport or facilitated transport across the membrane in which case the total transmembrane flux is enhanced by the use of a carrier in the membrane, which complexes reversibly with the permeant. The active transport membranes can have either fixed carriers or mobile carriers [34]. The total permeant flux is the sum of the fluxes for the noncomplexed and the complexed permeants for mobile carriers. Very large facilitation can be achieved by using appropriate carriers. The ratio of the species permeance through a membrane with carrier (Qi) to that with no carrier (Qst)) is called the facilitation factor, Fi, defined as:
Fi = QJQiD
(11.10)
The facilitation factor is generally a complex nonlinear function of the local feed and permeate gas phase concentrations, the carrier concentration in the membrane, and the complexation parameters. Equations (11.2a)-(11.3) are still generally valid, but the permeabilities and selectivities are only local values and will change front location to location inside the permeator module. The effective permeabilities have to be computed or estimated at each point along the permeator. Sometimes, even for passive transport, the permeability of a species may depend on the feed pressure due to phenomena modelled as dual sorptiondual transport. Polymer plasticization by the permeant may also contribute to such a behavior [35]. Independent permeability measurements or prediction techniques over the range of feed and permeate pressures are required in these cases, and the permeability variations may have to be incorporated in the permeation analysis [36].
Module Configurations Two configurations used in commercial modules are the spirally wound fiat sheets and hollow fibers (Fig. 11.5). Spiral-wound modules are easier to make, but compared to hollow-fiber modules, they pack less membrane permeation area per unit volume, and take up more space for a given application. Also, in
510
11 - - ANALYSIS AND DESIGN OF MEMBRANE PERMEATORS FOR GAS SEPARATION
~
,
. . . . .
j
RMEATE TUBE
,
MEMBRANE/CLOTH COMPOSITE
~ ' ~ ~ .
*m4,aH.Pm:Ssum: (;As mXTUR~-,~: ~
..........~
~ ' ~1111
-------_
~"
.... ~ , , ............ ~::!::: ~ ~
. . . . . . .
_
HIGH-PRESSURE CHANNEL SPACER .._
E~IDUAL-(;A.,.~'
PERMEATE CHANNEL S P A C E R ' S '
(#) SPIRALLY WOUNDPERMEATORMODULE
RBS IDUB'
PIBER BUNDLE PLUG HOLLOW
PERMEATOR
MODULE [ELL H IGH-PRESSURE
GAS MIXTURE
PERMEATE OUTLET (b) HOLLOW-FIBERPERMEATORMODULE Fig. 11.5. Two types of commercial membrane modules. spiral-wound modules, the m e m b r a n e needs backing or support, which are not required by hollow fibers. As s h o w n in Fig. 11.6, the flow patterns inside these
11
-
-
ANALYSIS AND DESIGN OF MEMBRANE PERMEATORS FOR GAS SEPARATION
511
PE BRANE
FEED (a) SPIRALLY WOUND MODULES
FEED
(HOt.LOW-mER WALL)
r~nm~ATE
~ d
FEED (b) HOLLOW FIBER MOIXJLES WITH PARALLEL FLOW
FEED
(HOLLOW-em.eWALL)
~MEATE (C) HOLLOW-FIBER MODULES WITH CROSS FLOW
Fig. 11.6.Flowpaths in various module configurations. two classes of modules are quite different. The spiral-wound modules have skew flow. The hollow-fiber modules generally have parallel flow, but some devices also have flow perpendicular to the fiber length, or 'cross flow', as shown in Fig. 11.6. Pressure Drop Inside the Permeator
As gas flows through the membrane modules, there would inevitably be some pressure loss in the bulk flow directions. This is because the flow cross sections often have to be small in order to achieve a high membrane permeation area per unit module volume (the so-called specific permeation area) leading to compact modules. Depending on the flow situation, the pressure drop can be either in the feed side and/or in the permeate side. It also depends on module geometry, e.g., the channel length and thickness for spiral wounds, the fiber diameters and the packing density for hollow fibers and the module length. Pressure drop is always detrimental to separation. If the pressure drop takes place in the feed side, the actual average feed pressure becomes less than the feed inlet pressure. If the pressure drop is in the permeate side, the acOaal average permeate pressure is higher than the permeate outlet pressure. In either case, the permeation driving force is reduced. The module designer has to settle
512
11 - - ANALYSIS A N D DESIGN OF MEMBRANE PERMEATORS FOR GAS SEPARATION
always for optimum values of module geometry parameters, which give a high specific area while avoiding excessive pressure drop. In a hollow-fiber permeator, whether the feed will be introduced in the shell or the tube side sometimes depends on the pressure drop considerations. If the stage cut is small, it is almost always preferable to have the feed in the shell side where the pressure drop is relatively small compared to that in the fiber lumen. Conversely, for a high stage cut situation, it may be better to have the feed in the fiber lumini, since most of it will eventually permeate into the shell, and the overall cost associated with pressure drop may be less with tube-side feed.
Effect of Membrane Asymmetry The commercial basis for membrane gas separation technology was created by the preparation of dense asymmetric membrane which had a 'skin' on one side with a backing of graded porosity underneath. However, this structure is difficult to model. In practice, it is modeled by assuming a distinct nonporous layer, which offers all the permeation resistance backed by a highly open porous structure through which there is no permeation resistance at all [37,38]. In this case, the composition inside the pores in the backing will be different from that in the bulk permeate (y' as opposed to y, Fig. 11.7). The permeate inside the porous backing is considered to be unaffected by the bulk permeate composition and unmixed with that from any adjacent layers. This composition y' is essentially controlled by the relative local permeation rates, which in turn are dictated by the local feed composition and local total pressures only:
dRi = Qi dA (PF x - Pp y')
(11.11a)
y'= dRi/,~__, dRi
(11.11b)
where
i
FEED v
PF' x
',.,
-~KIN
No,d
PERMEATE Fig. 11.7. Cross-flow model for asymmetric membranes.
11 - - ANALYSIS A N D DESIGN OF MEMBRANE PERMEATORS FOR GAS SEPARATION
513
The bulk permeate at any point along the permeator represents the accumulated effect of all permeation prior to that point. However, it does not affect the local permeation rate. This is called the 'cross-flow' model and should be distinguished from the cross-flow pattern inside the permeator module discussed earlier and shown in Fig. 11.6. Similar models can be used for a truly composite membrane, which has a thin, distinct selective layer backed by a nonintegral porous support. Note, however, that the above model for dense asymmetric or composite membranes is insufficient for describing the permeation if the flux is very high or the membrane is extremely thin because the permeation resistance of the porous backing starts becoming important under these situations.
Effect of Membrane Elastic Deformation Since separation is caused by a pressure difference across the membrane, the membrane has to withstand a high transmembrane pressure differential in all practical separation problems. If the membrane is a rubber at room temperature, this pressure differential may cause significant elastic deformation in the membrane, which in turn may alter its permeance. A deformation analysis should be carried out in this case involving the elastic properties of the membrane material to properly account for this phenomenon.
Flow Patterns Inside the Permeator The existence of the skew flow, the parallel flow and cross flow have already been identified. The parallel flow may be cocurrent, or countercurrent or even a combination of the two (Fig. 11.8). For membranes without any so-called cross-flow permeation due to an asymmetric structure, the countercurrent flow pattern will always produce better separation [39,40], much as in any other continuous-contact separation like distillation, absorption or extraction. In case of cross-flow permeation, the difference between cocurrent and countercurrent bulk flow patterns are much less pronounced [37,38]. The permeator modeling will depend on the flow pattern because the boundary conditions are different.
Gas Phase Mass Transfer Resistances Normally, diffusion rates in gases are much higher than those in solid or liquid membranes. Therefore, it is frequently, and justifiably, assumed that there is negligible gas-phase concentration gradient in a membrane permeator [41]. However, this assumption may be erroneous in special situations where the permeation flux is very high. This is true for very thin membranes or for highly facilitated transport. In these cases the membrane resistance to mass transfer is so small that it is of the same order of magnitude as the gas-phase
514
11--ANALYSISANDDESIGNOFMEMBRANEPERMEATORSFORGASSEPARATION
(a) COOJRRENT
P E R M E A T E ~ FEED
RESIDUE (b) COUNTERCURRENT
FEED I " ~
"4"
"~
"~~IDUE
(c) C~RENT-COUNTE]RCt~RENT
Fig. 11.8.Possible parallel flow patterns. mass transfer resistance on either side of the membrane. Here, the analysis and modeling becomes complicated since the effective permeance K~) for species i will be controlled by the actual membrane permeability as well as the feed and permeate gas-phase film transfer coefficients kF and kp, respectively: K ~ = [1/kF + 1/kp +tm / pi]-I
(11.12)
The effective permeance depends now on the gas-phase flow rates, flow geometries, etc.
11.6 LITERATURE REVIEW OF P E R M E A T O R A N A L Y S I S A N D D E S I G N
Membrane permeation analysis, staging and permeator simulation and design issues have been addressed by various authors using a variety of structures and forms. The earliest work was done by Weller and Steiner [42,43] who analyzed membrane gas permeation of binary mixtures for two different cases: Case I for perfect mixing in both the feed and the permeate side, and Case II for no mixing. They derived analytical expressions for enrichment in a single stage in the form of permeate outlet concentration as a function of the residue concentration. Case II of their analysis was essentially what has been defined in
11 - - ANALYSIS A N D DESIGN OF MEMBRANE PERMEATORS FOR GAS SEPARATION
515
Section 11.5 as the cross-flow permeation. Subsequently, the perfect mixing case was extended by Huckins and Kammermeyer [44,45] and Brubaker and Kammermeyer [46] to ternary and quaternary mixtures. Naylor and Backer [47] provided multistage enrichment calculations for gaseous diffusion separation, and derived the required number of theoretical stages using a McCabe-Thiele type graphical method. Stern et al. [48] extended the Weller and Steiner Case II calculations to a multicomponent system. Stern and Walawender [49] and Walawender and Stern [39] established a comprehensive framework of single-stage permeator analysis and design by considering different flow patterns inside the pemeator, and identifying the effects of different key separation parameters. They also illustrated alternate approaches of using either the membrane area, or the permeate or residue composition as the independent variable. Blaisdell and Kammermeyer [40] also provided a useful approach to modeling countercurrent and cocurrent separations. Pan and Habgood [50] derived a unified mathematical formulation for all possible flow patterns for binary mixture separation without flow pressure drop, and included cases where the feed had a nonpermeable component and the permeate had a sweep or purge gas, which could permeate back to the feed side. They also carried out a thorough parametric analysis, considering the effect of sweep gas, permeate to feed pressure ratio, variations of permeabilities and/or selectivities, etc. Pan and Habgood [51] analyzed single- and multistage permeation of a multicomponent mixture and provided a parametric analysis of the permeation cascade. Pan and Habgood [52] addressed the issues of permeate pressure drop in hollow-fiber modules, and discussed the choice of permeate pressure for optimum performance of cascades. Antonson et al. [53] considered hollow-fiber permeators with homogeneous membranes and analyzed both tube-side feed and shell-side feed. They discussed the effects of a number of variables including broken fibers on the permeator performances. Chern et al. [36] also simulated a hollow fiber gas separator and incorporated the effect of pressure on the gas permeabilifies. Rautenbach and Dahm [54] analyzed four flow patterns, e.g., completely mixed, cross flow, cocurrent and countercurrent for multicomponent gas mixture separation. Schulz [55] provided simplified performance predictions for some of the separation schemes introduced in Section 11.4. Along with conventional permeation analysis, Stern et al. [56] and Thorman and Hwang [57] incorporated the effect of membrane deformation on separation. Pan [37,38] extended the cross-flow model for asymmetric membranes to simulate actual commercial-scale permeators employing dense-skinned cellulose acetate membranes. Chen et al. [58] incorporated axial diffusion terms in permeator analysis.
516
11 - - ANALYSIS AND DESIGN OF MEMBRANE PERMEATORS FOR GAS SEPARATION
A close look at different permeation models over the last forty years reveals that analysis and design problems can be formulated in various ways depending on what the authors consider relevant and important. As the simulation objectives differ, so do the methods of solving the resulting equations. The two main problem classifications are, of course, the rating and the design. In the former, one considers a permeator device or module of known dimensions and permeation area. The module is used to separate a feed-gas mixture at a known flow rate and composition. The goal of the analysis would be to predict the performance of this module in terms of the residue composition, the permeate composition and the stage cut. The independent variable in this case would be simply the membrane area. On the other hand, in the design problem, the goal is to calculate the total membrane permeation area required for a desired extent of separation. One may wish to calculate the area required to achieve a certain mole fraction of the faster permeating component in the residue. This is a purification problem where the product of interest in the separation step is the residue. Alternately, one may wish to calculate the area required to achieve a certain permeate quality, i.e., the faster component mole fraction. This is the so-called recovery problem where the product is the permeate. The two design problems need to be formulated differently. In both design problems the goal is to calculate the total area. However, the area in turn depends on the module geometry. If the number of hollow fibers (for hollow-fiber modules) or the number of permeate channels (for spiralwound modules) is fixed based on module manufacturing considerations, one has to calculate the module length. Conversely, if the module length is fixed from other design considerations, one needs to calculate the number of fibers or the number of channels (or the number of windings in case of spiral-wound modules) required. If commercially available permeator modules are of fixed length and total area, the design calculation goal would be to determine the total number of modules to be used in series or in parallel configuration.
11.7 COMPLETELY MIXED FLOW FOR A M U L T I C O M P O N E ~ SYSTEM In this section permeator analysis will be introduced by considering the simplest possible scenario, i.e., a permeator where the gas phases on either side of the membrane are completely mixed. As a result, there are no spatial gradients of concentrations, and only algebraic equations need to be solved. Examples of such a permeator used in practice would be rare, possible exceptions being small membrane modules used as diagnostic tools or sensors. However, this analysis provides a baseline for more complex ones introduced later.
11 - - ANALYSIS A N D DESIGN OF MEMBRANE PERMEATORS FOR GAS SEPARATION
517
L R , x |R
FEED L F,XtF ....-.-4~
In RESIDUEI o 0
!
0
~PERMEATE v Vp,
YIP
Hg. 11.9.A membrane module with completelymixed flow. Figure 11.9 depicts a mixed-flow situation inside a permeator module for a general multicomponent gas mixture. The mole fraction of component i on the feed side of the membrane is constant throughout the module and is the same as the residue mole fraction xz~. This assumption is analogous to that used commonly for the continuous-flow stirred tank reactor (CSTR) in reactor design. Similarly, the mole fraction on the permeate side is constant, and the same as the permeate outlet composition. The total membrane area is AT, and the feed and permeate pressures, PF and Pp, are constant. In case of a multicomponent feed mixture containing n species, individual component balances have to be addressed. Unlike the binary system, no single selectivity term can be defined here. One possible approach would be to use a reference component with respect to which the selectivities of the other components can be defined as follows: (11.13)
(xi = Qi / QRef
A component balance on i can be written as: LF XiF - LR XiR
-- V p
YiP = Qi AT[PF X i R - Pp YiP], i=1,2,...n
(11.14)
Summing up Eq. (11.14) for components I through n, one can get (11.15a)
O1"
1
where
' O XR
(11.15b)
518
11 - - ANALYSIS A N D DESIGN OF MEMBRANE PERMEATORS FOR GAS SEPARATION
(11.16)
(zi = Q/QRef , and A~r = QRef AT PF /LF
Eliminating LR from Eqs. (11.14) and (11.15a) one can write
i = 1,2,...(n- 1)
(11.17)
The quantifies Yz~are obtained directly from Eqs. (11.14) and (11.15a): (11.18)
Only ( n - 1) components are considered in Eqs. (11.17) and (11.18) since the sum of the mole fractions is always 1.0 and the reference component balance is not needed. Equations (11.15b), (11.17) and (11.18) are (2n- 1) algebraic equations to be solved simultaneously for (n - 1) x i - s, ( n - 1) yms, and LR. The solution would directly provide the residue mole fractions, the permeate mole fractions, and would also allow the calculation of the stage cut, i.e., VI,/LF. 11.8 C O M M O N A S S U M P T I O N S IN ANALYSIS A N D D E S I G N
Some of the common assumptions employed in membrane gas separation analysis in hollow-fiber modules are listed below: 1. Concentration gradients in the gas phase at any cross section of the module are negligible for permeators not having a bulk cross-flow pattern. Hence, only the concentration changes along the permeator need to be considered. 2. Flows are evenly distributed. The so-called 'end effects' resulting from flow direction change, undeveloped velocity profiles, etc., are negligible. 3. Permeance of each species is constant for the given range of operating conditions. 4. There is negligible pressure drop on the shell side of the module. 5. Pressure drop inside the fiber lumen can be described using the HagenPoiseuille equation, i.e., the flow is always laminar. 6. Gas viscosities are "independent of pressure. 7. The membrane does not undergo any physical deformation. For spirally wound permeators the following assumptions are commonly used: 1. The feed phase concentration varies along the permeator axis, and the permeate phase concentration varies along the permeator axis as well as along
11 - - ANALYSIS A N D DESIGN OF MEMBRANE PERMEATORS FOR GAS SEPARATION
519
the length of the membrane leaf. There is no concentration gradient perpendicular to the membrane surface. 2. There is no end effect. 3. Permeance of each species is constant for the given range of the operating conditions. 4. Feed-side pressure drop is negligible. On the permeate side there is pressure drop along the length of the membrane leaf, which can be described by equations governing pressure drop in a channel with spacer screens. There is no pressure variation in any cross section of the membrane leaf. 5. Gas viscosities are independent of pressure. 6. The membrane does not undergo any physical deformation.
11.9 HOLLOW-FIBER PERMEATORS FOR BINARY SYSTEM
A simple rating problem is considered first. Let there be a hollow-fiber permeator of given length containing a given number of fibers with known inside and outside diameters. Assume that the fibers are plugged at one end, and the permeate is collected at the other end of the module. A feed-gas mixture of known flow rate, pressure and composition is introduced to the shell side of this module from one end. The objective is to set up a modeling framework to predict how much of the feed gas will permeate through the membrane, and what would be the residue and the permeate compositions and flow rates. Assume initially that the membrane is homogeneous (i.e., no cross-flow permeation). The flow pattern inside the module can be cocurrent or countercurrent, as shown in Fig. 11.10. Under cocurrent flow condition (Fig. 11.10a), a component material balance for the faster permeating species (identified here as species #1, i.e. i = 1) over a differential permeator length dz can be written as: -d[Lx] = Q1 (n DLM dz NT) (PF x -
Pp
y) = d(Vy]
(11.19)
Here DLM is the logarithmic mean of the fiber's inside and outside diameters and N T is the total number of hollow fibers. Based on a diffusion analysis in the tubular homogeneous membrane it can be shown that DLM, rather than the inside or outside diameters, should appear in the permeation equation (much as in case of heat conduction across cylindrical tubes). A similar material balance for the slower permeating component (i = 2) can be written as: -d[L(1 - x)] = Q2(/t DIM dz NT) [PF(1 - x) - Pp(1 - y)] = d[V(1 - y)]
(11.20)
520
11-- ANALYSISANDDESIGNOFMEMBRANEPERMEATORSFORGASSEPARATION
-I
1
ZTO E
9. - - - ~ dz I ~,
z
V+dV..~_l y+dy"--" i m m
Vp,yp PERMEATE
x+dx I
I
x
v+~,,_Jl
I
V
RESIDUE L R, x R
FEED L F, x F (a) COCURRENT
Z=O
lE
-'1
----~1
dz I---~
V+dV y+ey"--I .
Vp,yp
L+dL
PERMEATE
x+dx
~ V
FEED ~
,
.
z
"
" .
.
.
.
! _
x
V+.~e._l
LF, x F
~I
I
.....=,
I
(b) COUNTERCURRENT
'
.
'
.
.
.
.
~vRESIDUE L R, x R
Fig. 11.10. Differential mass balance for shell-side feed in hollow-fiber permeators. Since the feed is in the shell side, PF can be a s s u m e d to be constant. The p e r m e a t e p r e s s u r e will change, h o w e v e r , a n d a p r e s s u r e d r o p equation can be w r i t t e n as: d P r / d z = - 128p q/(nD 4 NT)
(11.21)
w h e r e q is the actual volumetric flow rate on the permeate side at any axial location. It can be related to the local molar permeate flow rate V using ideal gas law: q = Rg T V/Pp
(11.22)
11 - - ANALYSIS A N D DESIGN OF MEMBRANE PERMEATORS FOR GAS SEPARATION
521
Equations (11.21) and (11.22) can be combined to: dP 2 / d z = - 256 ~ Rg T V/(n D 4 NT)
(11.23)
It is preferable to make the above equations dimensionless. The following definitions are normally used: ~[ = PP / PF ;
O~-- Q 1 / Q 2 ,
L* = L/LF ; V* = V/LF ;
Z * "- Z / / E ;
(11.24a) (11.24b)
K1 = ~ DrM IE NT PF Q2/LF ;
(11.24c)
K2 = 128 ~ Rg T 1E L F /(~ D 4 NT p2)
(11.24d)
Equations (11.19), (11.20) and (11.23) can, therefore, be rewritten as: -d[L*x]/dz* = K1 a(x - ,~ry)= d[V*y]/dz*
(11.25)
-d[L,(1 - x)]/dz* = KI[(1 - x) - ~(1 - y)] = d[V*(1 - y)l/dz*
(11.26)
d~'/dz* = - K2 V*/~
(11.27)
A d d i n g up Eqs. (11.25) and (11.26) leads to -dL,/dz,
= K~[a(x - ~ ) + {(1 - x) - ~(1 - y)}] = d V , / d z ,
(11.28)
An overall material balance would relate L* and V* at every axial location inside the permeator module: LF = L + V
(11.29a)
L* = 1 - V*
(11.29b)
or,
Based on the following identities d x / d z * = [ d { L * x } / d z * - x dL*/dz*] / L*
(11.30a)
d y / d z * = [ d { V * y } / d z * - y dV*/dz*] / V*
(11.30b)
and
one can formulate a set of four differential equations involving x, y, V* and ? which will conveniently describe the permeation process. The equations are listed in Table 11.2. In order to describe the problem completely, the boundary conditions need to be specified. For x and V*, these are straightforward: at z* = 0, x = XF;
(11.31a)
522
11 --ANALYSIS AND DESIGN OF MEMBRANE PERMEATORS FOR GAS SEPARATION
TABLE 11.2 G o v e r n i n g equations for hollow-fiber permeators: b i n a r y system a n d shell-side feed C o c u r r e n t flow: d x / d z , = - K l [ a ( 1 - x ) ( x - yy) - x{(1 - x) - 7(1 - y)}]/(1 - V*) d y / d z * = K l [ a ( 1 - y)(x - TY) - y{(1 - x) - 7(1 - y)}]/V, dV,/dz,
du
= K l [ a ( x - yy) + {(1 - x) - 7(1 - r)}]
=-K2 V*~
B o u n d a r y conditions: at z* = 0, x = xF; y = ~(x,u
V* - 0
at z* = 1, 7 = ~2(7~V*)
Countercurrent flow: d x / d z * = Kl[a(1 - x ) ( x - yy) - x{(1 - x) - 7(1 - y)}]/L* d y / d z * = Kl[a(1 - y)(x - yy) - y{(1 - x) - 7(1 - y)}]/V, dV,/dz,
= rl[a(x-
yy) + {(1 - x) - 7(1 - y)}]
dL,/dz,
= Kl[a(x-
yy) + {(1 - x) - 7(1 - y)}]
du
= - K 2 V*/~
B o u n d a r y conditions: at z* = 0, y = ~1(x,u and V* = 0 at z* = 1, u = ~2(u x = XF; a n d L* = 1 H e r e K1 = x DIM IE NT PF Q2 / LF, K2 = 128 B Rg TIE LF/0t D~ N T / ~ ) a n d ~1 a n d ~2 are functionalities described b y Eqs. (11.32) and (11.31c), respectively.
V* = 0
(11.31b)
For T and y the boundary conditions are more complicated. The permeate outlet pressure is a given quantity, designated by 7o (= PPo / PF). There would be some pressure drop along the potted section of the hollow fiber. The correct boundary condition would, therefore, be: at z, = 1, 7 = [72o+ 2 K 2
V* lp//E] 1/2 = (~2 ( V * )
(11.31c)
Note that this is a coupled boundary condition, since V* is not known a priori at Z * = 1. The value
of y at the plugged
the local relative
end of the hollow
rates of permeation,
fibers will be determined
by
i.e.
a t z* = O, y = { d t V y ] / d z } / ~ d V / d z }
= {d[V*y]/dz*}/~dV*/dz*}
orr
atz*=O, y = a ( x - yg)/[c~(x- yg)+{(1-x)-7(1-y)}]
(11.31d)
11 -- ANALYSIS A N D DESIGN O F M E M B R A N E
PERIvIEATORS F O R G A S S E P A R A T I O N
523
The above is a quadratic in y, which can be solved to calculate y at z* = 0 as a function of x and y at z* = 0. The solution is y = {1 + (a-1)(xF+ u - [{1 + (a-1)(xF+ y)}2_ 4a(a-1) YxFll/2}/~2(a-1)~ = ~ ( x F , ~')
(11.32)
Note that y is not known at z* = 0. Thus, we need to solve a split boundary value problem here. At the feed end, two explicit conditions and one coupled condi'tion are specified, whereas at the residue end, one coupled condition is specified. The solution of the above set of equations would provide us with the following quantities of interest: (a) V* at z* = 1, which is the stage cut; (b) x and y at z* = 1, which are the residue and permeate mole fractions of the faster component; and (c) y at z* = 0, which indicates the extent of permeate pressure buildup inside the fiber lumen. For the countercurrent flow condition, shown in Fig. 11.10b, the governing equations can be set up in a similar manner with a few changes. The integration is still carried out from the closed fiber end. The differential equation for y, V* and y in this case are identical to those for cocurrent; only the equation for x has an opposite sign. The material balance is necessarily different, and Eqs. (11.29a) and (11.29b) may be replaced by: L= V +
LR =
V+ LF-Vp
(11.33a)
or, L* = V* + LR* = V* + 1 - Vp*
(11.33b)
Since LR* and Vp* are not k n o w n a priori, it is advisable not to express L* in terms of these quantities. Instead, it is preferable to include L* as an extra variable like V*. The governing equations and the boundary conditions are listed in Table 11.2. Because V* = 0 at z* = 0, the differential equation for y becomes indeterminate at that location for either flow pattern. It is necessary to employ L'Hospital rule in this case. Thus, at z* = 0, dy/dz, = K~[d/dz,[a(1-y)(x-'~ly) - y{1-x) - ~ l - y ) } l l / [ d V , / d z , ] (11.34a) The above equation can be rearranged as dy _ [oc - ( a - l ) y] dx/dz* dz* - 2{a(x- yy) + (1 - x) - y(1-y)} + y[a - ( a - l ) y]
(11.34b)
The dimensionless constants K1 and/500
tube
0 4 4-14 dynamic 10 150--8000 4-120 4-5000 200-1000 200-5000 200 25-200
tube tube tube tube tube tube tube capillary monolith/tube tube tube tube disk
Mott,Pall Osmonics SFEC UC Carre TDK Ceram Filters Asahi,Fuji,Schott Alcoa/SeT Norton/Millipore NGK Hoogovens Anotec/ Alcan
1 2 - GAS SEPARATION USING INORGANIC MEMBRANES
555
TABLE12.2 Knudsen separation factor ~ of some typical gas mixtures Gas mixture
a*
U235~6/U238F6
1.0036
O2/N2
0.94
CO2/CH 4
0.60
H2/CI-I4 He/CH4
2.83 2.00
H2/N 2 H2/C3I-I8 H2/C6I-I12
3.74 4.69 6.48
From the definition given above for Knudsen diffusion it can be stated that it is not the type of material that is important but the structure in comparison with the pressure and temperature of the gas mixture to separate. Therefore, an exact pore size regime for Knudsen diffusion behavior cannot be given, but the pores have to be larger than 2 nm, and for nuclear fuel separation, smaller than 200 nm. Near standard conditions (100 kPa and 20~ the upper limit is in the order of 50 nm. Under standard conditions, porous inorganic membranes with pores in the range of 2 to 50 run have, in gas separation processes, no particular advantages over organic membranes with the same structure. Inorganic membranes have advantages, however, if radiation occurs, the pressure is great, or if the temperature is higher than 100~ A large advantage of Knudsen diffusion transport is the high value of the permeability. For an alumina membrane top layer with a thickness of 5 ~tm and a pore diameter of 50 nm on a porous support with large pores, the permeability is 200x10 -6 mol m -2 s-1Pa -1 for hydrogen. This SI-related unit can be translated to units used in commercial applications like N m 3 H2 m -2 bar -1 day -1. In the above mentioned membrane, this value will be 45,000 Nm 3 H2 m -2 bar -1 day -1 at room temperature or 3600 kg H2 m -2 bar -1 day -1 [10] (Section 12.3.2). Another possible method of enhancing the separation factor is to use an extra transport mechanism for one of the gases, for example, surface diffusion, multilayer diffusion and capillary condensation. For surface diffusion, it is difficult to predict in which direction the separation factor will change, and the changes are never larger than a factor of 2 to 3 (Section 12.3.2). For multilayer diffusion, and especially capillary condensation, separation factors can increase greatly up to 1000. These types of separations are only possible if one condensable gas is present. The separation process can be optimized by choosing a good combination of pressure and temperature (Section 12.3.2).
556
12-- GASSEPARATIONUSINGINORGANICMEMBRANES
If m o r e selective membranes are necessary for an actual separation process, the pore size has to be decreased to values smaller than 2 n m or dense materials have to be used (Sections 12.3.3 and 12.3.4). In Section 12.2, possible inorganic m e m b r a n e structures, types of m e m b r a n e s and m e m b r a n e preparation and modification are described. In Section 12.3, inorganic m e m b r a n e separation mechanisms will be considered together with their potential for gas separation. Section 12.4 of this chapter will consider w h y - - and in which cases - - gas separation w i t h inorganic m e m b r a n e s can have an a d v a n t a g e over other separation possibilities. In Section 12.5, an evaluation and conclusions will be given concerning the application possibilities of gas separation with inorganic membranes." 12.2 MEMBRANE STRUCTURE, PREPARATION A N D MODIFICATION
12.2.1 Membrane Structure Before treating the m e m b r a n e structure it is necessary to make some agreem e n t concerning the terminology of pore diameter used in this paper. From a materials science and catalysis point of view, the terminology is standardized by the IUPAC definitions [11] as s h o w n in Table 12.3. The corresponding types of filtration, as used in m e m b r a n e and filtration literature, are also shown is this table. For gas transport through porous or dense materials this classification also makes sense, as s h o w n in Section 12.3. Possible structures of inorganic m e m b r a n e s are s h o w n in Fig. 12.1. Structure A is a h o m o g e n e o u s structure, which can be found in porous metal sheets, in porous glass capillaries of the Vycor-type [12], or in alumina prepared by anodization [13,14]. Pore sizes found in these types of materials are at least 3 TABLE 12.3 Terminology of pore diameters dp according to IUPAC definitions [11] and the type of filtration belonging to that pore size Terminology
Pore diameter (nm)
Type of filtration
macropores mesopores micropores dense
dp > 50 2 < dp < 50 dp < 2 dp = 0
microfiltration ultrafiltration nanofiltration/gas separation solution/diffusion
* The unit of permeability throughout this chapter will be mol rn-s S-1 Pa -1, the actual amount which permeates through a membrane; the membrane thickness will be mentioned separately; Barter will not be used, this is not a SI-unit and the membrane thickness is not always known. For some separation mechanisms the diffusionthrough the membrane is not proportionalto the pressure differencebetween feed and permeate, the used unit will then be mentioned separately.
557
12 -- GAS SEPARATION USING INORGANIC MEMBRANES
(a)
[
I
(b)
I
-
!
(o)
I
Fig. 12.1. The possible porous structures of inorganic membranes: (a) h o m o g e n e o u s structure; (b) asymmetric structure; (c) composite structure as realized in ceramic membranes.
nm (glass) up to values larger than 1 ~m for metal sheets. Homogeneous membranes should be as thin as possible, because otherwise the permeability is too small for practical applications. A more attractive structure for membranes is the asymmetric structure, shown in Fig. 12.1b. However, it is rather difficult to obtain such a structure in inorganic materials. At present there is only one commercial ceramic system with such a structure, the anodized alumina of Anotec/Alcan (Table 12.1). This structure is shown in Fig. 12.2. The support side has pores in the order of 200 nm, the top side pores being in the order of 25 nm. Thus far, large tubular surfaces cannot be obtained with this method. 12.2.2 Membrane Preparation
For ceramic or partly ceramic membranes, composite types of structures are easiest to fabricate. Tubes or monolithic elements with several channels can be fabricated by slip-casting, extruding or other ceramic shaping methods. For carbon supports, pyrolysis of polymeric precursor or pressing of carbon material are common techniques. The pore size obtained in these materials can be typically 5-15 ~tm after sintering at 1400-1600~ (for alumina). The porosity is typically 40-50% or somewhat higher for carbon. These tubes, multichannels or plates can act as a support for a microfiltration layer with pores of 0.2-1 ~m [15,16], a thickness of 10-50 ~un and a porosity of 40-50 percent. Terpstra et al. use a suspension of a-A1203 powder particles for film-coating an alumina layer on a porous support. The thickness of the coated layer can be adjusted by changing the suspension viscosity. This can be done,
558
12 - - GAS SEPARATION USING INORGANIC MEMBRANES
Fig. 12.2.An anodized alumina membranewith an asymmetricstructure (picture courtesyof Alcan InternationalLtd., Banbury,UK). for instance, by changing the solid contents of the suspension. To prevent the formation of pinholes in the layer, the capillary suction of the pores of the support is suppressed. These types of layers have to be sintered at a temperature between 1200 and 1450~ depending on the powder particle size used and the resulting pore structure. It is possible to prepare more than one layer on the support, as shown in Fig. 12.3, and, in principle, the number of layers is not limited. The preparation of a second and third layer is based on the same principle. In general, the pore size of the ultimate layer is the smallest, as also holds for the layer thickness. This is obvious, because this layer determines selectivity and the permeability of the total membrane system. This technique is suitable to apply layers with pore sizes ranging from 50 to 5000 nm. On carbon tubes, very fine ZrO2 suspensions are used which results in pore sizes in the order of 10 nm [17]. The above-mentioned suspensions are prepared by milling standard powders but even finer particles can be obtained by the hydrolysis of salts or alkoxides of, e.g., AI(III), Ti(IV), Zr0V), Si(IV) or other ions. By good control of the physical and chemical parameters, colloidal suspensions (sols) are then obtained. With these suspensions, so-called sol-gel techniques can be applied using the capillary force of the support [18] or suppressing the capillary force of the support (see, e.g., Ref. [19]). The advantage of using the support capillary force is that the adherence between top layer and support is very good, a sharp pore size distribution is obtained and a layer thickness up to 10 Ira1 can easily be achieved within 10 seconds with this cake filtration (slip casting) process. A
12 - - GAS SEPARATION USING INORGANIC MEMBRANES
,559
Fig. 12.3. SEM picture of an all-alumina membrane consisting of a macroporous support, two film coating layers with pores of 0.2 and I lan and an sol-gel top layer with a thickness of 8 Ima and with pores of the order of 3 nm.
difficulty is that the support quality should be very good and that the pore size in the top of the support should not be larger than I I~m because otherwise, the capillary force at the beginning of the slip-casting process is too weak. It is obvious from Fig. 12.3 that not only can the macroporous support be used as a carrier for the top layer but that also multilayer supports with some microfiltration layers can act as a support for the top layer. The disadvantage of suppressing the capillary force is that the adherence is less strong, the pore size distribution is less sharp and the layer thickness is more difficult to control. Also in this case, the viscosity of the colloidal suspension is the most important parameter in controlling the thickness. For thicknesses more than 10 llm, multiple dipping procedures are necessary. To obtain crack-free membrane top layers in this way, process parameters like drying, calcining and sintering have to be carefully controlled. In most cases organic additives are used as drying-controlled chemical agents (DCCA) or to adjust the viscosity of the colloidal suspension. These additives are burned out during the calcination and sintering process. The pore size and pore size distribution in the final product are more or less affected by the use of the additives.
560
12 u GAS SEPARATIONUSINGINORGANICMEMBRANES
A
B
G
D
Fig. 12.4. Schematic representation of the modified membrane toplayer structures: (A) monolayer or multilayer deposit; (B) nanoparticles within pore, partial plugging; (C) plugs in the pore entrance, film on top of the membrane; 0D) plugs or constrictions at a certain site in the top layer.
In this way, alumina and titania top layers are prepared on porous oxides or glass supports [18-21]. ZrO2 top layers are prepared on carbon [22] and on alumina supports [19] and silica top layers on alumina supports [23,24]. The porous structure of all these top layers with thicknesses less than 10 ~m ranges from mesoporous to macroporous (dp > 3 nm). Microporous systems (dp < 2 nm) cannot be achieved with the technique using colloidal suspensions. These structures are suitable for gas separation by Knudsen diffusion transport, as shown in Table 12.2, surface diffusion, multilayer diffusion and capillary condensation. Effective transport by surface diffusion, multilayer diffusion or capillary condensation is only possible in pores smaller than 10 nm. Furthermore, the mesoporous membrane systems (obtained commercially or in laboratory experiments) can be modified, as shown in Fig. 12.4, in order to obtain microporous or dense systems in a very thin layer (< 100 nm, Fig. 12.4C).
12.2.3 Membrane Modification In Fig. 12.4, the nanostructures of modified inorganic membrane top layers are shown. Structure A is obtained by depositing a monolayer or a multilayer on the surface of the top layer pores. This type of modification can bring the pore size into the microporous range or gives the internal top layer surface a catalytic activity in nonseparative applications (see following sections). The same holds for structure B in which nanoparticles are deposited instead of a
12 - - GAS S E P A R A T I O N USING I N O R G A N I C MEMBRANES
561
continuous layer. There are techniques in which only the top layer is modified and even the site of the modification within the top layer can be controlled [25-27]. Structure C is obtained by depositing a polymeric gel on top or partly in the membrane top layer [10,28-33]. By controlling pH and temperature, tetraethylorthosilicate or other alkoxide components can be polymerized with a distinct amount of water and the inorganic polymer chain length and chain branching can be controlled. Inorganic polymers with a molecular weight smaller than 1000 and having straight chains can be obtained and packed thoroughly on top or partly in the membrane top layer. A pore size of I nm or less can be obtained in a layer of about a 50 nm thickness. The thermal stability of silica chains is high and the structure can be maintained up to 700~ The water sensitivity of silica can be suppressed by using inorganic copolymers. Structure D is realized by Chemical Vapor Deposition (CVD) techniques in which a metal organic component enters from one side of the membrane and a reactant (like water) enters from the other side of the membrane. The membrane can be homogeneous (Vycor glass [34-37] or a composite system [92]. Depending on the structure of the material and the process parameters the deposition will be dense or (micro)porous and will be located somewhere within the membrane or the membrane top layer. Thicknesses can vary between 100 nm and several microns, but the process itself is not completely established at present. The conclusions from this section are that, based on materials science principles, all kinds of structures in the macroporous/mesoporous, microporous or dense regimes can be obtained. There are some limits in the thickness of the selective layer obtained which are related to the material process parameters but also to the quality of the support structure. In ceramic composite membrane systems modification techniques, which result in microporous systems and dense structures, are possible. The research and development of micropore systems and ultrathin, dense systems with controlled properties is, however, in its infancy.
12.3 T R A N S P O R T OF GASES T H R O U G H MEMBRANES
Abundant literature has been published concerning transport of gases and vapors through porous and dense materials. Graham (1833) published early quantitative data in one of the first issues of PhilosophicalMagazine, and since that time, the amount of papers has increased steadily. For membrane applications it is, however, appropriate to restrict ourselves to the transport regimes that can be related to the membrane structures which are obtainable. An additional approach is that equations for gas and vapor transport are simplified to useful equations for process engineers, materials scientists and engineers and
562
12 ~ GAS SEPARATION USING INORGANIC MEMBRANES
membrane experts. In this chapter gas transport through porous media is related to the pore size classification shown in Table 12.3.
12.3.1 Pore size dp > 50 nm In this regime, Knudsen diffusion, bulk diffusion and laminar flow occur (we exclude turbulent flow at pore sizes larger than 5 ~m). These transport mechanisms hold for a single gas. If a pressure gradient is applied in this regime where laminar flow is present, the bulk diffusion is less than 1% of the laminar flow, so bulk diffusion is omitted in the transport equation. The transport equation then becomes [28-31,38-40]: 2E~kV~ E~pr 2 Fo = 3R-----~+ 8nRT P
(12.2)
where Fo is the total permeability (mol m -2 s -1 Pa-1), ~ is the porosity, r is the modal pore radius of the medium (m), ~k and I~p are shape factors--- which are both, in general, equal to the reciprocal tortuosity of the medium (which may vary between 2 and 10), R is the gas constant (= 8.31J mo1-1 K-l), T is the absolute temperature (K), P is the mean pressure (Pa), TI is the viscosity of the gas (in Pa s -1) and v is the average molecular velocity (m s-l), which is:
= ~8RT ~M
(12.3)
where M is the molecular mass of a gas molecule. The first term on the right-hand side represents the Knudsen diffusion, the second term is the laminar-flow contribution. In Fig. 12.5 the N2 permeability of a 2-mm-thick homogeneous support is shown with pores of 120 nm and a porosity of 45% (see arrow). From this curve the Knudsen diffusion contribution is easily found at an average pressure P = 0. The laminar-flow contribution is represented by the slope of the curve and increases with increasing average pressure as expected from Eq. 12.2. This is easily understood, because the mean free path of the molecules - - as well as the Knudsen n u m b e r - - becomes smaller with increasing pressure (Eq. 12.1). If the permeability of one gas is measured for a certain membrane material, the permeability of a second gas (e.g., He or Ar) can be calculated quite accurately (to within 5%). The only parameters are the molecular mass and the viscosity of the gas. At P = 0 the permeability ratio between two gases A and B is:
.
FoA ~ / M .
a - F~s -
M^
(12.4)
12 - - GAS SEPARATION USING INORGANIC MEMBRANES
F0 :Fok+FOp :
S[
2.Z'Pk'F'q 3 RTL
563
§ _r -2_.~ 811 RTL
Lain. flow A .,
O. i/t
,',;3 E
"6 E
"
A
A
1
A
A
N2
~2
~
Support
o0
, 50
,oo ,'SO 2;0 Pressure P (k Pa )
250
Fig. 12.5. The N2 permeability of an alumina porous support (see arrow) with a pore size of 120 nm, a thickness of 2 mm, a porosity of 45%, and a shape factor of 0.4. Curve A represents the permeability of the top layer with a pore size of 3 nm, a thickness of 3 pro, a porosity of 50% and a shape factor of 0.16. The laminar-flow carve is shown as an example. w h e r e MA a n d MB represent the masses of molecules A and B respectively. At higher pressures the viscosity 11 of gas B (viz. He or Ar) should be taken into account. In this w a y it is possible to determine the permselectivity of several gases for this m e m b r a n e material by measuring only one gas as a function of the average pressure. This permselectivity is always smaller t h a n mentioned in Table 12.2 because of the laminar-flow contribution. However, the m e a s u r e m e n t of pure gas permeability cannot be used for multigas transport through the same membrane. There are several reasons for the differences in measuring single gas or multigas transport t h r o u g h m e m branes with pores larger than 50 nm. The three main reasons for this are: (a) There-will be a m o m e n t u m exchange between the molecules of different masses. In that case gas transport is described w i t h complex models [1] or the d u s t y gas model [41]. (b) The pressure ratio Pr (defined as the back pressure divided by the feed pressure). The actual separation factor a will then be
a = 1+
(1 - Pr) (a* - 1)
1 + Pr(1 - y ) (a* - 1) where
(12.5)
564
12 - - G A S SEPARATION USING INORGANIC MEMBRANES
O~'-
y 1-y
1-x x
where y is the mole fraction of the faster permeating component in the permeate and x is the mole fraction of this component in the feed. At Pr = 0, tz is equal to ix*if other factors in the change of tz are omitted. Haraya et al. [3-5] have shown some experimental data of this phenomenon. (c) Concentration polarization, which occurs rather quickly in a cross-flow situation because of the high permeabilities of these porous membranes [4]. Reasons (b) and (c) are related to process parameters and, therefore, also occur in membrane systems with pores smaller than 50 nm. In all these cases the multigas transport selectivity is smaller than the selectivity defined by the ratio of single gas permeability. Optimization of process parameters is therefore one of the major research goals in gas transport through pores larger than 2 nm and, for this reason, a lot of effort is applied in the U F 6 separation. 12.3.2 Pore Size 2 nm < dp < 50 n m
In this pore region the laminar-flow contribution becomes less important and at pressures smaller than 1 MPa the gas transport through the porous membrane becomes independent of the average pressure, as shown in Fig. 12.5 (curve A). This curve represents the calculated permeability of an alumina top layer with a thickness of 3 I~m, a porosity of 50% and a tortuosity of 0.16 on a porous support (see arrow). The pore size of the top layer is 3 nm. The calculation method is shown elsewhere [38]. For this situation the laminar-flow term, as presented in Eq. 12.2, is negligible. In this pore regime, two other transport mechanisms become more important; surface diffusion and multilayer diffusion/ capillary condensation. Surface diffusion occurs if one or several of the gases in a mixture, which transport through the membrane, experiences an interaction with the material of the pore wall. There are at least three models to describe the transport of these types of gases along the surface: the hydrodynamic model, the hopping model and the random walk model. The last one is based on a two-dimensional form of Fick's law: I Fsl = A Papp Ds I~s dq dl
(12.7)
where Fs is the surface transport (kg m-3), A the outer surface area (m2), Pappthe apparent density (kg/m3), Ds the surface diffusion coefficient (m 2 s-1) and d q / d l the gradient in surface occupation. In rewriting the surface diffusion transport [28-31], one finds that:
12 - - GAS SEPARATION USING INORGANIC MEMBRANES
565
I Fsl 2e~s Ds dxs Fos =" AP - ~ Ao NAy dP
(12.8)
where Ps is the surface diffusion shape factor, Ao is the surface area occupied by one molecule (m2), NAV is Avogadro's number, and Xs is the fractional occupation of the surface in relation to a monolayer. Surface diffusion and Knudsen diffusion can be treated as a combined transport, so for pores with 2 < dp < 50 nm the total permeability Fo is:
Fo = FoK + Fos =
2E ~tk v ~
3RT
2E ~ts Ds
dxs
+ -r Ao NAy . dp
(12.9)
If the nonmaterial parameters are lumped together, it follows that:
Fo =~t(A-f + B 1 )
(12.10)
under the assumption that ~t = ~tk = ~ts and that the effective r is not changed by the amount adsorbed. The surface diffusion contribution increases, then, with decreasing pore size. However the effectiveness of surface diffusion is dependent on the value of Ds times dxs/dP (amount adsorbed as a function of pressure). These two parameters conflict with each other. On a given surface the amount of physically/ chemically adsorbed molecules can be increased by increasing the adsorption/interaction energy. The energy of diffusion/migration, which is coupled to the energy of adsorption, is then also increased, which results in a lower mobility over the surface. The reverse is also true. The disadvantage of physical adsorption is that it is not very selective for a distinct gas and therefore generally does not increase the separation efficiency. The ratio between surface diffusion and gas diff~asion is limited, i.e., for CO2 on alumina or for Vycor-type glass this value is about 0.4 to 2. For CH4 this value on the same materials is smaller than 0.3. This means, for instance, that CH4/ CO2 surface diffusion has a negative effect on the separation of CH4/CO2 in mesoporous systems. CH4 transport according to Knudsen diffusion is faster than that of CO2 (Table 12.2: (x* = 1.65), according to surface diffusion it is slower. The total effect is that there is almost no separation. The same holds for the separation of hydrocarbons like C2H6, C3I~ or i-butane from low-mass molecules [42-44]. The trend is that heavier molecules show larger surface diffusion, which counteracts the separation efficiency by Knudsen diffusion. Oxygen and nitrogen show no measurable surface diffusion on oxides and some surface diffusion on carbon types of materials. Almost all literature data are shown at pressures between 0-100 kPa and temperatures between 0 and 100~ At higher pressures and temperatures the surface diffusion contribution in relation with gas diffusion is smaller (e.g. Ref. [30]).
566
12 m GAS SEPARATION USING INORGANIC MEMBRANES
TABLE 12.4 Critical constants and saturated vapor pressure at 20~ for a number of gases [93,94] Gas
Tc(~
Pc (MPa)
Po(20~ ~(10+sPa)
CO2 NH3 H2S SO2 H20 CI-I4 02 N2 C2I-I6
31 132.5 100.4 157.8 374 -82 -118 -147 32 9.9 96.8 92 152 146
7.3 11.3 8.9 7.8 21.8 4.6 5.0 3.4 4.8 5.1 4.2 4.5 3.8 4.0
57.1 8.7 17.9 3.6 0.023
C2H4
C3I-I8 C3I-I6 n-C4H10 n-C4H8
37.5 8.40 10.17 2.08 2.51
One exception is H2 surface diffusion. It can occur at some higher temperatures (up to 300~ [30]) in the presence of precious metals (Pt, Pd or Ag). The pressure should, however, be low (P < 50 kPa) for a contribution in relation with gas diffusion of over 100%. Uhlhorn et al. [30] found that the surface diffusion of H2 could be two times the gas diffusion in a silver modified alumina membrane. The advantage is that Knudsen diffusion for H2 is faster than for any other gas. In this w a y a H2-to-N2 transport ratio of about 9 could be found. In s u m m a r y , surface diffusion seems to be less suitable for enhancing gas separation with mesoporous materials with the possible exeption of a H2/other gas separation on precious metal modified membranes. If the temperature is decreased and the pressure is increased multilayer diffusion and capillary condensation in mesoporous systems can occur. The gas (vapor) should in those cases be near or u n d e r the critical temperature. In Table 12.4 critical parameters and the vapor pressure at room temperature are s h o w n for a n u m b e r of gases. Near room temperature most of those gases are condensable except for 02, N2 and CI-I4 and will show surface/multilayer diffusion by physical adsorption in oxidic or carbon types of membranes. At a certain pressure at the high pressure side of the m e m b r a n e the vapor will condense in the porous structure of the m e m b r a n e according to the Kelvin equation:
12 - - GAS SEPARATION USING INORGANIC MEMBRANES
Pt 27VmcosO In Por" RT
567
(12.11)
where Pt is the capillary condensation pressure (Pa), Po the saturated vapor pressure (Pa), y the interfacial tension (N m-I), 0 the contact (wetting) angle, r' the actual radius of a cylindrical-shaped pore and Vm the molar volume of the liquid component (m -3 mol-1). It should be noted that r' is effectively smaller than the pore radius itself because of adsorption of vapor before condensation (t-layer). In most cases capillary condensation takes place at 0.5-0.8 of the saturated vapor pressure Po. Although a number of regimes can be distinguished with this kind of transport [45] two regimes are most important: (a) multilayer adsorption across the entire pore surface so the actual pressure in the membrane is always smaller than the capillary conden~sation pressure. This adsorption can introduce an extra transport of a larger vapor molecule along the surface in comparison with a smaller gas molecule. As an example, the transport of N2 and C 3 ~ molecules through mesoporous membranes is shown. The Knudsen gas diffusion ratio for N2 and C3H6 is 0.82 and is valid for low relative pressures of propene (see also Eq. 12.11). At higher relative pressures of propene this ratio increases to I and changes to 1.5 at a relative pressure of 0.42 for C3H6 as shown in Fig. 12.6A. This means that propene, as the larger molecule, permeates faster through the membrane than the smaller nitrogen molecule. In a N2-C3H6 gas mixture the separation factor (x as defined in Eq. 12.6 is 2.0. This value is larger than the ratio of 1.5 for pure gas permeabilities because of a partial blockage of the pores for N2. For the gas phase transport of N2 a smaller effectivepore size is available (see previous sections). (b) capillary condensation at the feed side and multilayer diffusion at the permeate side. Now a part of the pores is filled with liquid and the pore is blocked for any gas transport. Then the permselectivity increases further. At a relative pressure of 0.78 at the feed side, the C3H4/N2 in pure gas permeation is 7.1 [10,46]. In a gas mixture the separation factor is 13 as shown in Fig. 12.6B due to blocking of the pore for N2 transport and the low solubility of N2 in a C3I-~ liquid. However this value should be larger, as shown by Barrer [47], for a H2/SO2 mixture through a carbon plug. He found enrichment factors of 1000 for S O 2 at P/Po of 0.75. It can therefore be concluded that some pores of the alumina top layer are not filled with liquid. This can be due to the presence of some larger pores (order 10 nm) and to an incomplete wetting of propene on alumina. Permeabilities are extremely large (3x10⁻⁵ mol m - 2 8 -1 Pa -1 is equal to 6500 N m - 3 m - 2 day -1 bar -1 for propylene) as shown in Fig. 12.6A. The actual separation can be increased to 75 at the same relative pressure by modification of the
568 A
12- - GASSEPARATIONUSINGINORGANICMEMBRANES
r
35
~-
25
~
2o
4o
30
i_
~
m
0
E
v
15
_~ lO
o 0.00
r
III
~o
9
i
,
0
,
O.50
1.00
0.00
Rel. pressure
~+ 0I m )
1000) but the permeability is lower for the more selective membranes. The separation factor can increase as well with a decrease in
12--GAS SEPARATIONUSINGI N O R G A N I C
571
MEMBRANES
TABLE 12.5 Permeabilities and permselectivities at room temperature of 3 gases through a molecular sieve carbon membrane according to Ref. [50] Gas
Permeability m s rn-2 bar-1 day-1
permeabili.ty mol m - 2 $ -1 Pa-1 (10 s)
Selectivity mixture
02 N2 He
12 1.6 35
5.4 0.8 16.4
O2/N2 = 7 He/N2 = 21 He/O2 = 3
Thickness of carbon membrane is 6 gin; an organic hollow fiber membrane is pyrolized at 800~ and activated two times by slight oxidation at 600~ TABLE 12.6 Separation factors c~and permeabilities of H2 in comparison with other gases by diffusion through microporous and dense membranes Gas mixture
0c
Permeability m 3 mol m-2 s-1 m - 2 bar -1 day-1 Pa(10-8)
Temp. (~
Material
Ref.
H2/C3H6
160 200 2000 12 56 32 35 >1000
300 300 3 0.8 21 35 16 0.1-2"
200 150 450 200 200 200 25 200
SiO2 SiO2-TiO2 SiO2-#ass SiO2-glass carbon carbon carbon Pd metal
[10]
H2/CH4 H2/N2 H2/N2 H2/CH4
H2/any
160 160 1.6 0.4 11 18 8 -
[34] [36,37] [51]
[54]
The feed and permeate pressure are 1 and 0 resp.; the membrane thickness is 200 and 1 gm respectively.
t e m p e r a t u r e d e p e n d i n g o n the activation t r a n s p o r t for a distinct molecule. This is o n e of the criteria u s e d to d i s c r i m i n a t e b e t w e e n m i c r o p o r e s a n d m e s o p o r e s . The t r a n s p o r t rate in m e s o p o r e s decreases w i t h t e m p e r a t u r e , in m i c r o p o r e s increases w i t h t e m p e r a t u r e . The activation energies in p o r o u s s y t e m s are in m o s t cases small (< 10 kJ mol-1), w h i c h is s m a l l e r t h a n in d e n s e s y s t e m s . A c t i v a t i o n e n e r g i e s for H2 t r a n s p o r t in d e n s e m a t e r i a l s are at least 20 kJ mo1-1. In silica s y s t e m s all k i n d of s t r u c t u r e s a n d layer t h i c k n e s s e s (50-200 n m ) can be o b t a i n e d w i t h s o l - g e l a n d v a p o r d e p o s i t i o n t e c h n i q u e s b u t b e c a u s e of the small scale of the s t r u c t u r e at p r e s e n t p r o c e s s control is difficult a n d still a m a t t e r of research. A s e c o n d p r o b l e m w i t h the u s e of silica is the s e n s i t i v i t y of t h e s t r u c t u r e to w a t e r . T h e m i c r o p o r o u s silica s t r u c t u r e d e n s i t i e s in t h e
572
12 - - GAS SEPARATION USING INORGANIC MEMBRANES
presence of water and the permeability decreases. In several groups including ours, research is carried out to suppress this chemical instability. To optimize process control it is necessary to know the microporous structure as a function of the process parameters. Physical and chemical characterization is then a must and gas adsorption, as a function of pressure and temperature, is a good possibility in combination with the transport properties of several gases. A problem is that pore size calculations in the microporous region are not easy and the theories are still in development. Physical adsorption and permporometry can, however, be used as a finger print characterization method for the actual structure. With more structural information, gas separation can be better controlled and directed to gas mixtures not including H2. Uhlhorn [10,32] has already found a preferential transport of CO2 over CH4 with leads to a separation factor of a gas mixture 50 CO2-50 CH4 of 60 at a temperature of 100~ These kinds of results change drastically, however if the preparation procedure is not carefully controlled. Furthermore it seems that elevated temperatures (100~176 are necessary for more optimal separation properties. In activated carbon [50,51] the structure can also be varied from dense to microporous in all varieties by partial oxidation (activation) at a temperature of at least 400~ It seems that room temperature gas transport properties are somewhat better than in silica but at elevated temperatures the properties do not improve as is the case for silica-type membranes. The conclusion is that with microporous structures, which are obtained by modification of mesoporous/macroporous structures, high H2 separation selectivities can be obtained while good possibilities exist for other gases. Selectivities, but especially permeabilities, are better at elevated temperatures. The structural sensitivity of silica systems to water should, however, be improved. Physical and chemical characterization of the microporous structure during preparation is a must for better control of that microporous structure and thus a control of the separation properties. 12.3.4 Dense Membranes; Pore Size dp = 0 n m .
The transition from microporous to dense materials is a gradual one especially in silica systems (e.g., from microporous silica to silica glass). This is especially true for ultrathin- a n d / o r ultrafine-grained materials where grain boundaries can hardly be distinguished from micropores and where nanoparticles and microdomains in glass have similar dimensions. A criterium to distinguish between dense and microporous material can probably be found in the activation energy of the transport and in the adsorption capacity. In denser materials the transport (diffusion) is more strongly activated than in microporous systems. Besides dense silica (only for H2 and He transport) other dense
573
12 --GAS SEPARATION USING INORGANIC MEMBRANES
inorganic materials can act as m e m b r a n e materials. In this chapter three types of materials are mentioned: (a) immobilized inorganic liquids (LIM) incorporated in p o r o u s structures; (b) dense metal sheets based on p a l l a d i u m (Pd); (c) dense ceramics with oxygen ion conduction.
(a) Immobilized Inorganic Liquids Inorganic salts with relatively low melting points can be immobilized as a liquid in porous solids d u e to the capillary forces of the p o r o u s solid [52,53]. The porous solid is a metal or a ceramic. The wetting of the liquid should be good, otherwise the immobilization becomes poor. The Y o u n g - L a p l a c e equation can be used to determine the blow-out pressure AP: 2 7 cos0
AP = ~
(12.12)
y
w h e r e y is the interfacial tension (N m-l), 0 is the wetting angle and r is the equivalent spherical pore radius. In two patents Pez and Carlin [52,53] give some results for the transport properties that can be achieved, and some examples are s h o w n in Table 12.7. In immobilized liquid LiNO3 (mp 270~ O2/N2 separation is possible w i t h a TABLE 12.7 Gas separation properties with dense membrane materials Membrane material
Gas
PermeabiliW (mol m-2 s-I)
Permeability Temp. (tool m-2 day-1) (~
Ref.
LiNO3/porous metal
O2
70/bar 0.4/bar 950 0.3 0.1-2 0.006--0.04 0.15 5 45
[52,53]
N2
3.5x10⁻⁷/pa 2.0xl0-9/pa 4.9x10⁻⁶/pa 1.5x10⁻⁹/Pa -
Pd (200-1 ].tm) dense ZrO2-Y203*
H2
-
02
Bi203-Er203*
02
(3-20)x10 -6 8x10-s 2.5x10⁻³ 2.3x10⁻²
N2
ZnCl2/porous metal
NH3 H2
La0.6Sr0.4CoO3*
02
SrCo0.sFe0.203*
02
429 429 311 311 311 200 1200 800 850 850
[52,53]
[54] [95] [55] [56] [56]
*The pressure on feed mid permeate side are 100 kPa and 10 Pa, respectively. The permeability is in this case proportional to In (Pf/Pp)where Pf and Pp are feed pressure and permeate pressure, respectively. **The pressure on feed and permeate side are 3 kPa and I Pa respectively. The membrane thickness is 0.5 ~tm.
574
12 - - GAS SEPARATION USING INORGANIC MEMBRANES
O2
FEED SIDE
N2
M*NO2 * '~ 02 -
t t t t
M,NO3
;
M + N O 2 "+ 8 9 PERMEATE
SIDE
M+NO3 " .... 02 PERMEATE
Fig. 12.9. Simplified transport scheme of nitrate and nitrite ions through a molten LiNO3to permeate oxygen. largest observed separation factor (z equal to 170 and a permeability for oxygen of 70 m 3 m -2 bar -1 d a y -1. The transport mechanism includes interconversion between nitrate and nitrite ions according to the reaction: 2 NO] ~ 2 NO~
(12.13)
+ 0 2
In the liquid nitrite and nitrate, ions are transported according to the scheme s h o w n in Fig. 12.9. Some oxygen and nitrogel~ molecules are transported by solution/diffusion but only a minor amount. ZnC12 (mp 283~ can transport a m m o n i a by the formation of a zinc ammoniate complex. The formation of this complex is very fast and the permeability of a m m o n i a can be very high (about 1000 m 3 m -2 bar -1 day -1, Table 12.7). For the transport mechanism there is also a simplified scheme, s h o w n in Fig. 12.10. The separations factors (NH3/N2 and NH3/H2) are both over 1000. Of course these reactions are also possible with other types of low- melting immobilized salts. In practice, serious problems arise. In the first place, the s o l i d / l i q u i d transition of the salt can be a problem because of expansion or
H2
NH3
FEED SIDE
N2
Zn2+2C1. + NH3 ~ Zn(NH3)2+ + 2 CI" t t
t t
;
9Z n 2 + 2 a . + N H 3 ,,
PERMEATE
~
Zn(NH3)2 + + 2 CI"
NH3 PERMEATE
SIDE
Fig. 12.10. Simplified scheme of zinc-ammonium complexes through an immobilized ZnCI2 molten salt.
12 - - GAS SEPARATION USING INORGANIC MEMBRANES
575
shrinkage of the liquid. Secondly, the salt should wet the porous solid structure; thirdly, the salt should not react with the basic porous structure, and in the fourth place, side reactions with present impurities as well as a slow decomposition of the salt can take place. Water is one of the components that can destroy the given reaction path. It is, however, worthwhile to do more research in this direction.
(b) Dense Metal Sheets Atomic hydrogen can easily dissolve in palladium and palladium alloys (with Ag, Ru, Ni, etc.). Sheets and sheets in tubular form can be prepared easily in thicknesses of 20 ~m or less. Therefore these sheets can act as membranes for selective transport of H2. At 200~ the permeability is relatively low (Table 12.6 and 12.7). At higher temperatures (400-500~ transport can be of the order of 10-20 m 3 m - 2 day -1. The permeability is not proportional to the partial pressure difference of H2 but one may approximate the permeation by a half-power pressure law [54]. The selectivity is, in principle, infinite. The problems with dense Pd films arise from the tz-~ phase transition of palladium and the dissolving mechanism of H2 in the metal. Both are coupled with volume changes (expansion) of the metal sheet. The sheet becomes brittle and can crack or even disintegrate. The price of these precious metals for large-scale applications can also be a problem.
(c) Dense Ceramics (Oxygen Ion Conductors) Dense ceramic systems are in principle impermeable for gas molecules. However, some oxide materials can transport oxygen as oxygen ions or hydrogen as protons at elevated temperatures. Oxygen ion transport becomes substantial at temperatures higher than 600~ Some data are shown in Table 12.7 for oxygen transport through dense oxygen ion conductors. These figures are for pressure-driven transport. If an electrical potential difference is applied these figures are higher especially for stabilized Z r O 2 and stabilized Bi2Oa. This occurs because only neutral species can be transported in the membrane, i.e. a combination of an negative oxygen ion and a positive electron hole (or a positive oxygen ion vacancy and an electron both in the opposite direction). With electrical potential, permeation holes or electrons are delivered by the electrical charge. Perovskites with high electronic (hole or electron) conductivity are reported to have a good high-temperature 02 permeability. Bouwmeester et al. [55] found, however, a permeability of a factor of 20 lower than the values reported by Teraoka [56], Table 12.7). Dense metals and inorganic membranes are very selective for H2 or 02
576
12 ~ GAS SEPARATIONUSING INORGANIC MEMBRANES
transport but permeability is in most cases relatively low and elevated temperatures are needed. With some materials permeability values come close to those obtained in microporous sytems have been obtained. Further improvements might be obtained by making ultrathin membranes of mixed conducting materials. Liquid immobilized membranes can permeate such distinct gases as 02 or NH3 very selectively by facilitated transport, but the membrane performance in these cases is still a matter of research.
12.4 GAS SEPARATION USING INORGANIC MEMBRANES
12.4.1 Types of Gas Separation In gas separation a number of regimes can be distinguished: 1. Separation of permanent gases at room temperature. Examples are O2/N2, H2/N2, H2/CO, H2/CH4 or He/CH4. The requirements for these separations are that selectivities and permeabilities be as high as possible. There are no special requirements for the thermal and chemical stability of membranes used in this type of separation except that the structure has to be stable at high pressures. 2. Separation of condensable gases at room temperature. Examples are C O 2 / C H 4 r C O / C O 2 1 H20/air,(C3 and C4)/(C1 and C2), removal of acid gases (HC1, H2S, SO2), ammonia or hydrocarbons/air. Chemical stability can play an important role in the choice of the material. Inorganic materials can better stand up to organic environments than can organic materials; the reverse is also true. 3. Separations of condensable gases at higher temperatures (up to 300~ This is the main field of fractional distillation, e.g., hydrocarbon separation. However, steam/hydrocarbon separation can also be important. Another possibility is water/alcohol separation, for instance, to break an azeotrope and water/solvent separation. 4. Separation of such permanent gases as H2 or 02 at higher temperatures up to about 1000~ The separation becomes more interesting if it is combined with a reaction. 5. A unique case is nonseparative gaseous diffusion and flow through inorganic membranes at higher temperatures for distinct types of reactions. For instance, air with a NOx impurity can be treated with ammonia in a membrane reactor. The contact between NOx and NH3 can be mediated and controlled by a means of a catalytically active membrane in such a way that in the exhaust gas, no NOx nor NH3 are present [57]. Even if the concentration of NOx or other types of impurities change with time, these impurities can be removed in a membrane reactor [58].
12 - - G A S SEPARATION USING INORGANIC MEMBRANES
577
The question is, in which cases can an inorganic membrane be applied for one of the five above mentioned gas separation regimes. One should be careful to introduce inorganic membranes in an arbitrary way. Because of market inertness and also because of the typical properties of inorganic membranes, not all gas separation applications are obvious. 12.4.2 Separation of Permanent Gases at Room Temperature Separations of permanent gases like O2,CO2 or H2 at room temperature (regime 1) are not the strongest properties of inorganic membranes. Only in the development of molecular sieve carbon (MSC) membranes some remarkably high values in selectivities and permeabilities of oxygen/nitrogen separation at room temperature have been found compared with other types of membranes [50]. Other types of separation processes like cryogenic distillation or (pressure swing) adsorption are, however, more accepted and also applied in commercial separations. A very good control of the porous structure of silica can lead to a separation factor (x at room temperature for instance a CO2/CH4 separation of about 50 with 75 m 3 m -2 bar -1 day -1 [10]. This separation factor is comparable with those found in polysulfone membranes, although the permeability is greater in this case. Large surface areas of the microporous silica structure are not prepared yet and a careful control of the preparation procedure is an absolute necessity. Separation of permanent gases with ceramic membranes for use at room temperature is commercially problematic due to the existence of well-established efficient techiques. 12.4.3 Separation of Condensable Gases at Room Temperature The separation of condensable gases at room temperature can be of some value. By capillary condensation, a condensable gas can be separated from a less condensable gas or a permanent gas. There are two restrictions for selective separation; the non-condensable or permanent gas should not be soluble in the condensed liquid, and minor components can only be separated by capillary condensation in a limited number of cases. Uhlhorn [10] showed that hydrocarbon separation from permanent gases is possible with high selectivities but only in the capillary condensation regime. Water removal at room temperature and atmospheric pressure is also possible up to about 60% relative humidity (= 1.4 kPa; see Table 12.4) with mesoporous systems. With microporous systems lower values can be achieved under the condition that the membranes are not sensitive to water. Acid gases can also be removed with a mesoporous membrane but not as a minor component (< 1000 ppm). In the case of a minor component, a dense-type membrane is required (e.g., immobilized liquid) which is not yet on the market.
578
12--GASSEPARATIONUSINGINORGANICMEMBRANES
12.4.4 Separation of Condensable Gases at Temperatures between 100 and 300~ At elevated temperatures (up to 300~ capillary condensation for vapor separation has good potential. Asaeda and Du [48,49] and Sakohara et al. [59] have already shown that near 100~ water can be separated from alcohols and solvents with a high separation factor. This application has already been commercialized by NGK/Mitsubishi. An interesting option in this temperature region is that membrane separation processes replace a part of the fractional distillation, especially for heavy oil fractionation. Although some papers show applications of inorganic membranes in refining processes of petroleum residues [60], not much research has yet started in hydrocarbon separation. It should, however, be interesting to carry out membrane distillation with some of the membrane structures already obtained. The structural resistance of inorganic membranes in organic liquids and vapors is excellent. 12.4.5 Separation of 1-12or 02 at Temperatures Above 250~ At present, most applications of inorganic membranes point to separation of H2 from gas mixtures in the temperature regime of 250-700~ ([34,61-73] and others). The reason for this type of separation is quite obvious. Saturated hydrocarbons are of less value than unsaturated ones, so reactions such as: Cn H2n+2 ~
Cn H2n + H2'~
(12.14)
are important in preparing unsaturated hydrocarbons. The first problem with these types of reactions is that the one-step conversion of this reaction is small (thermodynamically determined), because two molecules are formed from one molecule. High temperatures and low pressures are needed to obtain some conversion with the disadvantage of carbon formation. The second problem is the separation of H2 with a cryogenic technique (distillation) by cooling to -100~ Both problems make the already developed processes technically and economically unattractive [73]. The second problem can be solved by using an inorganic membrane separator instead of cryogenic distillation (Fig. 12.11). The separation can be carried out at the same temperature as the reaction. Most authors mentioned are using mesoporous membranes (A1203 or Vycor glass) with only a limited selectivity according to Knudsen diffusion (Eq. 12.4). Real separation problems, then, are not solved but the conversion per cycle of the reaction is higher also because of high permeability of the porous membrane. As really selective membranes dense-stabilized, Pd (Pd/Ag) or silica-composite membranes can be used as
12 - - G A S S E P A R A T I O N U S I N G I N O R G A N I C M E M B R A N E S
579
reactor and membrane separator in series permeate feed
r e a c t o 9r 9 J 1 s e p a r a! t o r 9149 J catalyst
9 9 9 9 9 9 9 e t
example: Csli e . C3H6 99 Is catalyst is reactor wall is m e m b r a n e
+
i product$ Jretenta~e
Hz
Pig. 12.11. Schematic representation of a reactor and m e m b r a n e separator for the dehydrogenation of hydrocarb~.~s (or alcohols) in series.
reaction and separation in one reactor I ,
feed
example:
!
'
~membraHe J
....
permeate
reactor + products separator . ~ 9 e e e e t, retentate . . . . catalyst C6H12
=
C6H 6 +
3 H2
e 9 1 4 9 1 is 4 9 catalyst is reactor wall is m e m b r a n e
Fig. 12.12. Schematicrepresentation of a single membrane reactor for the dyhrogenation of hydrocarbons (or alcohols) and the separation of H2. both have separation factors over 200. However, it makes more sense to incorporate the catalyst in the membrane reactor itself (Fig. 12.12). H2 formed at the catalyst can then be immediately removed from the reaction side. This can drive the reaction, shown in Eq. 12.14 to completion even at a lower temperature and a higher pressure. The flow conditions in the reactor have to be optimized, however, to remove hydrogen as fast as possible, and the permeability of the membrane for hydrogen should be at least as large as the hydrogen formation. Perhaps a better option is to bring the catalyst on top of the membrane itself. Then the problem arises that the amount of catalyst is limited. The shape and flow properties of the membrane reactor thus become of main importance and the surface area-to-volume ratio of the membrane reactor should be as high as possible. Fukuda et al. [74] and Kameyama et al. [75-77] tried to use membranes in reactors for the decomposition of H2S to H2 and $2 for increasing the conversion. The used membranes ( A I 2 0 3 and Vycor glass) had, again, a limited selectivity and were not stable (Vycor glass) at temperatures of 800~ so conversion improvement was limited.
580
12 ~ GAS SEPARATION USING I N O R G A N I C MEMBRANES
Until now a combination of dehydrogenation reactions and a highly selective membrane is rarely demonstrated. The main exception is represented by the papers of Gryaznov and coworkers [78,79]. They used (stabilized) Pd membranes with a very high H2-selectivity for a combination of hydrogenation and dehydrogenation reactions of complex hydrocarbons. The Pd film itself is also the catalyst. On one side of the membrane a dehydrogenation reaction is carried out, the hydrogen diffuses through the Pd(Ag) membrane and, on the other side, the hydrogen is used for a hydrogenation reaction. Because of the low permeability of Pd(Ag) only small-scale reactions seem suitable to use in such a reactor. The problem of heat control is solved, however, in such a reactor because of the coupling of endothermic and exothermic reactions and a large heat transfer over the membrane. Another type of selective membrane applications in a high temperature reactor is the use of solid electrolyte chemical cells. In Section 12.3.4c permeability properties of solid electrolytes are shown. The oxygen p u m p e d through the membrane (as oxygen ions) can be used in the partial (selective) oxidation of alkanes/alkenes or for other reactions like methane coupling, steam reforming reactions and SO2 oxidation. The oxygen transport can either be pressure driven in which case a catalyst is needed, or can be driven by an electrical potential where the (metal) electrodes can act as a catalyst. In both cases oxygen ions are transported which can be a very active process in distinct selective oxidation reactions. A review on this type of reactions, which occur in the temperature region of 500-1100~ is given by Gellings et al. [80].
12.4.6 Nonseparative Applications in High-Temperature Membrane Reactors A previous type of membrane reactor is applied to avoid nonselective total oxidation in the gas phase in a mixture O2/feed. It is not necessary to use a highly selective membrane for avoiding nonselective gas phase reactions. A mesoporous or even a macroporous membrane can also be applied. The component, which has to be partially oxidized (or oxidative dehydrogenated or otherwise), is supplied from one side of the membrane and oxygen from the other side as shown before. The catalyst is a part of the membrane system (catalytically active membrane) either on top of the membrane or inside the membrane. The amount of catalyst surface area in a 'heat-exchanger' type of module is about 8000 m 2 considering a module of a 10 cm diameter and 1 m length with about 200 membrane tubes and a membrane top layer thickness of 10 ~tm. The total outer membrane area in this module is 2 m 2. A precise dosage of oxygen is necessary at the actual site of the reaction on the surface of the catalyst. This dosage depends on the process parameters applied in relation with the ceramic structure of the membrane/catalyst. Fleming [61] already suggested using these types of membranes in a reactor and
12 --GAS SEPARATIONUSING INORGANICMEMBRANES
581
recently, a number of papers were published on this subject. Omata et al. [81] used this concept for the oxidative coupling of methane. They provide an alumina tube (50 nm pores) with a P b O / M g O catalyst on top. Zaspalis et al. [57,82-86] and Keizer et al. [87] used the concept of a catalytically active membrane for the oxidative dehydrogenation of methanol to formaldehyde (Ag-catalyst in the membrane). This concept can also be applied for other types of reactions like the Claus reaction [58] or the denox reaction using ammonia [57]. In the Claus process the following reaction takes place: 3 2H2S + SO2 ---)~ $8 + 2H20
(12.15)
The catalyst for this reaction is ~-A1203, which is impregnated in the (z-A1203 membrane. At the end of the reactor neither H2S nor SO2 should be present and $8 should be present on only one side of the membrane. All these requirements can be realized with this reaction in a reactor with a membrane (+ catalyst) having a pore diameter not larger than 1000 nm. Boundary conditions are that the reaction is fast (as is the Claus reaction) and the feed concentrations are not too high (< 5%). For the denox reactions the same conditions hold, as shown by Zaspalis [57,88]. The catalyst used for this reaction is V2Os/TiO2. The membrane consists of a TiO2 top layer modified with a monolayer of V205 (about 5-10 ~tm thick with 6 nm pores) on an alumina support. The membrane top layer, therefore, acts as the catalyst.
12.5 CONCLUSIONS AND EVALUATION Gas separation using inorganic membranes is not an established field. At present no large-scale applications are realized, except perhaps for the application of dense metals in the separation of hydrogen at high temperatures [89]. With extended effort in research and development it can, however, become of major importance in the membrane technology. Inorganic membranes can be prepared from all types of materials (metal, glass, ceramic, etc.) and with all Finds of structures. For highly selective gas separation, porous membranes with pores larger than 2 nm are not very suitable. Only the capillary condensation mechanism can achieve selective separations for vapors, in a distinct pressure/temperature regime. Microporous (pore diameter < 2nm) and dense inorganic membranes can be highly selective, but application near room temperature is limited because of low permeability. The situation changes drastically if higher temperatures are taken into account. At temperatures of 100-300~ vapor separation is possible. Interesting
582
12 - - GAS SEPARATION USING INORGANIC MEMBRANES
examples are water/alcohol or solvent separations with water as the faster-permeating component and probably hydrocarbon mixtures with sufficiently molecular different weight. The last example has not been proven yet. It is also shown that permanent gas separation with microporous silica-based membranes is straight forward with H2, He and CO2 as fast-permeating components and hydrocarbons, N2 and 02 as slow-permeating gases. Carbon membranes are also selective for H2 separation from hydrocarbons. At temperatures higher than 300~ dense membranes (metal sheets, immobilized inorganic liquids, dense glass films and oxygen ion conductors, etc.) can start to play a role in separation with almost infinite selectivity but limited permeability. Permeability improvements seem to be possible. The separation potential of silica-based composite membranes is also very good in this region. The structure is stable up to at least 700~ The water sensitivity still has to be improved. The attention of using inorganic membranes at high temperatures is not, however, directed only to separation but also to high-temperature membrane reactors in which reaction and separation are combined. By selective separation of H2, a dehydrogenation reaction of hydrocarbons for example can be driven to completion instead of the very limited (thermodynamically determined) conversion in a conventional reactor. It is also possible to change the reactor path of typical reactions so that nonselective gas phase reactions are avoided or new products are formed. For this application low-selective, porous membranes can be used, which are modified with catalytically active phases. This whole consideration of commercial inorganic membrane applications becomes unsettled if high-temperature modules are not developed in time. The connections and sealings between membrane and housing are completely different from those applied in low-temperature (organic) membrane modules. A second problem that has to be solved is the difference in the expansion coefficient between the membrane and housing, which can generate stresses of several 100 MPas (thousands of bars) and, of course, causes cracks. A number of companies recognize the problems but only a limited number of (small) companies are actually trying to solve them. In 1991-1992 some (small) high temperature membrane modules were introduced on the market (Velterop BV), which are now tested in practical processes. However, the membrane material development is at present two to four years ahead of the high temperature module development. Therefore, more effort must be put towards the development of high-temperature modules to give inorganic membranes a real chance in high-temperature gas separations and membrane reactor applications.
12 -- G A S S E P A R A T I O N U S I N G I N O R G A N I C M E M B R A N E S
583
LIST OF SYMBOLS outer surface area of membrane (m 2) surface area occupied by one adsorbed molecule (m 2) pore diameter (m) surface diffusion coefficient (m 2 s-1) Ds total permeability (mol m -2 s -1 Pa -1) Fo permeability by Knudsen diffusion (mol m -2 s-1 Pa 1961) FoK permeability by surface diffusion (mol m -2 S-1 pa-1) FoS surface transport (kg m -3) Fs MA,MB mass of a diffusing molecule A or B, respectively (kg) NAy Avogadro's number (= 6.022x10²³) P mean pressure (Pa) Pr pressure ratio across the membrane (-) AP pressure difference across the membrane (Pa) Pt capillary condensation pressure (Pa) Po saturated vapor pressure (Pa) dq/dl gradient in surface occupation (mol kg -1 rn-1) r modal pore radius (m) r' actual radius of cylindrical capillary (< r because of adsorbed gas (m) R Gas constant (J mo1-1 K-1) T absolute temperature (K) Vm molar volume of liquid component (m 3 mo1-1) v average molecular velocity (m s-1) Xs fractional occupation of the internal membrane surface in relation with a monolayer (-) x the mole fraction of the faster-permeating component in the feed (-) y the mole fraction of the faster-permeating component in the permeate (-) (x actual separation factor (-) ideal separation factor according to the inverse ratio of the square root of molecular masses Y interfacial tension (N m -1) s porosity (-) viscosity of a gas (N s -1 m -2) 11 0 contact (wetting) angle (-) shape factor for Knudsen diffusion ILk shape factor for laminar flow .p shape factor for surface diffusion ~s the apparent density of a membrane (kg m -3) P A Ao
584
12m GASSEPARATIONUSINGINORGANICMEMBRANES
REFERENCES
1 Present, R.D. and de Bethune, A.J. (1949). Phys. Review, 13: 1050. 2 Marcel, R. (1984). Summerschool on Membrane Science and Technology, Cadarache, France. 3 Haraya, K., Shindo, Y., Hakuta, T. and Yoshitome, H. (1986a). J. Chem. Soc. Jpn., 19:186. 4 Haraya, K., Obata, K., Hakuta, T. and Yoshitome, H. (1986b). J. Chem. Eng. Jpn., 19: 431. 5 Haraya, K., Shindo, Y., Hakuta, T. and Yoshitome, H. (1986c). J. Chem. Eng. Jpn., 19: 461. 6 Haraya, K., Hakuta, T., Yoshitome, H. and Kimara, S. (1987). Sep. Sci. Techn., 22:1425. 7 Shindo, Y., Obata, K., Hakuta, T., Yoshitome, H., Todo, N. and Kato, J. (1981). Adv. Hydr. Energy, 2: 325. 8 Shindo, Y., Hakuta, T., Yoshitome, H. and Inoue, H. (1983). J. Chem. Eng. Jpn., 16:120. 9 Shindo, Y., Hakuta, T., Yoshitome, H. and Inoue, H. (1984). J. Chem. Eng. Jpn., 17: 650. 10 Uhlhorn, R.J.R. (1990). Ceramic Membranes for Gas Separation, Synthesis and Transport Properties. Ph.D. Thesis, University Twente. 11 Sing, K.S.W. et al. (1985). Pure Appl. Chem., 57: 603. 12 Schnabel, R. and Vaulont, W. (1978). Desalination, 24: 249. 13 Smith, A.W. (1974). U.S. Patent 3,850,762, 5 pp. 14 Furneaux, R.C., Rigby, W.R. and Davidson, A.P. (1986). EPA 0178,831, 8 pp. 15 Terpstra, R.A., Bonekamp, B.C., van Veen, H.M., Engel, A.J.G., de Rooy, R. and Veringa, H.J. (1988a). Science of Ceramics, 14: 557. 16 Terpstra, R.A., Bonekamp, B.C. and Veringa, H.J. (1988b). Desalination, 70: 395. 17 Veyre, R. (1985). Ann. Chim. Fr., 1985: 359. 18 Leenaars, A.F.M. and Burggraaf, A.J. (1985a). J. Coll. Interface Sci., 105: 27. 19 Cot, L., Guizard, Ch. and Larbot, A. (1988). Industrial Ceramics, 8:143. 20 Anderson, M.A., Gieselman, M.J. and Xu, Q.Z. (1988). J. Membr. Sci., 39: 243. 21 van Praag, W., Zaspalis, V.T., Keizer, K., Ommen, J.G.van, Ross, J.R.H. and Burggraaf, A.J. (1989). Proceedings ICIM'89, Montpellier, France. pp. 397-401. 22 Cacciola, A. and Leung, P.S. (1981). EPE 040,282, 20 pp. 23 Larbot, A., Fabre, J.-P., Guizard, C. and Cot, L. (1989a). J. Am. Ceram. Soc., 72: 257. 24 Larbot, A., Julbe, A., Guizard, C. and Cot, L. (1989b). J. Membr. Sc/., 44: 289. 25 Burggraaf, A.J. and Keizer, K. (1990a). Concise Encyclopedia of Advanced Ceramic Materials, (R.W. Cahn, editor), Pergamon press, Oxford, p 769-74. 26 Burggraaf, A.J., Keizer, K. and Uhlhorn, R.J.R. (1990b). EPA 90201069.3. 27 Uhlhom, R.J.R., Zaspalis, V.T., Keizer, K. and Burggraaf, A.J. (1992b). J. Mater. Sd., 27: 538. 28 Uhlhorn, R.J.R., Huis in't Veld, M.B.J.H., Keizer, K. and Burggraaf, A.J. (1989a). J. Mater. Sci. Lett., 8: 1135. 29 Uhlhorn, R.J.R., Huis in't Veld, M.B.J.H., Keizer, K. and Burggraaf, A.J. (1989b). Proceedings of FICIM'89, Montpellier, France. pp. 323-28. 30 Uhlhorn, R.J.R., Keizer, K. and Burggraaf, A.J. (1989c). J. Membr. Sci., 46: 225. 31 Uhlhorn, R.J.R., Keizer, K. and Burggraaf, A.J. (1989d). In: Advances in Reverse Osmosis and Ultrafiltration (T. Matsuura and S. Sourirajan, Eds.). pp. 239-59. 32 Uhlhorn, R.J.R., Keizer, K. and Burggraaf, A.J. (1992d). J. Membr. Sci., 66: 271. 33 Huis in't Veld, M.B.J.H., Uhlhorn, R.J.R., Keizer, K. and Burggraaf, A.J. (1989). Proceedings FICIM'89, Montpellier, France. pp. 383-7. 34 Gavalas, G.R., Megiris, C.E. and Nam, S.W. (1989). Chem. Eng., 44: 1829. 35 Megiris, C.E., Nam, C.W. and Gavalas, G.R. (1989). Proceedings ICIM'89, Montpellier, France, pp. 355-61.
12-- GASSEPARATIONUSINGINORGANICMEMBRANES
585
36 Okubo, T. and Inoue, H. (1989a). J. Membr. Sci., 42: 109. 37 Okubo, T. and Inoue, H. (1989b). AIChE J., 35: 845. 38 van Vuren, R.J., Bonekamp, B.C., Keizer, K., Uhlhorn, R.J.R., Veringa, H.J. and Burggraaf, A.J. (1987). Mater. Sci. Monogr., 38c: 2235. 39 Keizer, K. and Burggraaf, A.J. (1988a). Science of Ceramics, 14: 83. 40 Keizer, K., Uhlhom, R.J.R.,Vuren, R.J.van, and Burggraaf, A.J. (1988b). J. Membr. Sc/., 39: 285. 41 Mason, F.A., Malinauskas, A.P. and Evans, R.B. (1967). J. Chem. Physics, 46: 3199. 42 Tamon, H., Kyotani, S., Wada, N., Okazaki, M. and Toei, R..(1981a). J. Chem. Eng. Jpn., 14:136. 43 Tamon, H., Okazaki, M. and Toei, R. (1981b). AIChE J., 27: 271. 44 Tamon, H., Okazaki, M. and Toei, R. (1985). AIChE J., 31:1226. 45 Lee, K.H. and Hwang, S.T. (1986a). J. Coll. Interface Sci., 110: 544. 46 Uhlhorn, R.J.R., Keizer, K. and Burggraaf, A.J. (1992c). J. Membr. Sc/., 66: 259. 47 Barrer, R.M. (1965). A.I.Ch.E. Symp.Series, 1:112. 48 Asaeda, M. and Du, L.D. (1986a). J. Chem. Eng. Jpn., 19: 72. 49 Asaeda, M., Du, L.D. and Fuji, M. (1986b). J. Chem. Eng. Jpn., 19: 84. 50 Koresh, J.E. and Softer, A. (1983). Sep. Sci. Techn., 18: 723. 51 Koresh, J.E. and Softer, A. (1986). Chem. Soc. Faraday Trans. I, 82: 2057. 52 Pez, G., and Carlin, R.T. (1986a). EPA 0194,493, 34 pp. 53 Pez, G., and Caflin, R.T. (1986b). U.S. patent 4,617,029, 8 pp. 54 Ilias, S., and Govind, R. (1989). AIChE Symp. Series, 268: 18. 55 Bouwmeester, H.J.M., Kruidhof, H., Burggraaf, A.J. and Gellings, P.J. (1992). Solid State Ionics, 53--56: 460. 56 Teraoka, Y., Zhang, H., Furukawa, S. and Yamazoe, N. (1985). Chem. Lett., 1985: 1743. 57 Zaspalis, V.T. (1990). Catalytically Active Membranes: Synthesis, Properties and Reactor Applications, Ph.D Thesis, University Twente. 58 Swaay, W.P.M., Sloot, H.J. and Kreulen, H. (1989). Proceedings Summerschool on New Membrane Processes, Enschede, Netherlands. 59 Sakohara, S., Kitao, S., Ishizaki, M. and Asaeda, M. (1989). Proceedings ICIM'89, Montpellier, France. pp 231-6. 60 Deschamps, A., Walther, C., Bergez, P., and Charpin, J. (1989). Proceedings of FICIM'89, Montpellier, France. pp 237-42. 61 Fleming, H.L. (1987). 1987 BCC Membrane Planning Conference, Cambridge, Mass. 62 Hsieh, H.P. (1989). AIChE Symp. Series, 268: 53. 63 Itoh, N., Shindo, Y., Hakta, T. and Yoshitome, H. (1984). Int. J. Hydrogen Energy, 9: 835. 64 Itoh, N., Shindo, Y., Haraya, K., Obata, K., Hakuta, T. and Yoshitome, H. (1985). Int. Chem. Eng., 25: 138. 65 Itoh, N. (1987). AIChE J., 33:1576. 66 Itoh, N. and Govind, R. (1989). AIChE Syrup. Series, 268: 10. 67 Mohan, K. and Govind, R. (1986). AIChE J., 32: 2083. 68 Mohan, K. and Govind, R. (1988a). Sep. Sci. Techn., 23: 1715. 69 Mohan, K. and Govind, R. (1988b). AIChE J., 34:1493. 70 Nam. S.W. and Gavalas, G.R. (1989). AIChE Symp. Series, 268: 68. 71 Shinji, O., Misono, M. and Yoneda,'Y. (1982). Bull. Chem. Soc. Jpn., 55: 2760. 72 Sun, Y.M. and Khang, S.J. (1988). Ind. Eng. Chem. Res., 27: 1136. 73 Bitter, J.G.A. (1986). Brit. Patent Appl. 8629135,15 pp. 74 Fukuda, K., Dokiya, M., Kameyama, T. and Kotera, Y. (1978). Ind. Eng. Chem. Fundam., 17: 243.
586
12-- GASSEPARATIONUSINGINORGANICMEMBRANES
75 Kameyama, T., Dokiya, M., Fukuda, K. and Kotera, Y. (1979). Sep. Sci. Techn., 14: 953. 76 Kameyama, T., Fukuda, K., Fushisige, M., Yokokawa, H. and Dokiya, M. (1980). Proceedings 3rd World Hydrogen Energy Conference, Tokyo, Japan. pp. 2.325-2.333. 77 Kameyama, T., Dokiya, M., Fujishige, M., Yokokawa, H. and FLrkuda, K. (1981). I&EC Fundam., 20: 97. 78 Gryaznov, V.M. and Smirnov, V.S. (1977). Kin. Cat., 3: 579. 79 Gryaznov, V.M. (1986). Z. Phys. Chemie, 147: 123. 80 Gellings, P.J., Koopmans, H.J.A. and Burggraaf, A.J. (1988). Appl. Catal., 39: 1. 81 Omata, K., Hashimoto, S., Tominaga, H. and Fujimoto, K. (1989). Appl. Catal., 52: L1. 82 Zaspalis, V.T., Keizer, K., van Ommen, J.G., van Praag, W., Ross, J.R.H. and Burggraaf, A.J. (1989a). AIChE Syrup. Series, reprint (unpublished). 83 Zaspalis, V.T., Keizer, K., van Ommen, J.G., van Praag, W., Ross, J.R.H. and Burggraaf, A.J. (1989b). Brit. Ceram. Soc. Proc., 43: 103. 84 Zaspalis, V.T., Keizer, K., van Ommen, J.G., van Praag, W., Ross, J.R.H. and Burggraaf, A.J. (1989c). Proceedings FICIM'89, MontpeUier, France. pp. 367-72. 85 Zaspalis, V.T., van Praag, W., van Ommen, J.G., Ross, J.R.H. and Burggraaf, A.J. (1991a). Appl. Catal., 74: 205. 86 Zaspalis, V.T., van Praag, W., van Ommen, J.G., Ross, J.R.H. and Burggraaf, A.J. (1991b). Appl. Catal., 74: 235. 87 Keizer, K., Zaspalis, V.T. and Burggraaf, A.J., (1990). Proceedings CIMTEC'90, Montecatini
Terme, Italy. 88 Zaspalis, V.T., van Praag, W., van Ommen, J.G., Ross, J.R.H. and Burggraaf, A.J. (1991c). Appl. Catal., 74: 249. 89 Kammermeyer, K. (1976). Chem. Ing. Techn., 48: 672. 90 Hsieh, H.P. (1988). AIChE Syrup. Series, 261: 1. 91 Hsieh, H.P., Bhave, R.R. and Fleming, H.L. (1988). J. Membr. Sci., 39: 221. 92 Lin, Y.S., Vries, K.J. de, Brinkman, H.W. and Burggraaf, A.J. (1992), J. Membr. Sc/, 66: 211. 93 Smith, B.D. and Srivastava, R. (1986), Thermodynamic Data for Pure Compounds. Elsevier, Amsterdam. 94 Landolt-B6rnstein (1960), Zahlenwerte und Funktionen aus Physiek, Chemie, Astronomie, Geophysik und Technik. 2. Teil, Bandteil 2a, Gleichgewichte Dampf-Condensat und Osmotische Ph~inomene. Springer-Verlag. Berlin. BIBLIOGRAPHY
Abe, F. (1987). EPA 0228885, 22 pp. Aimar, P., Taddei, C., Lafaille, J.P. and Sanchez, V.(1988). J. Membr. Sci., 38: 203. Anderson, M.A., Gieselman, M.J., Xu,Q., Moosemiller, M., Knaebe, M. and Bischoff, B. (1987). DOE/ID/12626-T1, DE 87 012714:60 pp. Armor, J.N. (1989). Appl. Catal., 49: 1. Asaeda, M., Watanabe, J., Matono, Y., Kojima, K., and Toei, R. (1981). J. Chem. Eng. Jpn., 14: 13. Ash, R., Barrer, R.M., and Foley, T. (1976). J. Membr. Sci., 1: 355. Ash, R., Barrer, R.M., and Sharma, P. (1976). J. Membr. Sci., 1:17. Baker, R.W., and Blume, I. (1986). Chemtech, April: 232 Bakiewicz, J.L., Keizer, K., and Burggraaf, A.J. (1989). Euroceramics (G. de Wit, R.A. Terpstra, R. Metselaar, eds.), Elsevier Applied Science, London, pp.3-610.
12-- GASSEPARATIONUSINGINORGANICMEMBRANES
587
Bein, T., Brown, K., Enzel, P., and Brinker, C.F. (1986). Better Ceramics through Chemistry III (C.J.Brinker, D.E.Clark, D.R.Ulrich, eds.), p.425. Bein, T., Brown, K., and Brinker, C.J. (1989). Zeolites: Facts, Figure, Future (Jacobs, P.A., van Santen, R.A., eds.), Elsevier Science Pub., Amsterdam, p. 887. Bonekamp, B.C., Terpstra, R.A., and Veringa, H.J. (1989). Euroceramics 1 (de Wit, G., Terpstra, R.A., and Metselaar, R,. eds.), Elsevier Applied Science, London, p. 218. Brautigam, U., Burger, H., and Vogel, W. (1989). J. Non-Cryst. Solids, 110: 163. Brinker, C.J., Hurd, A.J., Frye, G.C., Ward, K.J., and Ashley, C.S. (1991) J. Non-Cryst.Solids, 112:253 Burggraaf, A.J., and Keizer, K. (1989) Proceedings of ICIM '89, Montpellier, France, pp.31122. Burggraaf, A.J., Keizer, K., and Hassel, B.A. van (1989). Solid State Ionics, 32/33: 771. Callahan, R.W. (1988). AIChE Syrup. Series, 261:54 Charpin, J., Bergez, P., Valin, F., Barnier, H., Maurel, A., and Martinet, J.M. (1988). Industrial Ceramics, 8: 23. Dellefield, R.J. (1990) AIChE Symp.Series, preprint (not published) Freilich, D., and Tanny, G.B. (1978). J. Colloid Interface Sci., 64: 362. Gallagher, D., and Klein, L.C. (1986). J. Colloid Interface Sci., 109: 40. Gieselman, M.J., Moosemiller, M.D., Anderson, M.A., and Hill. C.G. (1988). Sep. Sci. Techn., 23: 1695. Gieselman, M.J., and Anderson, M.A. (1989). J. Am.Ceram. Soc., 72: 980. Gilliland, E.R., Baddour, R.F., Perkinson, G.P., and Sladek, K.J. (1974). Ind. Eng. Chem.Fundam., 13: 95. Gilliland, E.R., Baddour, R.F., Whang, H.Y., and Sladek, K.J. (1972). J. Electroanal.Chem Inteff. Electrochem., 37:361 Guizard, C., Legault, F., Idrissi, N., Larbot, A., Cot, L., and Gavach, C. (1989). J. Membr. Sci., 41: 127. Haggin, J. (1989). C&EN, July: 198. Harold, M.P., Cini, P., Patenaude, B., and Venkataraman, P. (1989). AIChE Symp.Series, 268: 26. Hennepe, H.J.C.ten, Bargeman, D., Mulder, M.H.V., and Smolders, C.A. (1987). J. Membr. Sc/., 35: 39. Higashi, K., Ito, H., and Oishi, J. (1964). J. Nuclear Sci. Techn., 1:298 Hwang, S.T. (1976). Sep.Sci. Techn., 11:17 Itaya, K., Sugawara, S., Arai, K., and Saito, S. (1984). J. Chem. Eng. Jpn., 17: 514. Kaiser, A., and Schmidt, H. (1984). J. Non-Cryst. Solids, 63: 261. Kammermeyer, K. (1968) in: Progress in Separation and Purification 1, New York Inet, pp.335-72. Klein, L.C., and Gallgher, D. (1988). J. Membr. Sci., 39: 213. Klemetson, S.L., and Scharbow, M.D. (1978). Prog. Water Technol., 10: 193. Konno, M., Shindo, M., Suguwara, S., and Saito, S. (1988). J. Membr. Sc/., 37:193. Larbot, A., Mary, J.A., Fabre, J.P., Guizard, C., and Cot, L. (1986). Mat. Res. Soc. Syrup. Series, 73: 659. Larbot, A., Alary, J.A., Guizard, C., and Cot, L. (1987a). Int. J. High Techn. Ceramics, 3: 143. Larbot, A., Alary, J.A., Guizard, C., Fabre, J.-P., Idrissi, N., and Cot, L. (1987b). Mat. Sci. Monogr., 38c: 2259. Larbot, A., Fabre, J.-P., Guizard, C., and Cot, L. (1988). J. Membr. Sci., 39: 203. Lee, E.K. (1987). Encycl. Phys.Science, 8: 20.
588
12-- GASSEPARATIONUSINGINORGANICMEMBRANES
Lee, K.H., and Khang, S.T. (1986). Chem. Eng. Comm., 44: 121. Leenaars, A.F.M., Keizer, K., and Burggraaf, A.J. (1984). J. Mat. Sci., 19:1077. Leenaars, A.F.M., and Burggraaf, A.J. (1985b). J. Membr. Sci., 24: 245. Leenaars, A.F.M., and Burggraaf, A.J. (1985c). J. Membr. Sci., 24: 261. Leenaars, A.F.M.,Keizer, K. and Burggraaf, A.J. (1986). Chemtech, Sept.: 560. Li, D., Seok, D .R., and Hwang, S.T. (1988). J. Membr. Sci., 37: 267. Loeb, S., and Sourirajan, S. (1962). Adv. Chem. Ser., 38:117. Mohnot, S., and Cussler, E.L. (1984). Chem.Eng. Sci., 39: 569. Niwa, M., Ohya, H., Tanaka, Y., Yoshikawa, N., Matsumoto, K., and Negishe, Y. (1988). J. Membr. Sci., 39: 301. Noble, R.D. (1987). Sep. Sci. Techn., 22: 731. Okazaki, M., Tamon, H., and Toei, R. (1978). J. Chem. Eng. Jpn., 11: 209. Okazaki, M., Tamon, H., and Toei, R. (1981) AIChE J., 27: 262. Ollis, D.F., Thompson, J.B., and Wolynic, E.T. (1972). AIChE J., 18: 457. Rowell, R.L., Carrano, S.A., deBethune, A.J., and Malinauskas, A.P. (1971). J. Colloid Interface Sci., 37: 242. Schmidt, H. (1984). Mat.Res.Symp.Proc., 32: 327. Sladek, K.J., Gilliland, E.R., and Baddour, R.F. (1974). Ind. Eng. Chem. Fundam., 13:100. Suzuki, H. (1986). EPA 0,180,200, 27 pp. Suzuki, H. (1987). U.S. Patent 4,699,892,10 pp. Suzuki, K., Kiyozumi, Y., Sekine, T., Obata, K., Shindo, Y., and Shin, S. (1989). Zeolites: Facts, Figures, Future (Jacobs, P.A., van Santen, R.A., eds.], Elsevier Science Pub., Amsterdam, p. 65. Uhlhorn, R.J.R., Huis in't Veld, M.B.J.H., Keizer, K., and Burggraaf, A.J. (1988). Sci. Ceramics, 14: 551. Uhlhorn, R.J.R., Huis in't Veld, M.H.B.J., Keizer, K. and Burggraaf, A.J. (1992a). J. Mat. Sc/., 27:527 Veen, H.M., Terpstra, R.A., Tol, J.P.B.M., and Veringa, H.J. (1989). Proceedings of FICIM'89, Montpellier, France, pp. 329-35. Vinek, H. (1980). Z. Phys. Chem. Neue Folge, 120: 119. Way, J.D., Noble, R.D., Flynn, T.M., and Sloan, E.D. (1982). J. Membr. Sci., 12: 239. Xu, Q., and Anderson, M.A. (1989). Mat. Res. Soc. Syrup. Series, 132: 41. Yoldas, B.E. (1975). Ceram.Bull., 54: 289. Zeltner, W.A., and Anderson, M.A. (1989). Proc.FICIM'89, Montpellier, France, pp. 213-24.
Membrane Separations Technology. Principles and Applications Edited by R.D. Noble and S.A. Stern 9 1995, Elsevier Science B.V. All rights reserved
Chapter 13
Economics of gas separation membrane processes Robert Spillman Amicon, Inc., Beverly, MA, USA
13.1 INTRODUCTION Gas separation via membranes is one of the most exciting and significant new unit processes to have appeared in many years. The first commercially significant gas separation membranes were introduced o~ly in late 1979 but within a span of ten years this technology found its way into a wide range of industries and applications. The future promises to be equally exciting as new membrane materials, processes and innovations make their way to the marketplace. A gas separation membrane separates gas species (gas/gas separation) and is distinctly different from gas filtration (gas/solid separation). A gas separation membrane preferentially removes one or more components of a gas mixture that is passed across a membrane surface. The fact that no mechanical or chemical processes are involved makes the membrane process simple and easy to operate. The simplicity of the gas separation membrane process gives it special appeal when one considers the complexity of competing processes. Gas separation membranes, however, do not offer a separation solution that is particularly unique over the more traditional gas separation processes. Gas separation membrane processes compete with cryogenics and a wide variety of chemical and physical adsorption and absorption processes (e.g., amine absorption, pressure swing adsorption, carbon bed adsorption, etc.). In the case of air separation, membranes compete with the on-site production or delivery of oxygen and nitrogen liquids or gases. Since alternative processes achieve the
590
13 - - ECONOMICS OF GAS SEPARATION MEMBRANE PROCESSES
same separation, membranes must compete on the basis of overall economics, convenience and safety. It is traditionally very difficult for new technologies to displace the old and in the case of gas separation membranes the challenges are immense. Most of the conventional gas separation processes have been used for decades and all have undergone continual improvements in design and energy efficiency. Introduction was further impeded by the fact that the initial membrane applications were in the oil, gas and petrochemical industries where process innovations come at a slower rate due to the size and costs of the gas streams involved. Even more importantly, timing of the market development unfortunately coincided with the depression of the oil and gas industries in the 1980s. In spite of the market and technical obstacles, gas separation membrane processes have penetrated a wide variety of markets and applications. penetration is due to the inherent advantages of these membranes in many applications; low capital investment, ease of operation, low energy consumption, safety and good weight and space efficiency. Gas separation membranes do have practical and theoretical limitations, however, and there exists considerable confusion and disagreement about the preferential use of membranes over alternative processes. This confusion is aggravated by the fact that membrane technology is not well understood by many of the potential benefactors of this new process. Engineering courses have only recently begun to include gas separation membranes in their curriculum but even so, the information base and mathematical tools required to properly assess their performance are not readily available. As a result, potential users of membrane technology must rely on vendors for assistance. This can sometimes inhibit creative application of the technology. The purpose of this contribution is to provide some perspective as to where gas separation membranes offer significant potential and where there still remain considerable obstacles. This author feels that this is best accomplished by focusing on the key considerations in membrane process design followed by economic illustrations of how membranes compare with competing processes. This is a risky undertaking since economic comparisons of processes are highly site-specific and are never easily extended to other cases. This difficulty is greatly compounded due to the fact that membrane technology is rapidly changing in terms of membrane performance and in terms of vendor pricing. Current membrane technologies offer a price/performance ratio that is an order of magnitude better than some of the earlier systems that were first introduced. Membrane innovation will continue, albeit at a slower rate, and economic comparisons made today may not be valid in the near future. Throughout this chapter the terms "gas separation membrane" and "membrane" are used interchangeably, unless noted.
13-- ECONOMICSOFGASSEPARATIONMEMBRANEPROCESSES
591
13.2 APPLICATIONS AND TECHNOLOGY BACKGROUND
13.3.1 Commercial Applications and Suppliers Although a variety of companies had offered gas separation membranes on a limited scale as early as 1968, these earlier membrane systems were not widely accepted as viable gas separation processes. A variety of technical and market entry barriers combined to make commercial success an expensive and difficult reality. Only after Monsanto introduced their Prism membrane system in 1979 did gas separation membranes really take hold. Since that time gas separation membranes have slowly but steadily penetrated a wide range of applications. Table 13.1 provides an overview of the major commercial application areas for gas separation membrane processes along with some of the major suppliers. Many new applications are under development. Membrane gas separations have attracted the interest of many companies and there are now over twenty TABLE 13.1 Gas membrane applications and suppliers Common gas separations Application O2/N2
Nitrogen generation, oxygen enrichment
H20/Air H2/Hydrocarbons
Air dehumidification Refinery hydrogen recovery
H2/CO
Syngas ratio adjustment Ammonia purge gas Acid gas treating, landfill gas upgrading
H2/N2 CO2/Hydrocarbons
H20/Hydrocarbons H2S/Hydrocarbons He/Hydrocarbons He/N2 Hydrocarbons/Air
Natural gas dehydration Sour gas treating Helium separations Helium recovery Pollution control, hydrocarbon recovery
Suppliers Permea (Air Products), Linde (Union Carbide), A/G Technology, Generon (Dow Chemical/BOC), Asahi Glass, Osaka Gas, Oxygen Enrichment Co. Permea, Ube Industries, Perma Pure Permea, Grace Membrane Systems (W.R. Grace) As above As above Grace Membrane Systems, Cynara (Dow Chemical), Separex, (Hoechst Celanese), Permea As above As above
As above As above Membrane Technology and Research, Almninium Rheinfelden/GKSS, NKK
592
13 ~ ECONOMICS OF GAS SEPARATION MEMBRANE PROCESSES
suppliers. Many additional companies have initiated R&D efforts to develop their own systems. Although the current market for membrane-based gas separation is small relative to the level of developmental activity, many companies see a potentially large future market as new innovations are developed. 13.2.2 Gas Separation Membrane
Technology
Membrane technology for the separation of liquid/liquid and liquid/solid streams has been practiced in industry for many years (e.g., reverse osmosis, ultrafiltration and microfiltration). While gas separation membranes are a logical extension of these other membrane technologies, gas separation environments are quite unlike those seen in other applications. For example, pressures of 2000 psi and temperatures of 70~ are possible and which greatly exceed the conditions typically experienced in other membrane applications. These harsh conditions delayed the commercial introduction of gas separation membranes until advances in membrane technology gradually led to the development of membranes suitable for such difficult environments [1,2]. A summary of gas separation membrane technology and principles is provided for perspective. Cited references should be consulted for more in-depth treatment of the following subjects. 13.2.2.1 Membrane Classes
There are three basic types of membranes that can be used for gas separation. The vast majority of commercial membranes are based on technology termed "nonporous" membranes. These membranes contain no holes or pores in the conventional sense of the word as would typically be found in ultrafiltration or microfiltration membranes. Instead, they rely on the principle that gases dissolve in and diffuse through solid materials [3]. This principle is often observed in a negative sense, for example, with respect to the plasticization and swelling of gaskets and seals in certain gas environments. Gas separation membranes take advantage of this phenomenon and polymers are specifically chosen that are highly permeable to the gases of interest. A separation of two gases is possible due to the fact that gases exhibit differing rates of transport through the polymer. For example, oxygen will pass though a typical polymeric membrane two to seven times faster than nitrogen, depending on the membrane and the conditions of the separation. The ratio of the permeation rates of two gases defines the selectivity of the membrane for those gases. A second class of gas separation membranes is based on the use of a "porous" membrane in which the gases are literally separated on the basis of their molecular weight (Knudsen diffusion) or size (molecular sieving) by small pores through the membrane. This type of membrane is not yet generally
13 - - ECONOMICS OF GAS SEPARATION MEMBRANE PROCESSES
593
employed in commercial gas membrane applications due to fabrication, durability and cost issues. Additionally, Knudsen diffusion membranes provide only low separation factors. It might be noted, however, that the world's first and largest gas membrane separation plant, in fact, was based on Knudsen diffusion separation using inorganic porous membranes [4]. The Department of Energy operated the Oak Ridge Gaseous Diffusion Plant since the mid-40s using these membranes to enrich the 23SUisotope for national defense purposes. The original plant covered some 270 acres and was upgraded with new membranes in the late 70s/early 80s at a cost of $1.5 billion! Development of porous membranes for industrial gas separation is still underway with recent efforts centered on taking advantage of other separation mechanisms (e.g., molecular sieving) that provide significantly higher selectivities [5,6]. A third general class of gas separation membranes is often termed facilitated transport or immobilized liquid membranes [7]. These membranes operate on the principle that a carrier fluid in the membrane acts as the primary gas solubilization agent. The advantage is that gases have higher solubilities in liquids than in solids and the addition of "carrier species" can substantially increase the separation factors. The most common configuration for such membranes is to impregnate the carrier liquid into a microporous membrane. Another approach involves the use of solvent-swollen ion exchange membranes. An analysis of the benefits and problems of such membranes illustrates that they are most attractive for treating gas streams having low partial pressures of the permeating gas [8]. These membranes, however, have not yet achieved the stability and lifetime required for widespread use. These types of membranes have been evaluated for a number of applications, including paraffin/olefin separations and sulfur dioxide removal from flue gas. The earliest commercial membranes were based on polysulfone and cellulose acetate. These polymer types still predominate but have been joined by polyimides, polyamides, polycarbonates, polyetherimide and sulfonated polysulfone [9]. In general, membrane technology is moving away from the reverse osmosis technology from which it evolved. In addition to the move to new polymers, there has been developed a large amount of know-how developed with respect to module construction and gas pretreatment. Current gas separation membranes are formed as dense films, asymmetric membranes or as composites [10]. A major focus of membrane development is the elimination of "pinholes" or minor defects in the separating layer. Such defects can dramatically affect the apparent selectivity of a membrane due to the high mobility of gases and the high pressure differences that are usually employed in a separation. Compatibility of the membrane polymers with the gas stream environment is also a key technical requirement.
594
13 - - ECONOMICS OF GAS SEPARATION MEMBRANE PROCF_.SSES
13.2.2.2 Principles Membrane-based gas separation is a relatively straightforward process concept. A typical gas separation is schematically diagrammed in Fig. 13.1. Air is separated into its nitrogen and oxygen components by passing the feed air stream across a membrane surface. Membrane separation of gases is a concentration-driven process which, for gases, is directly related to the pressures of the feed and permeate streams. In this example, the air feed is compressed to provide the driving force for the separation. Th~ air stream is then passed across the membrane surface in a "cross-flow" arrangement (as opposed to "dead-end" as with particulate filters). The membrane is more permeable to oxygen than to nitrogen and thus the oxygen permeates through the membrane to the low-pressure permeate side. The remaining stream is enriched in nitrogen and exits as the high pressure "residue" stream. Although the diagram shows complete separation, membrane permeation, in fact, is a rate-controlled process and complete separation is not achieved. The degree of separation is defined by the selectivity of the membrane and by the conditions of the separation (pressure, temperature, flow rate, membrane area, etc.). Polymeric membranes are most often characterized by the "solution-diffusion" mechanism, which states that the transport of gas molecules through a solid polymer film is governed by the solubility and diffusivity of the gas in the polymer [3]. The product of these two factors determines the "permeance" of that gas through a certain material. Permeance is defined as the volume of gas permeating a unit area of membrane per unit time per unit pressure differential and normalized to a unit thickness. A common measurement unit is called the Barrer (1 Barrer = 10-1~cmZ-cm/cm2-sec-cmHg). The actual "permeability" of a membrane is the permeance of the membrane material divided by the effective
GAS MEMBRANE SEPARATION Air Separation
FEED
Nitrogen Oxygen High Pressure
MEMBRANE I .'.
-
"o'o..;'.-
I
"!
9,, " e 9 o" " 1" " I 9 9 9e eeo 9 i
- RESIDUE
Nitrogen High Pressure
- PERMEATE Low Pressure Oxygen
Fig. 13.1.Schematicof a membrane-based air separation process.
13 ~ ECONOMICS OF GAS SEPARATION MEMBRANE PROCESSES
595
thickness of the separation layer, which typically ranges from 0.1 to 5 microns. A wide variety of units are used to express permeability (cm3 cm -2 sec-1 cmHg -1, ft 3 ft-2 hr -1 100 psi -1, m 3 m -2 hi" -1 a t n ~ -1, e t c . ) . A second theory covers the "porous" class of membranes (e.g., glass or ceramic membranes). This model assumes that membranes contain physical pores (on the order of Angstroms) and that the separation is based on a combination of molecular sieving, Knudsen diffusion, surface diffusion and capillary condensation. Molecular sieving, as the name suggests, separates molecules by their effective size. This class of membranes generally exhibits rather low separation factors for most applications and is therefore not widely employed. Work continues in this area since high selectivities are possible under the right conditions of membrane fabrication [11]. It should be noted that controversy exists over whether, in fact, the porous model theory also applies to nonporous polymeric membranes [12,13]. The exact nature of the transport mechanism is relevant to membrane R&D but the permeability characteristic of either membrane type sufficiently describes the end performance of that membrane to allow meaningful performance comparisons without regard to mechanism.
13.2.2.3 Module Configurations The vast majority of commercial gas separation membranes are based on polymers that are formed as either fiat sheets or as hollow fibers and assembled into modules. A membrane module is defined here as a the smallest practical unit containing a set membrane area and any supporting structures. Individual membrane modules are assembled into pressure vessels to form the membrane unit or "stage" which includes the necessary piping and pretreatment equipment. Flat sheet membrane is manufactured in long rolls and then assembled into plate-and-frame or spiral wound configurations. Hollow fibers are small tubes that have outer diameters ranging from as little as 50 microns to over 500 microns. In many, but not all, cases the high-pressure feed gas is introduced to the outer shell of the fiber and the low pressure permeate travels through the bore. Hollow fibers provide higher packing densities than spirals but the small size of the internal bore (40 to 300 microns) can often present a problem when large quantifies of gas are permeating the membrane (high pressure drop down the fiber bore). In some low-pressure air separation membranes the high-pressure gas is passed through the fiber lumen and this eliminates the back-pressure problem. The limitation of this approach is the burst pressure of the membrane. The choice of either a spiral-wound or hollow fiber approach is not a decision that necessarily has to be made by the end user. It is more of a decision by the membrane manufacturer how best to package a particular membrane technology to be able to offer the most cost-effective process to the final customer. The
596
1 3 - ECONOMICS OF GAS SEPARATION MEMBRANE PROCESSES
user should evaluate first the overall performance and cost-effectiveness of the options. Both designs coexist in the market and one may be preferred over the other depending on the specific application.
13.3 PRINCIPLES OF MEMBRANE PROCESS DESIGN
This section presents some of the basic considerations of how the design of a membrane gas separation process affects the economics of that process. Very few publications currently exist that cover the design of such membrane processes. This void stems largely from the nature of the membrane unit separation and the need for sophisticated computer programs to model the system. The problem is further compounded by one of the inherent advantages of membranes - - their versatility. This versatility allows the design engineer to tailor a membrane process that is very specific to the application. This can only be accomplished, however, with computer programs not generally available at present. As membrane unit operations are included in process design packages some of these problems will be alleviated but not necessarily overcome. There are a number of not-so-obvious factors to be considered in membrane process design that greatly impact the economics of the process. A few of these factors will be illustrated in this section. Furthermore, it is nearly impossible to make broad generalizations about process design. What may be true for a membrane system from one supplier may not apply to one from another supplier.
13.3.1 Basic Performance Principles Based on a single-stage membrane, several generalizations can be made to highlight what's important in optimizing a membrane process. Membrane separation of gases is a concentration-driven process, which for gases is directly related to the partial pressures of the gas species. It is the pressure differential between the feed and permeate streams that has by far the greatest impact on a particular membrane's effective performance. This pressure differential will impact both the amount of membrane area required and the volume and composition of the residue and permeate streams. It is also important to note that the desired product stream may be either the residue or permeate stream (or both in some cases). In natural gas treating, for example, the high-pressure methane residue is the "product" gas. In hydrogen separations, on the other hand, the hydrogen "product" exits the process as the lower-pressure permeate stream. As will be demonstrated, this difference results in some quite different conclusions regarding process optimization. The following analyses are based on representative membrane performance data that have appeared in the literature.
13 -- ECONOMICSOF GAS SEPARATIONMEMBRANEPROCESSES
597
13.3.1.1 Product is the Residue Gas Stream
Relative membrane requirements and methane recovery are presented as a function of feed pressure, permeate pressure, feed gas purity and product purity in Figs. 13.2a-d for the case of a two-component feed stream (90% CH4/10% CO2). The product gas is 97% CH4 and is delivered as the high-pressure residue stream. Although the figures would change for different separation problems the trends would still be the same for cases wherein the product gas is the residue stream. Figure 13.2a illustrates the importance of pressure differential on both membrane area requirements and product recovery. It may be economically justified in some circumstances to add additional compression to the feed stream to
IMPACT OF FEED PRESSURE Residue Stream is Product Relative Membrane Area
1.00
a 0.80
Methane Recovery (%)
96%
\ ~m
0.80
Methane Recovery
\
92%
Reqmrem~
0.40
100%
9 0 % Methane to 9 7 %
\
88% 84%
0.20 0.00
i 200
0
J 400
i 600
J 800
Feed Pressure
J 1000
~ 1200
(psia)
80% 1400
IMPACT OF PERMEATE PRESSURE Residue Stream is Product 1.00
Relative Membrane Area
Methane Recovery (%)
100%
9 0 % Methane to 9 7 % 0.80
95%
0.60
90%
0.40
J/~u-mh
-
~Methane
....
Recovery
85%
";~',;rre',;;nt.
0.20
80%
0.00 0
i 40
i 80
i 120
Permeate Pressure
i 160
(psia)
75% 200
Fig. 13.2. Impact of selected process variables on single-stage membrane performance for a case in which the residue stream is the product gas. (a) Impact of feed pressure. Co) Impact of permeate pressure when the total pressure differential is kept constant. See overleaf for (c) and (d)
598
1 3 - ECONOMICS OF GAS SEPARATION MEMBRANE PROCESSES
IMPACT OF FEED PURITY Residue Stream is Product
,.oo
Methane Recovery (%)
Relative Membrane Area
1lOO%
,.oo
95%
i
0.80
Requirements
~
190%
oo. o.4o ~ ~
\ 1-\\ 1't 8o%
0.20
75% Product G88 Contains 97% Methane
0.00 20%
i 30%
, 40%
i 50%
l 50%
, 70%
, eo% F e e d M e t h a n e C o n t e n t (%)
_.L___'_.J 70% go% ~00%
IMPACT OF PRODUCT PURITY Residue Stream is Product 1.oo
Relative Membrane Area
Methane Recovery (%)
d
lOO%
0.80
96%
0.60
92%
0.40 Membrane ~
~
0.20 o.oo
90%
88'x, 84%
90% Methane in F e e d ' = ' ' .... o2% o4% oe% 9e% Product Purity Target (%)
Fig. 13.2continued. (c) Impactof feed stream
purity.
80% ~oo%
(d) Impactof product purity requirements.
reduce membrane costs and to improve recovery. At the lower pressures, the high packing density advantage of hollow fiber membranes becomes increasingly important due to the high membrane area requirements. Figure 13.2b demonstrates that even with the same pressure differential between the feed and permeate sides, overall performance is also a significant function of the permeate pressure. It is illustrative to think of this effect in terms of the ratio of the feed and permeate pressures. A vacuum pump on the permeate side can significantly increase the pressure ratio (and membrane separation efficiency) without greatly impacting the pressure differential. The impact of feed stream purity on membrane area requirements and product recovery is shown in Fig. 13.2c. The surprising feature of this graph is the appearance of a maximum membrane area requirement at the 60% feed methane concentration. Gas separation membranes are highly efficient at high CO2 loadings and the membrane area requirements decrease as shown. This occurs because the initial membranes remove enough CO2 that the resulting
13 - - E C O N O M I C S O F G A S S E P A R A T I O N M E M B R A N E PROCESSES
599
size of the gas stream is greatly reduced towards the latter stages of the separation. The smaller flow requires less membrane and this more than offsets the additional membrane area required for the higher initial CO2 loading. Figure 13.2d demonstrates that as one approaches a 100% purity target for the membrane separation, the costs of the separation rise rapidly. Although this is true for any separation, the rate of rise for membrane separations is generally sharper. For this reason membranes are not often employed as the final process step in cases where ultrahigh purity is required. They are best utilized to achieve purities of 99% and below. Some exceptions exist such as the dehumidification of air. 13.3.1.2 Product is the Permeate Stream
In most hydrogen applications the permeate stream is the product gas of interest. Membranes are highly permeable to hydrogen and this gas is most often the component sought in a separation. A typical example involves the separation of hydrogen from methane (and higher hydrocarbons) for recovery and recycle to a refinery process. This situation results in a quite different set of graphs from those presented in Fig. 13.2. These are displayed in Figs. 13.3a-d. In this case it is important to realize that the first gas permeating a membrane is enriched in the most permeable component (e.g., hydrogen). The concentration of hydrogen in the permeate stream is highest at the point that the feed first contacts the membrane. The feed gas at this point has the highest hydrogen concentration that the membrane will see and the driving force is at a maximum. As the feed gas travels down the membrane it is depleted of hydrogen and the driving force is correspondingly reduced. In the following examples, the permeate stream pressure is set at a slightly elevated pressure (50 psia) since most applications require that this stream be recompressed for use. The higher pressure reduces recompression cost. Figure 13.3a illustrates the importance of feed pressure on this separation. This plot is similar in appearance to Fig. 13.2a and reaffirms the general importance of pressure differential in membrane separation performance. Figure 13.3b analyzes the impact of permeate pressure on performance. Unlike corresponding Fig. 13.2b, this plot demonstrates that lower permeate pressures will actually result in an increase in membrane area requirements to achieve the same product purity. This seemingly contradictory result occurs only because the product purity target was kept the same. The lower permeate pressure would have resulted in a purer permeate if the membrane area had been kept constant. Since the purity target was fixed, however, more membrane area was required so that additional permeate gas would "dilute" the stream to achieve the targeted purity (the first permeating gas is enriched in hydrogen as was discussed above). The benefit is that product recovery is substantially
600
1 3 - ECONOMICS OF GAS SEPARATION MEMBRANE PROCESSES
IMPACT OF FEED PRESSURE Permeate Stream is Product 1.00
Relative Membrane Area Hydrogen Recovery (%1 - ~ 100% a ~lm,,~ 5 0 % Hydrogen to 95%
90%
0.80
Membrane ~ Requirements ~
mm~
0.60
ery
80% 70%
0.40
60% 0.20
60%
0.00
i ...... 200
0
_L. . . .
,
400
L. . . . 40%
ego
6oo
~ooo
Feed Pressure ( p s i a )
IMPACT OF PERMEATE PRESSURE Permeate Stream is Product Relative Membrane Area
1.oo b ~
Hydrogen Recovery (%)
~
~
_
~
~
0.80
90%
0.60
mm~
80%
~
0.40
0.00
70%
60% Hydrogen to 95% Constant Pressure Differential - 4 5 0 psi
0.20
o
100%
Membrane
' 20
*
~
'-
40
60
80
6o~,
~--J--- 60% lOO
Permeate Pressure (psis)
Fig. 13.3.Impact of selected variables on membraneperformance in the case where the membrane permeate is the product gas. (a) Impact of feed pressure. (b) Impact of permeate pressure when the total differential is kept constant. See opposite for (c) and (d).
enhanced. Lower permeate pressures actually provide a better separation and the membrane area increase is more a result of the improved hydrogen recovery. If the recovery rate was fixed (instead of the product purity) membrane area requirements would decrease with decreasing permeate pressure. Figure 13.3c illustrates that membrane area requirements increase with higher purity feed-gas streams. This relationship is again due to the fact that the product purity requirement remains constant. Since hydrogen is the permeating gas more membrane is required as the volume of hydrogen increases. Membrane area requirements also increase with higher recovery rates. Figure 13.3d demonstrates that the highest purity permeate is achieved with the lowest membrane area - - but with a significant recovery penalty. This outcome is again a function of the fact that the initial permeate is most concentrated in hydrogen. Thus, if high hydrogen purity is desired then only a
13 - - ECONOMICS OF GAS SEPARATION MEMBRANE PROCESSES
601
IMPACT OF FEED PURITY Permeate Stream is Product 1.00
Relative Membrane Area
Hydrogen Recovery
(%) 100%
C 90%
0.80
80%
o.8oi
70%
Membrane Requirements
0.4O
60% 0.20
50%
0.00 -' 40%
Product Gas C o n t a i n s 9 5 % H y d r o g e n i i. . . . i
'
_.L...
50% 8o~ 70% Feed Hydrogen Content (%)
8o~
40%
IMPACT OF PRODUCT PURITY Permeate Stream is Product Relative Membrane Area
Hydrogen Recovery
(%)
1.00 d
,
,
. 90%
0.80 ry 0.60
Membrane Requirements
0.40
~
70%
50%
0.20
5 0 % H y d r o g e n in F e e d 0.00 92%
J
i
i
i
93%
94%
95%
96%
30% 97%
Product Purity Target (%)
Fig. 13.3 continued. (c) Impact of feed stream purity. (d) Impact of product purity requirements.
relatively small amount of membrane is required. This figure demonstrates the trade-off between purity and recovery which must be considered in an economic optimization.
13.3.1.3 General Conclusions Some generalizations for a single-stage membrane process can be made: - Membrane area requirements are reduced and product recoveries are increased as the pressure differential increases. - The absolute permeate pressure (or pressure ratio) is also important. Higher pressure ratios lead to improved separation performance. Pressure differential alone does not define membrane performance. - Increasing membrane area leads to a purer residue but a less pure permeate. - Product recoveries tend to drop rapidly as the purity requirement is increased.
602
13 ~ E C O N O M I C S O F G A S S E P A R A T I O N M E M B R A N E PROCESSES
The last point brings us to a general observation for single-stage membrane processes. Membranes are very efficient concentrators. They become increasingly efficient as the product requirements are relaxed from a 100% purity target. Single-stage systems find good application as bulk concentrators prior to a second purification process such as amine, PSA, other molecular sieve or cryogenic treatment. As will be demonstrated in Section 13.4.4, multistage membrane systems can overcome some of the problems and limitations demonstrated for the singlestage systems. These multistage approaches usually require additional equipment but the costs often are small relative to the process improvements. A final important note is that gas separation membranes scale linearly with gas feed volumes. The advantage is that scale-up of a process is quite s i m p l e - just add more membrane area. There are no nonlinearities that are often associated with other separation processes. If the membrane separation works for a small gas stream then it will provide the same performance upon scale-up. The disadvantage is that the cost of scale-up is also more linear than some competing processes. Significant improvements have been made in this area, however, as innovations in membrane housing design are reducing the scale-up factor to values not much greater than traditional process equipment [14]. This is due to the fact that the membrane area cost component is generally far smaller than the associated housings and support equipment.
13.3.2 Design Trade-offs Careful analysis of Figs. 13.2 and 13.3 reveals the various trade-offs inherent in single-stage membrane process design. Optimization of a particular process can result in considerable economic benefits once the variables are understood. If constraints such as product purity and recovery are fixed, variables such as feed compression or permeate vacuum can be adjusted for process optimization. Given a specific application, there are three important elements to be considered in an economic assessment: (1) the cost of the membrane plant (membrane elements and pressure housings), (2) the capital and operating expenses of the compression requirement, and (3) any product losses (e.g., methane in the permeate stream). This is diagrammed in Fig. 13.4. The objective of an economic optimization is to design a process that will balance these trade-offs for a particular application. References occasionally appear in the literature that suggest that product loss for membrane separation is high in comparison with competing processes. This is a misleading statement that is often based on a single-stage membrane design, often with a poor choice of operating conditions. As will be illustrated in the following sections, much higher recovery rates can be achieved with multistage designs. These processes are rarely analyzed in the literature, however, since they are more difficult to design. It is generally true that the most
13 - - ECONOMICS OF GAS SEPARATION MEMBRANE PRCKESSES
MEMBRANE CAPITAL AND EXPENSE
603
COMPRESSOR CAPITAL AND EXPENSE I
PRODUCT
RECOVERY
Fig. 13.4.Trade-offsin membrane process design.
efficient membrane process will likely be one in which the product loss will be somewhat higher than that of an "equivalent" nonmembrane process. It is important, however, not to make process comparisons on just one parameter. Product loss should simply be counted as another operating expense. The advantage of membrane processing often comes in the lower capital investment and lower operating expenses. If these advantages offset the product loss expenses then membrane processing should be the preferred approach. 13.4 MEMBRANE PROCESS DESIGNS
If membrane processing were limited to single-stage designs then economic optimization would not be too difficult. However, a single-stage system may not allow the process engineer to meet preselected performance and process criteria. This limitation can be overcome with additional membrane stages and recycle loops. A wide variety of possible membrane process designs exist that can be employed with great benefit to solve a particular problem. The following discussion takes the reader step by step through a series of process design options to illustrate the importance of various factors. Several gas separation examples are presented to illustrate the practical importance of these designs.
13.4.1 Definitions A membrane stage is defined as one or more membrane modules assembled into an operating unit that provides a specific function different from any other membrane stages that may be utilized in the same process. A membrane plant is comprised of one or more membrane stages but the plant as a whole has a single inlet (feed) and two outlets (residue and permeate). Although the term "membrane stage" connotates a significant additional investment, this is not often the case. As will be seen, adding a membrane stage can be highly cost-effective. A good set of terminology for characterizing the various membrane process designs has not yet been established. The terms "two-stage" and "three-stage"
604
13 - - E C O N O M I C S OF G A S S E P A R A T I O N M E M B R A N E PROCESSES
membrane processes do not adequately define the nature of the configuration (i.e., whether any recycle streams are employed). This discussion draws on existing terminology and adds descriptive terms where appropriate.
13.4.2 Assumptions No one particular membrane type was selected for these analyses but the performance characteristics are reasonably representative of what can be found in the literature. Figures for membrane performance and pricing are particularly difficult to ascertain owing to the large number of systems and the wide range of applications. For example, although similarly priced membranes could be used for both air separation and hydrogen applications, the actual installed cost of both systems is radically different. This difference arises from the cost of highpressure housings, pretreatment, controls and supporting infrastructure. In fact, the cost of the membrane element is often a very small percentage of the overall unit cost. This percentage can run under 5% for small, high pressure units. An added problem is the wide range of membrane performance that can be found. For example, it is difficult to compare a low permeability, hollow fiber membrane to a high permeability, spiral-wound membrane. The effective performance difference between the two is minimized due to the fact that the hollow fiber membrane makes up for the lower permeability through higher packing densities. Membrane costs, when expressed as S/membrane area, are also misleading since they do not take into account the permeability or effectiveness of the membrane. In the above example the hollow fiber membrane would cost less per unit area than the spiral but the net price/performance of the two units would still be the same. For the purpose of the economic optimization analyses in Section 13.3, a Membrane Performance Figure (MPF) is established, which eliminates the membrane area and permeability variables. Membrane performance is characterized by the normalization of the gas flow (flux) of the membrane under fixed conditions to the installed membrane cost to achieve that performance. Thus, MPF is expressed as ft 3 $-1 hr-1 100 psi -1 or cm 3 $-1 sec-1 cmHg-:. This is simply the division of the membrane permeability (defined earlier) by the membrane price-per-unit area ($/ft 2 or $/cm2). The values selected for this analysis do not necessarily correlate with commercial values owing to the wide range of membrane performance, pricing and installed costs that accompany any particular installation. These analyses also assume that the permeability of each component through the membrane is independent of composition, pressure and temperature. All membranes are influenced by these variables, however, and they must be considered in actual design. The numbers presented here may therefore not be representative of actual membrane units. Operating conditions were selected to illustrate a point and no attempt was made to optimize the
13-- ECONOMICSOFGASSEPARATIONMEMBRANEPROCESSES
605
d e s i g n for the case studied. Table 13.2 lists s o m e of the major a s s u m p t i o n s e m p l o y e d in this Section. The M P F v a l u e s are b r o a d l y r e p r e s e n t a t i v e of m e m b r a n e t e c h n o l o g y b u t t h e y s h o u l d not be u s e d for j u d g i n g economic viability of a p a r t i c u l a r process. A n y n u m b e r of factors could substantially increase or decrease these figures. T h e s a m e caveats clearly a p p l y to c o m p r e s s o r s a n d o p e r a t i n g expenses. H i g h - p r e s s ure oil field c o m p r e s s o r s cost far m o r e p e r unit of h o r s e p o w e r t h a n l o w - v o l u m e , l o w - p r e s s u r e systems. These variables are fixed for the following d i s c u s s i o n so as to p r o v i d e a basis of reference that allows consistent conclusions a b o u t m e m b r a n e process d e s i g n w i t h o u t interference f r o m dislocations in m e m b r a n e cost variables. TABLE 13.2 Membrane performance and economic assumptions A. Membrane Performance
Membrane Type
Application
A C
Hydrogen and Carbon Dioxide Separations Air Separations Solvent Vapor Recovery
Gas
Membrane Performance Factor (scf $-1 hr-1100 psi-I) Type B , Type C Type A
B
H2 N2 CO CO2 CH4 02 Toluene
2.8x10⁻¹ 5.7x10⁻³ 7.5x10⁻³ 1.4x10⁻¹ 6.7x10⁻³
Selectivities
Type A
Type B
H2/N2 H2/CO CO2/CH4
50 37 21 42 -
-
H2/CH4 O2/N2 Tol/N2
0
-..
3.8x10⁻²
1.0
m
..-
m
2.0x10⁻¹
m
80
5.2 -
Type C
8O
Notes: To convert units to cm3 $-1 sec-1 cm Hg-1 multiply the Membrane Performance Factor by 1.43x10⁻². Gas pair selectivities are calculated by dividing the respective MPFs.
(continued)
606
13-- ECONOMICSOF GASSEPARATIONMEMBRANEP R O S
TABLE 13.2 (continuation) B. Membrane
Process
Assumptions
- Solution-diffusion mechanism - Permeate backpressure 1-10 psi - Negligible pressure drop on residue stream - Membrane life two to five years depending on application - Membrane Performance Factor is independent of temperature, pressure and gas composition -Compressor and vacuum pump efficiency set at 70% C. Cost
Assumptions
Item
Installed Cost
Gas-fired Compressors, High Pressure Electrical Compressors, High Pressure Air Compressors Vacuum Pumps Electricity Natural Gas, at Wellhead Natural Gas, Utility Hydrogen Gas
SL000/HP $500/HP $250/HP $1,000/HP $0.06/kWhr $1.50/MM Btu $5.00/MM Btu $3.50/Msqf
D . C o s t Calculations Total Capital is the sum of installed membrane and compressor (or vacuum pump investment). No Working Capital is assumed. Yearly expenses are the sum of the following items: product losses (calculated as the amount of product gas not recovered in the separation times the value of the purified gas). power expenses for operating compressors or vacuum pumps. membrane replacement expenses calculated at 20% of the total installed membrane capital per year, or less, depending on the application. - maintenance expenses calculated as 5% of the installed compressor cost. The Process Cost is calculated as the sum of Yearly Expenses and Capital Charges divided by the product gas flow to arrive at a process cost expressed in S/unit volume.
Factors I hp (horsepower) = 0.746 kW I psi - 6.9x10³ Pa I psi = 6.89x10⁻² bar I psi = 0.07 k g / c m 2 1 scf ft-2 hr -1100 psi -1 = 1.55>