D e Vil lie r s & Ta yl or on Poi nt an d Fi gu re Char t ing
o n Po in t a nd Fi gure Cha rt in g
It is to the credit of both authors that they recognized just how valuable to investors and traders the Point and Figure method could be and that they saw fit to produce this fascinating work on a subject that in its essence is just putting small "Xs" on graph paper. But how to put them to graph paper and how to read their meanings is what can separate the trading and investing boys from the trading and investing men. Surveying all of the writings that have been published over the years, we find there have been and are a number of good, very good and excellent books on the Point and Figure methodology and its star attributes. However, every once in a while someone comes along and writes what is easily the seminal work, the finest on its particular subject. Over 70 years later we can attest to the fact that Victor DeVilliers and Owen Taylor rule the roost on their chosen subject with the two volumes republished here, which taken together, have to be considered the ultimate – "The Bible of Point and Figure Charting."
DeV ill ie rs & Taylor
Little is known about the personal lives of each of these authors, but in surveying their other books and writings, a more informed picture emerges of their capabilities in their chosen field; stock and futures market analysis. From the quality and clearness of the writings in this and other of his works, it soon becomes apparent that Victor DeVilliers was not only very knowledgeable on the markets but he had the uncommon talent to put it into written words. (Most market authors are generally better traders and investors than writers.) On the other hand Owen Taylor was certainly extremely capable, being more the expert on the technical aspects of market analysis, something easily ascertainable from the Technical Analysis subjects that he presented in his own books and booklets.
DeVi lli ers & Taylor on
Point a nd Fig ure
Charting
V i ctor De V il l i e rs Owen Tay lor
I nt ro du ced a n d ed it ed by Do na ld M ac k Hh
Hh
Hh
Harri man House Cl assi cs
7.44 x 9.69
.637
7.44 x 9.69
Harri man House Cl assi cs
DEVILLIERS AND TAYLOR ON
POINT AND FIGURE CHARTING
DeVilliers and Taylor on
Point and Figure Charting Victor DeVilliers Owen Taylor
Introduced and edited by Donald Mack
HARRIMAN HOUSE LTD 3A Penns Road Petersfield Hampshire GU32 2EW
Tel: +44 (0) 1730 233870 Fax: +44 (0) 1730 233880 email:
[email protected] web site: www.harriman-house.com Devilliers and Taylor on Point and Figure Charting first printed in the United States of America in 1933 Second edition 1934
First published in Great Britain 2000 by Pearson Professional Limited This edition published by Harriman House Ltd © Harriman House Ltd 2007 ISBN 1-905641-52-4 ISBN 13: 978-1-905641-52-9
British Library Cataloguing in Publication Data A CIP catalogue record for this book can be obtained from the British Library.
All rights reserved; no part of this publication may be reproduced, stored in a retrieval system, or transmitted in any form or by any means, electronic, mechanical, photocopying, recording, or otherwise without either the prior written permission of the Publisher. This book may not be lent, resold, hired out or otherwise disposed of by way of trade in any form of binding or cover other than that in which it is published, without the prior consent of the Publishers. Printed and bound by Lightning Source
ABOUT THE AUTHORS Victor DeVilliers and Owen Taylor We know so very little about the personal lives of each of these authors, but in surveying their other books and writings, a more informed picture emerges of their capabilities in their chosen field, stock and futures market analysis. From the quality and clearness of the writings in this and other of his works, it soon becomes apparent that Victor DeVilliers was not only very knowledgeable on the markets but he had the uncommon talent to put it into written words. (Most market authors are generally better traders and investors than writers.) On the other hand Owen Taylor was certainly extremely capable, being more the expert on the technical aspects of market analysis, something easily ascertainable from the Technical Analysis subjects that he presented in his own books and booklets. It is to the credit of both authors that they recognized just how valuable to investors and traders the Point and Figure method could be and that they saw fit to produce this fascinating work on a subject that in its essence is just putting small "Xs" on graph paper. But how to put them to graph paper and how to read their meanings is what can separate the trading and investing boys from the trading and investing men. Surveying all of the writings that have been published over the years, we find there have been and are a number of good, very good and excellent books on the Point and Figure methodology and its star attributes. However, every once in a while someone comes along and writes what is easily the seminal work, the finest on its particular subject. Some 65 years later we can attest to the fact that Victor DeVilliers and Owen Taylor rule the roost on their chosen subject with the two volumes republished here, which taken together, have to be considered the ultimate "The Bible of Point and Figure Charting."
ABOUT THE SERIES EDITOR Donald Mack If any phrase describes the editor of the Traders' Masterclass Series, which is dedicated solely
to bringing back to traders and investors everywhere many of the great and rare Technical Analysis classics from the past, that phrase would be "a perpetual student of the market." Students in high school or college eventually graduate. Not so students of speculative markets. The study and the work is never finished, especially when there is an enduring interest in Technical Analysis. The editor's interest grew by leaps and bounds when in the late 1970s and the 1980s he established in Los Angeles the only bookstore in the USA that dealt exclusively in stock and commodity books; those that were in print at the time and those that were out of print. Current books were generally unchallenging and of various degrees of quality. Many out-of-print books were also of varying degrees of quality, but so many fascinating rare works from the 1920s to the 1950s, of great creativity and marvellous technical analytics and application came his way, that a lifelong appreciation of their quality grew. Almost needless to say, more attention was focussed on the old books than on the new, for he found those old books that made up the great classics were superior to the new in so many ways. While he was operating the bookstore, there was a natural inflow and outflow of many thousands of books and from those thousands of books a personal library and collection numbering a good 5,500 plus individual titles was put together. A little of the knowledge contained in these great market classics rubbed off on the editor (actually more than a little) and he trusts that it will also rub off on the many market students of today and tomorrow as they also come in contact with the superb Technical Analysis classics that will come their way through this Series.
CONTENTS
The Trader's Masterclass Series Editor's Introduction
xvii xix
VOLUME 1
THE POINT AND FIGURE METHOD OF ANTICIPATING STOCK PRICE MOVEMENTS 3 5
Preface to First Edition Introduction to First Edition 1 THE PRINCIPLES OF THE POINT AND FIGURE METHOD
Logic is the basis of this Method Irrelevant fluctuations eliminated How the Method got its name Graphs are logical and scientific Introductory summary of important principles Needed accessories are few Plotting a stock price movement One point charts the basis of the Method Accessories and working tools 2 THE WEIGHT OF AUTHORITY BEHIND THIS METHOD
Refined to coordinate with present day markets Mystery and complications have been clarified Expensive financial and economic reports unnecessary Certain factors taken for granted Analytical technique easy to master Losses limited while profits accrue Method weighs forces of buying and selling 3 ADVANTAGES OF THIS METHOD OVER OTHERS
9
12 12 13 13 13 14 15 15 16 17 20 20 21 21 21 22 23 25 27 27 27
Speed and ease of recording data The Method ignores volume Price changes versus volume
- ix-
CONTENTS
Supply versus demand Volume easily manipulated Facility of this method The utter simplicity of the records Manipulation readily detected Use all full figure changes in making charts Method is superior to inside information Isolation develops best results Our charts reveal plans of the majority How the move begins Stock market trading is a business Inside information unnecessary One point charts show all
4 THE VITAL POINTS
28 28 29 29 31 31 32 32 33 34 34 35 36 37
Vital point I - recording full figure changes Vital point II - only full figure changes Vital point III - suitable graph paper Vital point IV - use of horizontal and vertical columns Vital point V - trend reversals Vital point VI - only one symbol to a square Vital point VII - move over diagonally Vital point VIII - skip no squares Vital point IX - formation of congestion area Vital point X - the full fulcrum Vital point XI - first buying point Vital point XII - the catapult Vital point XIII - secondary buying point Vital point XIV - the semi-catapult Vital point XV - third buying point Vital point XVI - watch for distribution Vital point XVII - trend lines Vital point XVIII - forecasting the extent of the move 5 APPROVED METHOD OF ASSEMBLING AND MAINTAINING PROPER DATA
The ticker tape Source of all data Daily full figure fluctuations available Method ideal for those at distant points Application of the data How to prepare and collate the needed data
-x-
40 40 41 41 41 41 43 43 43 44 44 44 44 45 45 45 45 46 47 49 50 50 51 51 52
CONTENTS
Proper graph paper helpful Arrange charts orderly How to select the issues to record Clarifying the use of the symbols Moving to next vertical column Use of symbol "0" One cardinal principle Gaps are not recorded How the gap occurs Plotting the gap The one point chart The three point and five point charts Condensing the one point moves Other helpful aids The method substitutes for tape reading Trend outline and geometrical charts The proper issues to chart Commodity price movements
52 52 53 54 54 55 56 56 57 57 58 58 58 60 60 60 62 63
6 THE SCIENTIFIC FUNDAMENTALS
65
The fulcrum Leverage Watch for a fulcrum The ideal full fulcrum Down trend a prerequisite to fulcrum formation Supply equals demand Advantage of figure charts The buying points The broad fulcrum The recoil fulcrum The catapult The true catapult The false catapult The semi-catapult Use liS tops" to protect position 7 THE PRINCIPLES OF CHARTING
67 67 67 68 70 70 70 71 71 72
73 73 73 76 76 79 81 81 83 83 84
The one point chart Move to next column Signs of a fulcrum Technical aids The three point chart
- xi-
CONTENTS
85 86
Determining three point moves The use of five point charts 8 ANALYZING TECHNICAL POSITION
The price path characteristics Patterns of the leaders duplicated in the secondary issues Solid formations give confidence Watch for changes in activity Strong and weak technical position Weak technical position Gauging the length and culmination of the moves The count Coordinating your studies 9 ANTICIPATING THE ACTION OF U.S. STEEL
The full ideal fulcrum The catapult position The semi-catapult position Consolidating the gains The final mark up The end of the move - a reverse fulcrum The short positions Geometrical charts The trend outline charts The three point figure charts The five point charts Summary
10 ANALYZING A CAMPAIGN IN WESTERN UNION
89 91 91 91 92 92 92 93 93 93 95 98 98 98 99 99 99 101 101 101 101 105 105 107 109 109 111 111 111 113
Selecting the fast moving issues The full fulcrum base The catapult The semi-catapults The short positions Summary 11 JUDGING THE MINOR SWINGS
The half hourly index of the Dow Jones Industrials The half point half hourly log Half point technique Scientific tape reading Analyzing the half point chart
- xii-
117 119 120 120 120 123
CONTENTS
Ignore rumors and gossip Summary
123 123
12 HALF POINT TECHNIQUE IN ATLAS TACK
Historical background Analyzing the campaign in Atlas Tack Important signal during July break The first caution signal Board room observations The shorts began to cover Point and Figure analysis 13 THE MAIN TREND AND MAJOR CYCLE CULMINATIONS
Critical culmination points easily detected The one point chart - the basis for analysis Interpreting an intricate major culmination The first temporary top Semi-catapult point - unusually bullish pattern Strength carries through objective level The change over of technical action The top of the move clearly indicated Indications of a major culmination Bear trend technical action The investor or long term trader 14 TECHNICAL INDICATIONS AT A TURNING POINT
The change to an up trend The change to a down trend
125 127 127 129 130 131 131 131 133 135 135 135 140 141 141 141 142 143 143 144 145 147 147 149
Conclusion VOLUME 2
ADVANCED THEORY AND PRACTICE OF THE POINT AND FIGURE METHOD 1 PREREQUISITES TO SUCCESSFUL TRADING
Develop proper mental approach The value of isolation Proper and adequate physical equipment Technical knowledge and equipment
- xiii -
153 155 156 156 157
CONTENTS
158 158
The importance of selective data Tape watching or active trading 2 BASIC PRINCIPLES - THEIR APPLICATION Basic principles underlying this method The trading range - accumulation The fulcrum The mark up Dis tribu tion The trend line For long term main trend operations Plotting the trend line Technical position Determining the technical position of the market through the use of the five dominant positions Resume
161 163 163 164 164 164 165 165 166 166 167 167
3 CHART FORMATIONS INDICATED THE INCEPTION
OF AMOVE
169
The value of charts One cardinal principle which must be understood A necessary premise Wait for signs of accumulation or distribution What to look for Await previous support How the move begins Establishing a long position A practical example Dead center The use of the stop Ultra-conservatism
171 171 172 172 173 174 175 175 177 178 178 178
4 RECURRING OPPORTUNITIES DURING THE MOVE Study creates skill Recognizing opportunities Dividend absorbed A long position established lion stop" Judging the move Confirmation of the move A critical analysis of trading zones How to plot new trend lines
- xiv-
181 183 183 185 186 186 187 188 189
CONTENTS
5 THE ONE POINT CATAPULT AND SEMI-CATAPULT Strong signals Illustrations of catapult and semi-catapult patterns Broad fulcrum desirable Catapult and semi-catapult not the same as the conventional "new high" Tracing a move in DuPont The ladle formation Confirmation How to analyze the trend Watch the trend line and use stops 6 GAUGING THE VOLATILE ISSUES A fast mover An unusual and unique device Individual characteristics often repeated Long positions Consolidation zone Three point summaries should be consulted
191 193 194 194 195 196 196 198 199 200 201 203 205 205 207 208 208
7 HOW TO RECOGNIZE ADDITIONAL OPPORTUNITIES IN
VOLATILE STOCKS
211
Low priced stocks Avoid guesswork Erratic stocks not dangerous Consider the unexpected Conservation pays The importance of dividends, extras, and rights Watch "ex-dividend" dates Limit losses let profits accrue Continually analyze the formations
213 213 215 216 216 218 218 219 219
8 CULMINATION, LIQUIDATION, PROFIT TAKING, AND THE SHORT SIDE When to take your profits One point signals on the short side The reaction pattern in ACF Signal for the short side Watch for signs of absorption The inverse catapult Signals for short and long positions Analyzing a stock for technical position Signs of culmination
- xv-
221 223 225 226 226 227 228 229 231 231
CONTENTS
9 THE THREE POINT CHART
233
How to prepare the three point chart Averages a confirmation Watch for the balance of forces The importance of seasonal trend Three point analysis
10 COORDINATING THE ONE POINT WITH THE THREE POINT CHARTS Three point chart a check on the one point chart Illustrations of coordination Inside accumulation Manipulator's campaign The manipulator's methods The false start Pool switches to short side A new angle on narrow fluctuations
235 236 238 238 238
241 243 243 246 246 249 250 250 251
11 THE COUNT - GAUGING THE EXTENT OF FUTURE MOVES The theory underlying the count The count not an exact science Horizontal formation may disclose the extent of the move The principle of "the count" The one point count The forecast Anticipating the next move Additional charts for study The count by three points A new point for a forecast Accuracy of the count A three point test for future market action Cumulative implications more reliable
253 255 256 256 256 257 257 259 259 263 263 265 265 265
Conclusion
269
Index
271
- xvi-
EDITOR'S INTRODUCTION
If we honestly weigh up the two combined volumes that make up this Course and closely examine their merits in their particular area of specialization - Point and Figure (P&F) charting and analysis - the verdict, in this writer's opinion, has to be that these works comprise the finest writings ever produced on P&F. He therefore has not the slightest problem in making the comparison that this work is to P&F analysis as Richard Schabacker's unmatched masterpiece Technical Analysis and Stock Market Profits: A Course in Forecasting* is to the area of Technical Analysis (TA) - its undisputed "Bible." To their credit, Messrs DeVilliers and Taylor have written that which we can genuinely call "the Bible of Point and Figure Charting and Analysis;" they can also be seen to have given flesh and sinew to a subject that at the time and ever since has superbly seen their mission fulfilled here. However, just like the Schabacker Course, it should be noted that these two P&F volumes (intriguing as they are) on this very popular analytical method have unfortunately remained practically unknown to traders and investors in the US and the world for far too many years. To be accurate though, this is not quite so, for Mr DeVilliers, on his own some years later, wrote a treatise on the same subject and used the same title as this earlier work. What he wrote has occasionally been reprinted to meet the need for more material on this undercovered methodology, material which is always being sought and which there is relatively little available to meet the demand. However, as a fair evaluation, I would describe this later DeVilliers book as an abridged version in which he incorporated some material from the original two volumes that he had coauthored. But in making any comparisons, it will soon be seen that this later book comes out as a shortened and a pale imitation of his earlier collaboration with Owen Taylor, giving strength to the impression that Taylor was the guiding technical light in the partnership and DeVilliers the writing light. Anyone seeking a copy of this meticulous DeVilliers and Taylor work will generally be out of luck. It has only very rarely showed itself the past several * This 1932 classic masterwork recently republished in 1997 by Financial Times Pitman Publishing is available from booksellers the world over and an absolute 'must' for market students.
- xix -
EDITOR'S INTRODUCTION
decades since the original 1934 publication date for reasons that equally apply to just about all the books that now make up, or will make up, this Traders' Masterclass Series of market classics. This can all be put down to one very major culprit - the ravages of Time. That the goddess of Time chooses who she shall be a literary friend to and who she shall not is an enigma that can be welcomed by those who are so favored, and lamented by the greater number whose writings fall by the wayside and remain lost to succeeding generations. Thus it has been more often than not, in our chosen field of stock and commodity market literature, that the Time goddess sadly has turned out to be more the stern enemy of so much of this literature and friendlier to only a relatively select few. In many ways that was the fate of the original editions of the re-published works you are reading from right now, and except for a very rare surfacing, they just have not been seen by very many for several decades. However, once in a while and in mysterious ways there comes the Great Spirit, to those who are open to it, and with it help from those higher spiritual entities (for the want of a more accurate or better description) that choose to eventually save that which they choose to save. As will soon be seen in what follows, this can be put down to some unknown guardian angel(s) that almost solely had to have been responsible for a very fortuitous intervention that saved, and made possible to pass on this masterpiece on P&F charting and analysis (among several others). Involved here is a story that goes back to the early 1980s when I was operating my unusual bookstore in Los Angeles that uniquely specialized in stock and commodity books. At the bookstore, while I dealt in those market books that were currently in print at the time which I would describe as mostly aho-hum," there were other books that intrigued me much, much more that I really sought - the rare older books and the great market classics that by then were long out of print, very scarce, and very hard to find. One of my customers (so fortunate for us all that he was) at the time was living in Seattle and inquired of me as to whether I would be interested in purchasing some out of print books that he had on hand and was no longer interested in. Well, between postal contacts ( no e-mail then) and a visit to Seattle we managed to exchange the necessary funds for books and books for funds, resulting in their addition to my bookshop on my return to Los Angeles. In the course of all that interchange, the details of how those books (and what an absolutely fabulous collection they were) came to eventually be in Seattle was told to me. lt seems that my book-selling customer was living in New York City some years earlier and was interested in starting, or carrying on, an investment advisory business. To do this he needed appropriate offices and the ideal - xx-
EDITOR'S INTRODUCTION
location for those offices was the nearby Wall Street area. Finally locating suitable premises at the well known 150 Broadway Building and in preparing to move in, he had met with the landlord's agent in his new-to-be offices to make the final arrangements. While there the agent pointed to a large pile of papers and books in the center of the room and remarked to our friend "Say, you're in the stock market business aren't you?" "Yes I am," was the reply. "Well, so were the people who had their offices here before you. They left this material which you see piled on the floor here and I'm waiting for the waste collectors to pick it up to clear the way for you to move in. If it's of any interest, give me a few bucks and you can have it." Then slightly more than a few bucks changed hands, and as the reader will see, so was saved for posterity the finest lot of exceedingly rare books and courses that ever came my way, or probably anybody else's too. All I can say is "What material it was!" In that collection of papers, books, etc. designed to be destroyed was one of the most noted ever of market books (again among others), one that in itself is one of the all-time greatest of classic technical writings. So well known and famous is this one book that many reading this Introduction will with just a few descriptive words recognize it instantly. Importantly it has to be seen that while it was a book, in this case it wasn't a book - it was the manuscript of a book - original bound typewritten papers accompanied by the author's hand-drawn illustrations and handwritten notes. And who was this author and what was the title of this book that he himself eventually published (only 1,000 copies ever saw the light of day with that publishing)? Well, the date of that publication was 1946, the year following the end of World War II. From my personal knowledge, I for one certainly wouldn't describe that year, in general, as being an especially notable one for published books devoted to our favored field of technical analytics. However, the 1946 date alone should awaken the memories of a number of devotees to that author's writings, recognizing it, in turn, as the extremely noteworthy year that this work made its so very prestigious contribution to market analysis. That 1946 date so memorably marks the time that we can all look back on as the really notable exposition of a field of market analysis that has been pivotal in opening up one of the most followed technical approaches today. And that "we" refers to thousands and thousands (probably millions now) who in the fifty-plus years that have passed are exceedingly grateful for, and have to and do stand in awe of this monumental work. The book's title - Nature's Law: The Secret of the Universe - the opus magnus of its now well known author and conceptualizer Ralph Nelson Elliott, the creator of the Elliott Wave Principle. How this unique manuscript, the supreme exposition on the Elliott Wave, - xxi-
EDITOR'S INTRODUCTION
found its way to the 150 Broadway offices of the people who were also the publishers of this monumental work on the P&F Method by DeVilliers and Taylor, in all probability, will remain consigned to the arcane knowledge of the market gods. Why it happened to be there most probably we will never know, but fortunately for us it was and very fortunately also for us it was saved. As a side note to the manuscript's whereabouts today, it was eventually brought by myself to the attention of, and acquired by, the one person today who is undoubtedly the leading exponent of the tenets of the Elliott Wave Principle as originally propounded by R. N. Elliott. Normally being the ultimate market book collector that I was, I would not have let so valuable an original literary masterpiece go, but as it was it was really more fitting that it belonged in someone else's hands other than mine. For this reason I contacted Robert "Bob" Prechter in Gainesville, Georgia. Knowing Bob to be the dedicated and leading collector of original Elliott material that he is, the Nature's Law manuscript certainly went to where it deserved to be. Additionally in that pile destined for destruction were six or seven each of the original two volumes of this re-published work that you, the reader, are presently reading from, the only such original printings ever to come my way. When dealing in market books as I was doing at the time, understandably the heart leaps up when what amounts to the ultimate comes your way - the rare, the very rare, and the exceedingly very rare market classics that always seem to make their appearances in most unexpected ways. That's how it was when these two original P&F gems, which together make up this "Bible of Point & Figure Charting and Analysis," wound up in my market bookstore. And in a larger sense, it was a result of this legacy from this fortunate series of events that has made the possibility of this re-published edition a reality, and that great numbers of stock and commodity market P&F afficionados will now for many years be able to study, appreciate, and put to use the superb P&F knowledge incorporated in this exposition. It is potentially sad that such great material, if it hadn't been saved the way it was, could very easily have gone for good, rarely, if ever, to appear on the scene again. Just to wrap up this tale of good fortune of the saving of a large number of extremely rare market works, there were many more in that 150 Broadway pile. One of the most outstanding of market classics also to be saved was a complete and totally unknown Course written by Harold Gartley in 1933 which preceded his later 1935 Course Profits in the Stock Market, a work itself unfortunately not known except to a limited number of TA afficionados. So worthy is this Course, in this writer's strong opinion, that it easily belongs to the highest level of all the - xxii-
EDITOR'S INTRODUCTION
technical writings that in total have been published over the past 70 years. He has no hesitation in easily ranking it as the second finest work ever on TA, just being surpassed by the previously mentioned Technical Analysis and Stock Market Profits by Richard W. Schabacker which I rank as the finest book ever on this major subject. However, not to be outdone, there has to have been some unseen working of Divine intervention and design that this really unknown 1933 Gartley Course, written two years before Profits in the Stock Market, was destined to be rescued as it was. Fate must want it joined to the other great TA classics in our Masterclass Series that have been re-published the past few years. It certainly deserves to be in that honored company and the chances are good that once again it will see the light of day to enlighten investors and traders the world over. In DeVilliers and Taylor's own Introduction to Volume I, I believe the reader might be taken aback a little and left wondering when they see the reference to a third volume. Their Introduction shows that the present combined Volume 1 and Volume 2 are really a part of what is a three-volume set. There's a story here, and in keeping with my aim in all introductions that I write for each of the great market classics that I choose for re-publication, I try more to personalize each work with the strongest connections that I can (not always easy) to the original great market mind(s) who originally produced it. I feel it is vital that I especially do this because of the unique nature of these superb speculative writings, and for the reason that in most market books the reporting on the authors generally leaves bland personalities at best. Market books can be notorious on this score when we come to the 'who' of who wrote them, why did they feel they had to write what they wrote, and what have they written that really separates them (if it is the case) from the more standardized dross found in so many other market books. Returning to the pile of papers and written works that lay on the floor of that room at 150 Broadway, there was also to come my way two original copies of this exceeding rare P&F Volume 3 which, as I write this in 1999, I wish so very much were now in my personal possession, but such is not the case. One of the two Volume 3s I kept for my personal collection, later to meet a sad demise; the other I sold to someone who was very much into P&F charting and who just had to have it. I thought I knew who this was, but on checking with them I now know that my recollection was faulty. So if by some chance the person who was the recipient reads this, please contact me at the e-mail address at the end of this Introduction - I sure would like to have a copy of it again. Or should anyone else have a copy of this rare work, or any other fine classic that they feel should be
- xxiii-
EDITOR'S INTRODUCTION
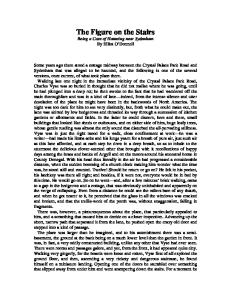
preserved for the ages to come so that future market students may be able to see the great classic market writings that we have had a chance to study, please contact me. It would be a shame if those to follow were to be deprived of a great deal of the greatest of the great. What is evident from the authors' own Introduction in Volume 1 is that they replaced the Introduction originally printed in 1934 with their Introduction that had to have been written in 1941 or 1942. That, in turn, now calls for some conjecture. On an earlier page where I wrote "About the Authors," it may be recalled that I mention that I felt that Victor DeVilliers was much the better writer of the two, and Owen Taylor was really much the better technical analyst. This division of contributed specialist effort is not only deduced from the material in this book, but also proven to myself from having read the books and booklets they both individually produced in the years preceding this P&F work and in the years afterwards. If I am right, then they themselves probably came to a similar conclusion when weighing up the merits of working together on this subject which was certainly crying out for the superior coverage of its methodology and analytical aspects that they gave it and which we meet as we get into the contents of this masterwork. Going on from the Authors' Introduction, and as the pages are turned to get into the main P&F chapters that follow, the first thing that will immediately grab the reader's attention will be the two odd looking pages that will be found preceding the text of the book's body. What is to be seen is something unique, very unique, and something that I cannot recall ever seeing in any market book on any analytic methodology, let alone any P&F book. So be prepared for the displays of "Mechanical Principles" we are all about to meet. For it is there we come upon "The Lever ... The Fulcrum ... the Catapult," our introduction to the principles of Physics. Later in the text we are also destined to meet liThe ideal Fulcrum ... The Broad Fulcrum ... The Recoil Fulcrum ... The True Catapult ... The False Catapult ... The Semi-Catapult ... The True Semi-Catapult ... The False Semi-Catapult." With the coverage given by the authors in 1934 to all these creative mechanical principles, there is a great truth illustrated here that this writer never tires of making. He makes this point in the light of so much misguided thinking that abounds with so many of the millions of (professional and individual) traders and investors that make up the investment game around the entire world. This truth is an old "shibboleth" that keeps popping up all over the investing scene, especially from those that are relatively new to investment and investing. Over and over again so many find it extremely hard to accept that something written - xxiv-
EDITOR'S INTRODUCTION
80,70,60,50,40 years ago on pulling profits out of any speculative market can have much going in its favor. This all comes down to commonly accepted thinking that with all the wonderful computer power at hand and with all the marvelous mathematical market brainpower (PhD's to the left of us and PhD's to the right of us), we have or will have all the answers. So now it is out. How lucky we are to be for in the near future we with our computers are almost guaranteed to soon be millionaires(?). So what possibly can a bunch of computerless market minds writing years ago have to contribute to us today? Well, the answer, in a nutshell, is that the mainstay PhD rocket-scientist mathematicians that are so revered in Wall Street and the City of London financial circles (shall we ignore the fiascoes of their participation in Long Term Capital Management and the many other hedge funds?) just do not have much of a chance in the contest. Perhaps, just perhaps, as exemplified by the horrific results derived from the grand operations of LTCM, the point will come across that mathematical power applied to investors' and traders' analysis in speculative marketplaces is a waste of time. It always has been, and barring a miracle of the ages, always will be beyond the application of mathematics to analyze people and their actions, which are at the end of the day what constitutes speculative markets - anything else is fluff. And fluff mathematics (which is what it is in coming to terms with people and their predictive actions), no matter how much they are held in the esteem of the investment powers-to-be as the way to miraculously come up with great investment results, just won't do it. So that really beggars the question "just what will do it?" The answer to this question has always been around ever since the first markets came into being centuries ago, and the same answer will be with us in centuries to come - work hard, study even harder, and learn and learn and learn. Then apply it all through individual application in the ways that suit each individual's leanings. Looking at the stark reality of speculative investment, just suppose everybody had the answer to 100 percent sure profits on every transaction they do. Who would sell if they knew it was a 100 percent time to buy, and who would buy if they knew it was a 100 percent time to sell? It just couldn't happen, and it never will either. There is no way going through any human mental gymnastics whatsoever to predict what the future holds and what mayor may not come to fruition. We cannot nor will we ever beat what we call the "Spirit of the Market" which has and always will continue to confound human designs to beat it. What we can do is recognize that speculative markets are down to individual decision-making, even in the largest of investment organizations, and each decision-maker has to - xxv-
EDITOR'S INTRODUCTION
go with all the tools, the methods, and the analyzing and trading skills that they the individual can muster. With every buy or sell decision coming down to some method, some approach, or some seemingly rational, or even irrational, thinking process, there has to be the actual act of buying or selling or it all remains in the realm of fantasy. Sticking with the more rational approaches, we have to start with the two ultimate major schools of investment analysis and thought - Fundamental Analysis and Technical Analysis. As this writer is a fervent, totally mad, and dedicated technical analyst, we'll start by throwing out all considerations of Fundamental Analysis (mainly involved with the study, evaluation, and projection of a company's accounts) and its practitioners, fundamental analysts. It has to be appreciated that even though he is solidly in the Technical Analysis camp, he still is very fair-minded and applauds the contribution they render to the field of investment analysis as the noble fundamental analysts that they are. That certainly is being extremely fair to their side, even though he wouldn't let his daughter (should he have such) marry one of the scoundrels. Like any great school of natural analytical thought, there has to be some solid foundation underpinning Technical Analysis's raison d'etre, that upon which it will stand, that from which it is all launched and that which it all purports to be. The basic starting point for TA will be found to center around three main charting methods that represent the foundation of each analytical technique. The oldest method is the one that we in English refer to as Japanese Candlesticks, and which today has many adherents inside and outside its country of origin. Almost comparable in form to Candlesticks, if not quite in analytical interpretations, but with much more emphasis on the passage of Time (more than with Candlesticks), we have Line and Bar Charting which originated this century in the USA. But the charting methodology that is near and dear to many of us at times is Point and Figure Charting whose origination is generally credited to have taken place in the nineteenth century. By some sources it has even been credited to the venerable Charles H. Dow, one of the founders of the Dow-Jones Company and the first editor of The Wall Street Journal. However, it is this writer's belief that P&F charting was used by market traders earlier than Dow's possible creation of this form of charting, for it probably was a bit before Dow's rise to eminence when the old glass-domed ticker machines were churning out the trades as they occurred on the different exchange floors. Situated as these machines were in brokers' offices all around the country, from the start brokers and customers reading the tape and trading on the printed figures must have needed a fuller picture at hand of the action that had taken place and was currently happening. - xxvi-
EDITOR'S INTRODUCTION
The answer had to be that records would be necessary to follow price movements over months, weeks, days, and intra day also. Who it was that initially devised the P&F method of charting will have to remain totally unknown to us, but there can be no getting away from their memorial- the P&F charts that have and continue to proliferate around the investment world. Today we draw P&F charts using entries composed of all "Xs", or alternatively "Xs" and "Os" in the manner as explained in the following pages by Messrs DeVilliers and Taylor. Our market forebears in the last century used the exact same P&F methodology, but their notation nomenclature was slightly different and now would be a good time to lay it out for any reader who may not be aware of what those of yesteryear referred to as "Point" and as "Figure." Back then it was normal to record a price change whenever a stock price hit or went through the next full number following the last current figure. As an example we could in linear form write that a stock traded in the following order starting with a price of 45: 45-46-47-48-49-50-49-48-47-46-47-48-49-50-51-52-53-54-53-52-51-5051-50-49-48-47-48-49-48-47-46-45-46-45-46-45-44-43-42-41-40-39-40-41-42 -43-4445-46-47-48-49-50-51 and on and on. Where the word "Figure" came into usage was that that was exactly how the preceding figures were charted, as follows: 54 53 52 51 50 49 48 47 46 45 44 43 42 41 40 39 38 37
50 49 48 47 46 45
49 48 47 46
54 53 52 51 50 49 48 47
53 52 51 50
51 50 49 48 47
49 48
48 47 46 45
46 45
46 45 44 43 42 41 40 39
51 50 49 48 47 46 45 44 43 42 41 40
So if we were back in the nineteenth century, this is how we would be laying out our P&F charts; but some time later (probably in the twentieth century) writing the actual figures as above was felt to be a bit cumbersome and the entry method
- xxvii-
EDITOR'S INTRODUCTION
was changed. The change was to keep the price scale on the left and use "Xs" to indicate an upward movement of prices and "Os" when prices move in a downward direction. Later on it was found that just using "Xs" alone would suffice and that change of direction was clearly evident as one got used to reading the chart. So there we have the whole basis of charting P&F graphs. And on top of everything it is easy to actually graph. Even though practically every analytical software program around today will produce P&F charts to the exact specifications of the user, with their ease of insert, the suggestion from this quarter is that those charts that are the most important should be graphed by hand. This writer can do no better than to quote one of our esteemed Masterclass Series book buyer's comments which appeared in an article in the November 1999 issue of the renowned Technical Analysis of Stocks & Commodities magazine. Interviewed by the Editor, John Sweeney, was Hamilton Lewis whose company manages some $95,000,000 and who gives credit to P&F graphs and techniques as being the major tool in his analytical approach. Notably Hamilton drew attention to the fact that, though he could use a computer to keep his P&F charts up to date, he still updates them by hand. When questioned why he has chosen to forego the ease and the quickness of the computer, his answer went right to the heart and soul and key of all Technical Analysis. "If you do it yourself you get a keen understanding of where the market is." So here in a nutshell is what technical analysts have to strive for whether one uses P&F charts, Line-and-Bar charts, or Candlesticks - and in the P&F material that is now upon us in the following pages, one of these masterly ways is so beautifully explored. DONALD MACK Series Editor E-mail:
[email protected] - xxviii-
THE POINT AND FIGURE METHOD OF ANTICIPATING STOCK PRICE MOVEMENTS BASIC PRINCIPLES VOLUME 1
by
Victor De Vi1liers and
Owen Taylor
OTHER WORKS BY THESE AUTHORS
VICTOR DEVILLIERS
Financial Independence at Fifty How to Buy Low and Sell High Detecting the Buying and Selling Levels The Point and Figure Method of Anticipating Stock Price Movements with Owen Taylor
Advanced Theory and Practice of the Point and Figure Method - with Owen Taylor OWEN TAYLOR
Vital Guideposts to Successful Trading and Investing Charts - How to Make and Read Them Short Selling - For Trader, Investor and Business Man Stop Orders - How to Use Them For Profit Low Priced Stocks - When and How to Buy Them Puts and Calls - How to Profit From Them Key to Stock Price Movements - Logic of Stock Market Trendswith Edwin L. Ayres
The Point and Figure Method of Anticipating Stock Price Movements - with Victor DeVilliers
Advanced Theory and Practice of the Point and Figure Method - with Victor DeVilliers
PREFACE TO FIRST EDITION
Experiences of the recent bear market which had its termination in July 1932 caused many former investors and traders to turn to the literature of economics and market technique in order to get a better understanding of the principles underlying stock price movements. Many have come to realize the futility of depending upon tips, rumors, and gossip to guide them in their market commitments. Countless others have come to the conclusion that statistics and fundamentals serve only to aid the manipulators, banking sponsors and insiders to unload their stock on the unwary. All will agree that a correct analysis of the technical position of stocks and the market in general is the only key to consistent profit from speculative and trading commitments. Until the publication of the original edition of this work, it was the privilege of the few who made fortunes from speculation to have the advantage of this, the most logical and pragmatical of all methods used for the purpose of plotting the price course of stocks and commodities. This Method has been the keystone and bulwark of the plans of America's most successful speculators and commentators, from Charles Henry Dow, the father of the art of anticipating stock price movements, down to and including those who have profited most during 1929 and subsequently. We offer you the principles of this tried and proven Method because we feel that a broad dissemination of this information will do much to prevent the excesses of bull market peaks and also help avoid the unreasonable deflation of values, as well as the vicious cycles of forced selling and the resultant suffering of depression lows which so surely must follow. We desire to express our appreciation to Mr. J. Martiney of the publisher's technical staff for the many helpful suggestions given and his care in the preparation of the charts used in this work. We gratefully acknowledge our indebtedness to Charles Henry Dow, William Peter Hamilton, James R. Keene and others whose works and achievements have been an inspiration and a guide. Victor DeVilliers Owen Taylor New York City January 1934
-3-
INTRODUCTION TO FIRST EDITION
The Point and Figure Method had its beginning sixty years ago and subsequently has been used by some of the eminently successful operators in their important stock market campaigns. With the passing of the years, the Method has been refined, improved and adapted to changed market conditions. The underlying principles of the Method, however - based on the immutable Law of Supply and Demand - are unchanging and are constantly effective. The theory and practice of the Method is fully treated in Vol. 1 The Point and Figure Method of Anticipating Stock Price Movements (written in 1933 - revised in 1934) Vol. 2 Advanced Theory and Practice of the Point and Figure Method (written in 1933 - revised in 1934) Vol. 3 The Time Tested Technique of the Point and Figure Method (written in 1939augmented in 1940 and 1941). The first two of these three texts were written from the viewpoint of the individual stock trader at a time when pool operators gave strong impetus to market movements. Such operation injected a manipulative or artificial element into the supply and demand relationships in the market. But Supply and Demand whether artificial or genuine, manipulative or otherwise, and whatever their causes - are the forces that create price change. The Point and Figure Method measures these forces and enables one to arrive at sound and reliable conclusions as to subsequent price action. This Method, a generation ago, was used largely to create profits through market operation. Today it is used by some of the largest and highest ranking fund managers whose objectives are capital and income conservation and growth. The Method also is used by commodity processors for guidance in the purchasing and hedging of their extensive inventory requirements. In placing these texts in your hands we are conscious of their literary and technicallimitations. If some principles are treated dogmatically it is for the purpose of fixing them firmly in your mind. If some of the many principles appear to overlap or seemingly conflict with others, we ask you to disregard it at the start
-5-
THE POINT AND FIGURE METHOD
and simply master each principle as it is expounded. Weighing and coordinating these principles is the vital factor in Point and Figure analysis. Development of skill in this technique will be accomplished and hastened by practice on your part. Instances of extraordinary success in investment account management and in commodity market operation, through Point and Figure means exclusively, are constantly coming to our attention. Such success is attributed to the skillful use of the principles set forth in these modest texts. We mention this as an inspiration to you and to emphasize that this work is of far reaching value and importance. Stock Market Publications Inc.
-6-
FRONTISPIECE Fig A
Th~ i>Oll1t
flqllr~ ~~thod 0/ At1tlcIF(Jtlfl~/tOCk I>rl£~ ~OVt;It1~l1t" Qt1d
If/hI:
ONLY METHOD Loqlcal
and
BA/Et
O~
JCI~t1~IIiC
MECHANICAL PRINCIPLEI Juch (J.r
THE LEVER-••• THE fULCRUM •• THE CATAPULT. • ThtJt NECHANICAl Jp.lNCIPLEJ' art all Involv~d 111
Itock
!)rlc~ ~OV~I11Gl1t.r
PROfiT' ARE AVAILABLE TtfO/E WHO WILL
AI>~LY
FOil
THE~
FigB
JCIENTIFIC MECHANIC" P()INTANo FIGURE METHOD CHARTI of
LEVERAGE
~
x
"
CATAPULT ACTION
= x x
X
~ s
CATAPlJLT
xxxxx xxx. xxx xxx
l(X
""XX
0
~)(
xxxx
xx
x~x
)( x
X
•
s ..~ 0
:X)( ~~ xxxx)(XX
llX~)(A:)CGl~X)(X
-FULCRUM-
LEVERAGE
LEVERAGEANDCATAI>ULT ACTION CREATE· I> ROFITt FOR YOU
1
THE PRINCIPLES OF THE POINT AND FIGURE METHOD
Logic is the basis of this Method Irrelevant fluctuations eliminated How the Method got its name Graphs are logical and scientific Introductory summary of important principles Needed accessories are few Plotting a stock price movement One point charts the basis of the Method Accessories and working tools
-9-
THE PRINCIPLES OF THE METHOD
Fifteen years before the turn of the last century, Charles H. Dow, student, scientist and philosopher, a brilliant economist and a well respected financial writer, began to observe and study the phenomena of Stock Price Movements. He was the founder of the Wall Street Journal. His writings, though not prolific, are the beginnings of all price movement comment, his observations the foundation underlying all technical methods, and his studies and graphic records the seeds from which the Point and Figure Method grew. The work of Dow was ably carried on by his protege and successor, William Peter Hamilton, who edited the Wall Street Journal until his death in 1929. The writings of Hamilton form the principal source from which Dow's Theory of Stock Price Movements has become available for study. At or around the beginning of the present century, when the expansion era was in full swing, a group of speculators recognized in Dow's research* a clear illustration of price movements portrayed through the use of figures which showed a repetition of pattern as it unfolded its tracings on Dow's graphic records. The patterns thus formed were oft-times repeated, and established a precedent and guide to future price movements. Here, then, was the beginning of a truly scientific and logical method of anticipating stock price movements. Fifty years of background, millions of dollars of profits taken out of the stock market, and thousands of hours of study and development, are historical events which commend this time tried Method to you. In explaining the basic principles of the Point and Figure Method, we will show that the full point and full figure fluctuations in variable equities, be they commodities or stocks, are the vital statistics which hold the key to technical position and the future price path. Professionals and others who have been successful in their judgment and anticipation of market action, have reached their conclusions by aid of recorded data of one kind or another. In practically every field of endeavor, whether it be in the arts or sciences, in the industrial world, or in the stock and commodity markets, full and detailed records of past and current essential data must be kept. It is of little consequence whether these records are maintained as tabulated figures or by means of logs or charts, which are merely graphic representations and plottings of those essential records.
* See pages 36 and 153, The Stock Market Barometer, by W. P. Hamilton.
-11-
THE POINT AND FIGURE METHOD
Charts of stock price movements are vital. There is an ancient Chinese axiom dating from the Confucian era which states, A picture is better than a thousand words." It is self-evident that a picture conveys a clearer and more detailed message than a mass of words or columns of tabulated figures. Since instant comparison and maximum condensation are vital to the art of anticipating stock price movements, we endorse the practice of keeping and maintaining up-todate charts. Graphic representations of the fluctuations of stock prices are vitally important to a critical analysis of technical position and are the keystone of the Point and Figure Method. II
LOGIC IS THE BASIS OF THIS METHOD Few will dispute the fact that the old fashioned custom of relying solely upon published statistics of sales and earnings for market commitments, must now be relegated to the past. All will agree that by the time these statistics become available for public consumption, others, principally the insiders, the sponsors and the manipulators, have already profited amply therefrom and are ready to unload their commitments as the news becomes public property. We must, therefore, find a method which will show us when the insiders are buying and also indicate when they are commencing to sell. Given the ability to recognize their acts on our charts, it follows logically that we will be able to buy when the insiders buy and sell out when they sell. The patterns portrayed on our charts and application of the principles of the Point and Figure Method will show us when buying is overcoming selling and vice versa. If you are ready to agree that the present movement of stock prices, as recorded on the ticker tape, is the best and surest indication of the probable direction of the future price trend, then this Method can be used to show the way. It should be needless for us to state that some intensive study and a thorough understanding of the principles are necessary before you can hope to capitalize on that knowledge. Once a solid foundation is laid, your judgment will develop in a logical manner, and you will quickly begin to recognize many profitable opportunities. You will be more certain of yourself, and the courage of your convictions will materially increase your capital.
IRRELEVANT FLUCTUATIONS ELIMINATED The market fluctuates in countless fractional transactions which, in the final analysis, have little or no influence on future price paths. One of the basic prin-
-12 -
THE PRINCIPLES OF THE METHOD
ciples of the Point and Figure Method is to eliminate the irrelevant and regard only the important movements upon which our deductions are based. Only full point changes are considered, and fractional variations are totally disregarded.
HOW THE METHOD GOT ITS NAME The Point and Figure Method derives its name from the fact that we record by figures all full point changes. This plan or system of plotting and recording the movements of the market in general, and of selected individual stocks, is a basic principle of this particular Method. In this one characteristic, it is totally different from any other plan, method, or system of anticipating stock price movements.
GRAPHS ARE LOGICAL AND SCIENTIFIC A casual glance at the illustrations in this work will show a new kind of chart which, in contrast to all others, has a scientific basis to recommend its use. The Point and Figure graphic records are made up of a series of symbols composed of X's, fives and zeros. The special design of graph paper which we suggest for use with this Method shows the relationship of these symbols to each other and to the past and probable future price movement. Familiarize yourself with the form and style of these important aids, namely, the charts upon which we rely for our conclusions. Point and Figure charts condense the price fluctuations in such a manner that you will soon learn to recognize accumulation, mark-up, and distribution and thus be able to make your commitments more profitable.
INTRODUCTORY SUMMARY OF IMPORTANT PRINCIPLES The Method will be fully explained in every detail as we proceed. Each step will be carefully developed and clarified before we proceed with the next. All will be illustrated with examples from recent market action, showing the application of the principles. So that you may have a bird's-eye view of the scope of the work, we list a summary of the important principles underlying the Point and Figure Method. 1. The Method develops the ability to recognize the technical position of individual stocks and of the market in general. 2. The Method is consistent and logical, definite and positive, eliminating, as far as possible, guesswork and emotional influences. 3. The data is recorded in such a manner as to create and force the development
-13-
THE POINT AND FIGURE METHOD
of true geometrical and symmetrical patterns easily discernible and classified, and which repeat themselves in the progression of the price path. 4. The patterns thus formed create precedents by which subsequent price movements are easily judged. 5. The Method disregards fractions resulting from minor and irrelevant fluctuations. It also ignores volume. The Method is simple and complete in itself. 6. The Method dispenses with news, fundamentals, statistics, and the reasons for price movements. It concerns itself primarily with cause and effect.
NEEDED ACCESSORIES ARE FEW The data which we record in order to create the basis for the application of this Method is, primarily, all one point changes of the price movement as it fluctuates. This principle is the same whether we apply it to stock price movements, market indices, or commodities. As a matter of fact, the Point and Figure Method of anticipating price movements may be applied to any form of equity for which a free and open market exists, and in which there are price fluctuations. When full point variations of the price movement are known, they are recorded by figures. Our records are unlike the conventional vertical line or bar charts in that they are created through the use of symbols. The symbol "x" is used to record the digits 1,2,3,4,6,7,8, and 9. The figure "5" is used to indicate figures ending with the digit five. The symbol "0" is used to indicate figures in multiples of tens. At this point, it would be well for you to examine the illustrations used in this book in order that you may have a better understanding of this elementary principle used in making our charts. The full figure one point changes are recognized by the price fluctuations when they reach each new full one point change. The change thus noted is recorded, whether it be the next higher or the next lower figure, and the change must be recorded each and every time it shows on the tape. At this point, let us emphasize the fact that herein lies the vast superiority of this Method over all others. When we record all full figure changes, we are better able to detect accumulation, distribution, and the characteristics peculiar to the particular stock or commodity under observation. Note, here, that we disregard all movements of seven-eighths points or less, when fluctuations are in eighths. In cases where fluctuations are in tenths or dollars, we must determine whether we will plot the full one-dollar changes or whether the changes in tenths would better serve our purpose.
-14 -
THE PRINCIPLES OF THE METHOD
PLOTTING A STOCK PRICE MOVEMENT After we obtain the full figure changes, we proceed to make our graphic record from that data. We require for that purpose, graph or charting paper ruled for quick and easy use. Ideal paper for this purpose is "Ideal Charting Sheet Number 5001." This paper is ruled with vertical and horizontal columns, arranged with shadowed symbols "0" and "5/' and with the horizontal columns for these important digits accentuated. The vertical columns on our charts are used to limit the plottings of the price movement as long as it continues in one direction without a reversal. As soon as a reversal occurs, and we find the needed square already occupied, we move to the next right-hand vertical column. This vital principle must be fixed firmly in your mind, as it is the only one that may give you difficulty later on when you proceed to make your own charts. The Point and Figure Method relies on price changes only, and the graph paper is designed to properly record those changes. The day-to-day time factor and daily volume are ignored. The columns of squares are scientifically designed so as to permit the plotting of true trendlines and to force the development of true geometrical and symmetrical patterns which facilitate accurate comparisons and dependable diagnosis. In the case of a stock selling at $20 per share, we would record the zero in the square on the 20 line. The next record would be made when the stock sells at flat price 21, or at flat price 19. Should it go down to 19/il, or up to 20?1l, no change would be made.
ONE POINT CHARTS THE BASIS OF THE METHOD When a series of full figure one point changes of a price movement have been recorded, they create a scientific basis from which to draw conclusions. Because of the fact that similar causes usually create similar effects, our conclusions have a dependable basis not available through the use of any other method. In addition to the one point charts, one may easily prepare from them either three or five point charts or both. These are helpful for gauging the technical position of any and all issues, volatile or otherwise, and for revealing the broader intermediate moves of stocks and the market.
-15 -
THE POINT AND FIGURE METHOD
ACCESSORIES AND WORKING TOOLS In addition to graph paper, one needs a record of the actual full figure changes
garnered from the most accurate source, the ticker tape.* When using this especially designed paper and the daily service which is available, it is a relatively simple matter to keep current the needed changes on one hundred stocks and the important popular averages or indices, in about thirty minutes each day. Form this habit, as it will afford you an opportunity to analyze the patterns as they unfold themselves on your charts and thus take advantage of the implications which develop, first in one issue and then in another. The little effort expended in keeping these charts up to date will soon pay you handsomely, for you will be training yourself in stock market technique in a way not afforded by any other method.
* Full Figure Daily Data published by Stock Market Publications, New York, N. Y.
-16 -
2
THE WEIGHT OF AUTHORITY BEHIND THIS METHOD
Refined to coordinate with present day markets Mystery and complications have been clarified Expensive financial and economic reports unnecessary Certain factors taken for granted Analytical technique easy to master Losses limited while profits accrue Method weighs forces of buying and selling
-17 -
THE WEIGHT OF AUTHORITY BEHIND THIS METHOD
The Point and Figure Method has grown from a crude beginning which started more than fifty years ago. Charles H. Dow, the founder of the art of anticipating stock price movements, created much which led to the development of the technique of this Method. Dow, in his research, was interested primarily in recognizing the main, broad, long term trend which results from the movement of major capital into or out of common stock equities. This main trend was rightly termed the "Capital Movement Trend" by Mr. Edwin L. Ayres in his book Key to Stock Price Movements.* The secondary corrections to the main trend, though of interest to Dow, were not the goal of his efforts. He considered the secondary movements highly misleading and concluded that the shorter day-to-day swings were unimportant. However, we must bear in mind that since Dow's work was completed, the stock market and America's financial structures have undergone revolutionary changes. Common stock equities of American corporations have attracted a world-wide speculative following, unprecedented in the history of finance and of speculation. In Dow's era, a move of 20 to 30 points in the Industrial or Rail Index consummated in a period of a few years was considered a complete bull cycle. Under present day conditions, we note, on occasion, moves of 10 to 20 points in either or both indexes completed in a few weeks. Three, nine or sixteen million share days, such as were recently witnessed, were undreamed of at the time when ten or a dozen stocks were the active trading mediums, and volume was limited to a few hundred thousand shares a day. One can, therefore, understand why Dow passed lightly over the minor and secondary movements and sought only to ascertain the main trend. These minor and secondary movements have now become all important. Their study, analysis and the understanding of how to use them form the basis of the most successful method of stock price anticipation. It has been intimated that this Method was first successfully used by James R. Keene during the merger of the United States Steel Corporation in 1901. Mr. Keene was employed by the sponsors of the Steel Corporation to distribute to the public the original stock of the corporation, which its real founder, Andrew Carnegie, refused to take in payment for his equity and profits resulting from the merger. Mr. Keene, originally a Western mining promoter, was a skilled tape reader, a shrewd observer, and a successful market operator. His ability has never been surpassed and rarely, if ever, equaled. It has been stated by his close associates * Key to Stock Price Movements - Logic of Stock Market Trends, Stock Market Publications, New York, N.Y.
-19 -
THE POINT AND FIGURE METHOD
that the Point and Figure Method was known to and used by him during all of his successful campaigns.
REFINED TO COORDINATE WITH PRESENT DAY MARKETS Like all knowledge, the Method has developed with the passing of years and has been refined, improved, and coordinated with the ever changing conditions of stock market action. The scientific basis of the fundamental principles underlying the Method alone accounts for its survival while most other methods have been relegated to the past. You may confidently depend upon the Point and Figure Method knowing, first, that it rests upon a sound scientific basis and, secondly, that it is vastly superior to any other plan for anticipating stock price movements. In the past as well as at present, it has been and is relied upon by many of Wall Street's most successful interests. The data which should be kept will be described in utmost detail. Bear in mind that there is a great weight of authority behind this data, and we ask of you to respect its implications. We have found by the trial and error method those refinements needed to fit the basic principles to present day markets. It was ascertained that a careful checking and rechecking of the conclusions arrived at by means of this Method is of vital importance and cannot be over emphasized.
MYSTERY AND COMPLICATIONS HAVE BEEN CLARIFIED The Point and Figure Method, as here presented, is devoid of mystery and complications and has proven itself of incalculable aid to your authors. We begin by reducing the vast accumulation of transactions comprising market action to the important and relevant moves, which are plotted on charts. From these graphs showing the present market action, we are able to judge the probable future direction and extent of a stock's movement. The Point and Figure Method permits stock market trading to be considered a serious business with a scientific, substantial, and definite background, based upon actual facts rather than guesswork. Like all other businesses, it demands the making and preserving of certain simple and vital records. It demands that you study those records carefully and permit your judgment to be based upon solid facts. None will deny the old copy book maxim "Practice makes perfect." The Point and Figure Method actually
- 20-
THE WEIGHT OF AUTHORITY BEHIND THIS METHOD
compels practice and extensive study which soon becomes a habit as well as a fascinating hobby.
EXPENSIVE FINANCIAL AND ECONOMIC REPORTS UNNECESSARY This Method dispenses entirely with the expense and labor involved in the purchase and maintenance of bulky reports, statistics, balance sheets, earnings statements, and other cumbersome paraphernalia hitherto associated with trading and investing. The substitution of the simple records required by this Method is, in itself, an important consideration and a welcome relief.
CERTAIN FACTORS TAKEN FOR GRANTED The following facts are taken for granted by the Point and Figure Method: (a) That the correct valuation of a stock, at any given time, is the price paid for it at the time of the consummated sale. This is because the forces underlying the law of supply and demand and the consensus of opinion of the buyers and sellers have determined the value at the time the sale is made. (b) That the last published price of a stock reflects all that is known by the general public at the time when established, as a result of a sale and purchase which consummates a transaction. (c) That the insiders, who are presumed to know more about any particular stock than the public, cannot completely conceal their future intentions with regard thereto. (d) That the plans of the insiders will be revealed in due time by the technical action of the stock itself. The Point and Figure Method is not a system for "beating the stock market." It is the result of the rationalization of logical principles successfully used by important market interests.
ANALYTICAL TECHNIQUE EASY TO MASTER Assuming that the student will keep the required records, there remains only the need of an understanding of the technique of reading and interpreting them. In the pages to follow, we illustrate for you in detail and with clarity the technique of interpreting the patterns which develop on your Point and Figure Charts.
- 21-
THE POINT AND FIGURE METHOD
While proficiency may not come at first, yet, in a short time, through study, practice, and observation, the habit of correct thinking in terms of the Point and Figure Method will become apparent, and the resulting sound judgment will soon replace uncertainty and confusion. It is confidently expected that, as a result of this study, observation, and practice, the reader will learn to properly appraise the price movements, analyze the technical condition, and deduce therefrom plausible conclusions, the correctness of which will soon exceed the errors you are apt to make. With proficiency attained, your market operations cannot help but result in profit.
LOSSES LIMITED WHILE PROFITS ACCRUE Success in trading and investing, whether by method or by chance, comes not as a result of being perfect, but in consequence of completing a sufficient number of successful transactions netting substantial profits to offset the few errors which may show limited losses. In order to limit losses and to check possible errors, we employ the simple technical aid known as "stop orders." It is unnecessary for us to go into detail here, as the theory and application of stop orders are fully described in many other works.* In no other enterprise or business is it possible to protect profits or check losses with the same ease and facility as is possible in the stock or commodity markets, through the simple expedient of stop orders. We strongly endorse the use of stop orders except where "averaging" or "pyramiding" is resorted to. Many admonitions have been given against averaging and pyramiding, yet this Method not only tolerates, but, at times, presents ideal points at which both may be resorted to, for the reason that each commitment is independent and is made on its own merits. This will be fully explained in a later chapter. A pyramid is created when the profits accrued on a position are used to buy additional commitments. This practice usually develops into an inverted pyramid when it is resorted to in connection with credit - borrowed funds - used to finance a margin account. An inverted pyramid is exceedingly dangerous because the load gets top-heavy, as the human weakness to make huge and quick profits invites an over-extended commitment, which, as a general rule, is wiped out on the first technical reaction. We average a position by buying additional quantities of stock as it sells lower in the price range. This Method indicates ideal points at which to make additional commitments for the purpose of averaging one's cost.
- 22-
THE WEIGHT OF AUTHORITY BEHIND THIS METHOD
METHOD WEIGHS FORCES OF BUYING AND SELLING The Point and Figure Method actually measures the forces of supply and demand, and records the support and resistances at all points. It permits of a wide range of visualization through its lucid, graphic records which allows quick and ready comparison of one stock with others and with the market in general, as reflected by a good index and, most important of all, with its previous technical action. These records, if properly compiled from reliable sources, will indicate the true trend of the market and of stocks, and will point out the best trading and investment opportunities. The Method indicates when and what to buy. It also cautions when to get out, first, through clear signals to act, then, through definite indications for the logical placement of stop orders. It teaches you to adopt a professional approach to your market transactions. Professionals may be considered as the insiders, pools, independent operators, stock sponsors, bankers, and others usually referred to as "they" by many market commentators.
* Stop Orders - How to Use Them for Profit, by Owen Taylor.
- 23-
3
ADVANTAGES OF THIS METHOD OVER OTHERS
Speed and ease of recording data The Method ignores volume Price changes versus volume Supply versus demand Volume easily manipulated Facility of this method The utter simplicity of the records Manipulation readily detected Use all full figure changes in making charts Method is superior to inside information Isolation develops best results Our charts reveal plans of the majority How the move begins Stock market trading is a business Inside information unnecessary One point charts show all
- 25-
ADVANTAGES OF THIS METHOD OVER OTHERS
There are certain definite and inherent advantages of the Point and Figure Method not possessed by any other method. These advantages are: (a) the elimination of non-essentials, (b) the ease of condensation, and (c) the speed by which results may be achieved. These superior qualities are again stressed in order to point out that the simplicity of this Method does not curtail its accuracy and dependability. A simple machine with a few well constructed parts will operate far more efficiently than a complicated mechanism with ponderous accessories. So it is with the Point and Figure Method.
SPEED AND EASE OF RECORDING DATA The Method provides, amongst other things, clarity and simplicity in the keeping of its graphic records. This results in the creation of logical and clean-cut patterns on the graphs and higher speed in the plotting of the necessary data. It will enable you to maintain the records of more stocks, and be a source of checking and correlating all of the facts, with a view of arriving at a correct interpretation of market activity and profiting therefrom.
THE METHOD IGNORES VOLUME The Point and Figure Method entirely dispenses with the recording of the volume of sales. Many have felt this to be a distinct deficiency under the belief that volume is a dominant factor. We are unwilling to concede that volume is the vital influence which, in the final analysis, governs the price movement. It is conceded, however, that volume is an influence when used as an aid in other methods. In our opinion, the Point and Figure Method has proven itself so much more reliable, that we are satisfied from our research and experience to conclude that the number of price
changes and the manner in which they combine themselves have a more scientific foundation than the influence of volume in the anticipation of price movements.
PRICE CHANGES VERSUS VOLUME Let us analyze the effect of the influence of volume as against the effect of price change only. What is the aim of all methods which seek to anticipate stock price movements? Do we seek to know how many shares are exchanged? Or, do we desire to determine whether stocks are passing from weak holders into strong hands and vice versa? All will agree that it is the answer to the latter question
- 27-
THE POINT AND FIGURE METHOD
which will permit us to profit most from our knowledge. Taking for granted the known fact, namely, that each transaction printed on the tape is at the same time a purchase by one and a sale by another, it is of little consequence to know the exact number of these transactions. What we desire to ascertain is where in the price scale they occur and their relationship to each other. Let us approach the problem in a logical manner by taking note of the definitely known elements, in order to determine whether price changes or volume have most influence. In a speculative market, where the laws of supply and demand are operative, we must have fluctuations in prices. These fluctuations are due mostly to differences of opinion which cause what is technically known as the bid and asked spread. Experience has taught us that a great number of fluctuations in a congestion area usually indicates either accumulation or distribution. When stock is offered for sale at the market, we must take the nearest bid price; and when one is anxious to purchase a stock and offers to take it at the market, he must pay the nearest asked price. The price changes of a stock, as it moves from one price to another, are caused by the difference of opinions of those who are buying and selling. These fluctuations have proven themselves more informative for our purpose than has volume.
SUPPLY VERSUS DEMAND Furthermore, let us consider the effect of supply and demand on any product or commodity, be it stock, equities, or horseshoes. When demand is greater than supply, prices move upward. Should supply be greater than demand, then prices are forced downward. When demand has absorbed all the supply at any given price, it will begin to absorb the supply available at the next higher price at which offerings are available. As the demand increases, prices correspondingly increase. Prices recede as a result of absence of demand or an oversupply. These factors show that price, as such, holds the key to supply volume as well as to demand volume. These fluctuations or price changes, when plotted by means of the principles outlined for you in this book, will more accurately indicate the technical condition, the relationship of supply to demand, than any other known method which can be used for the purpose.
VOLUME EASILY MANIPULATED Volume, as well as price fluctuation, can be artificially manipulated. Manipulations of volume at any given price level are deceptive and cannot reveal the dif-
- 28-
ADVANTAGES OF THIS METHOD OVER OTHERS
ference between true and artificial demand. As contrasted with that principle, consider how easy it is to detect artificial support resorted to for the purpose of distribution when many changes in the price of a stock show that it cannot absorb the supply at the upper registered level, or that demand is insufficient to reach to the next level of supply. This principle becomes more clearly apparent as you compare these conditions in one particular stock with the market and other stocks. Volume indications have a tendency to vary greatly with the changes in the floating supply of stocks as well as changes due to the open short interest in the market. We, therefore, conclude that price changes of themselves, with their relationship to each other and to the market and other stocks for comparison, are vastly superior than is volume, used with any other combination. Herein, then, lies the vital and vast superiority of the use of price changes and the Point and Figure Method.
FACILITY OF THIS METHOD This Method permits and facilitates the easy recording of the essential data, and a simple and logical method of analysis. The direction of the trend, the extent of the move, and a reasonable approximation of the culmination thereof, are all easily determinable. Through the aid of the one, three, and five point charts, one may be reasonably certain of the shorter immediate swings and the more profitable intermediate trend moves, as well as the main broad swings of the bull and bear market cycles - the Capital Movement Trend. We can visualize at a glance, through the aids afforded by this Method, namely, the one, three, and five point charts, the broad zones of accumulation and distribution in the main swings, as well as the closer areas of supply and demand of the narrower and more speculative intermediate trend moves. Our data shows, at a glance, the moves by important areas, by months, by days, by the all important dividend periods, by seasonal influences, and by main business cycle influences. It also shows the results of speculative influences, as well as the effects of long range investment buying and selling.
THE UTTER SIMPLICITY OF THE RECORDS Examine now Chart Figure 3.1. This is an illustration of a hypothetical move from a start and low of 50, to a high of 55, and a close at 54. Here we illustrate a one day move which by other methods would not permit of technical analysis, yet by the Point and Figure Method, we are given two possible price paths, each of which would connote a different technical condition.
- 29-
THE POINT AND FIGURE METHOD
Fig 3.1
One point charts I I I I
I 55
FIGURE
I I I I I I
~=~
55 545454 5353 535353 5252 5252 5252 515151 51 5050
5 0
t
55
55 5555 55 5454 5454 545454 535353 53 5252 51 50
5 0
I I
TREND OUTLINE
It\
rr-
I I
GEOMETRIC
II
~ I" \I1\ 1\1 IV 1\1
IV
/'\ 1\ \I
II'
I I I I I
"
V
I I I I I I
IV
I
I I I I I I I I I I I I
I I
I I I I I I I I I I I I I I LJ I I
L
t
Note the upper half of the illustration, which we diagnose as bearish. Study carefully the three separate and distinct methods by which data may be recorded when using this Method. The first plan is recording by figures. Trace the move, 50, 51, 50, 51, 52, 51, 52, 53, 52, 53, 52, 51, 52, 53, 54, 55, 54, 53, 52, 53, to 54, the close. The pattern just to the right of the figure chart is called a trend outline chart and illustrated the same move. On the extreme right you may observe the geometrical chart of the same move. Note now that all of this action may be recorded by one day's market fluctuations in a fairly active issue in normal markets. This illustration is bearish because it indicates stock in supply around the 52, and 53, levels with a temporary push through to 55, near the close. Now regard the lower half of our illustration Figure 3.1. Trace the move,50,51, 52,53,52,53,54,55,54,53,54,55,54,55,54,53,54,55, 54. This move is diagnosed as bullish because it indicates scarcity of offerings below 55, and its ability to hold the advance above 53. The analysis above is made on the actual movement of the issue as shown. If the immediate previous action was plotted and available for comparison, our diagnosis might change. - 30-
ADVANTAGES OF THIS METHOD OVER OTHERS
MANIPULATION READILY DETECTED Records of fluctuations, upon careful analysis, reveal the manipulation. You have seen in the foregoing paragraph how the action which takes place during any market day is broken up into its important fluctuations, namely, its component parts, in order that we may be able to detect what the manipulators, pool operators, and insiders may be doing with the issue. No method as yet devised will show manipulation as clearly and as surely as a diagram made according to the principles of the Point and Figure Method. Stock sponsors and operators vary their plans of campaign. Some prefer to depress a stock and make it look very weak, even though it is their aim to mark it up to substantially higher prices. Others, whose tactics are bolder and more open, do not hesitate to bid up the price of a stock very rapidly, taking all blocks offered on the way up, and thus creating a spectacular move. The latter method is daring but very effective, because spectacular moves attract wide public appeal through the aid of board room traders and others who watch tape action, as well as comments in the newspapers which usually follow spectacular moves as they develop on the tape. When operators resort to such spectacular manipulation, lively tape action excites gossip in board rooms and thus attracts a great following for the issue. No matter what procedure is selected by the insiders in any stock, our Point and Figure charts will reveal the areas in which they are accumulating stock and will, with equal accuracy, show zones of distribution.
USE ALL FULL FIGURE CHANGES IN MAKING CHARTS Build up your Point and Figure data carefully, using for your purpose either the transactions recorded directly from the tape or the full figure daily changes supplied by the publishers of this book. When you plot all of the full figure fluctuations, you have a true representation of what is taking place in the issue. While Point and Figure charts may be compiled from the financial page quotations of your local newspaper, records thus compiled are not nearly as dependable for forecasting purposes as are those with all of the full figure fluctuations. The charts built up from authentic data consisting of the actual full figure changes, will always develop patterns in the progression of a move which soon become easy to recognize and classify. A careful study of past performances recorded in the same manner will reveal to the student several important factors which have vital forecasting significance - in that they show the proper points at which to make commitments. - 31-
THE POINT AND FIGURE METHOD
These patterns are created as a result of better buying than selling when the move is in the upward direction, and, likewise, when the move is down, they reflect the reverse - better selling than buying. Since a similar cause is always followed by a like effect, these patterns, as they develop, are generally followed by the same type of subsequent action. As we cannot build a house without some kind of foundation, so a stock cannot advance materially unless accumulation has first taken place. Since accumulation will always register on our charts, it becomes but a matter of careful observation and analysis to be able to recognize a move as it is developing and before it really gets started. In addition, we are able to know the exact point at which the risk may be limited while the profit possibilities are preserved to their fullest possible extent. These characteristic patterns on our Point and Figure Charts always develop, no matter what the condition of the market may be. It is immaterial whether it be a slow day with a half million shares as the average, or a fast session, with five million shares as the average; our Point and Figure charts will reveal, with accuracy, the technical condition of the price movement as plotted and observed.
METHOD IS SUPERIOR TO INSIDE INFORMATION Since it is the purpose of all market analysis to determine the balance between the forces of supply and demand, we seek a means of accurately measuring those forces. Whether demand be on the part of the well-informed insiders, stock sponsors, manipulators, or the consensus of opinion; whether it be one or more of the foregoing groups, or whether it result from sufficient outside public participation, it will bring about the same results on our Point and Figure charts. By means of the use of the Point and Figure Method, anyone who will devote sufficient time to the mastery of its principles can place himself in possession of the knowledge that will put him on an equal footing with the influential forces, whether they be insiders or outsiders. No basis for a movement in any stock can be completed without leaving definite indications in its price path together with their logical implications as the action of the stock traces its movements clearly on our Point and Figure Charts.
ISOLATION DEVELOPS BEST RESULTS As a matter of fact, those who apply the principles of this Method and handle their transactions independently are in a better position than members of a syndicate or a pool operation, for reasons later explained. Prices advance or decline
- 32-
ADVANTAGES OF THIS METHOD OVER OTHERS
because of the operation of the forces of demand and supply. While it is true that major interests, large scale operators, syndicates, and pools can temporarily accelerate or retard a movement, we must, nevertheless, keep in mind that no human force or group can very long obstruct the real trend of the market as it moves, because of influences of general economic cycles. In the last analysis, all speculative operations, whether undertaken for trading profits or for long term investment capital appreciation, must be in harmony with the main trend of the capital movement cycle, or they will result in grief and loss to those who undertake them. Those who operate with one to five hundred share lots of a stock are in vastly better position than are the large groups who must necessarily employ thousands and perhaps hundreds of thousands of shares in their operation. The small operator can reverse his position quickly, while the large scale operator cannot quickly turn about, by reason of the very size and extent of his commitment and the inability of the market to absorb so vast an amount of stock into the floating supply without breaking the movement wide open and causing a major reversal. Thus, you see that the use of the principles of this Method is more reliable than inside information. We have actual knowledge of the most potent and vital influence, namely, the actual price changes, which must be considered as the verdict of the market resulting from the consensus of all opinions which influence the issue or commodity in which we are operating. Adhere to the principle of isolation. Turn a deaf ear to all gossip, rumor, inside tips, and other information. Your Point and Figure Charts are more reliable than any other source of information available.
OUR CHARTS REVEAL PLANS OF THE MAJORITY Our charts reveal, in a condensed form, all that is known to the insiders and unknown to others, about the movement of a stock up to the very last moment. What more can anyone wish to know? Authentic and reliable inside information must not, and cannot be disclosed. Disclosure may wreck costly plans. When such information is disclosed, it is no longer inside information, and then it is not worth knowing, for it immediately becomes common property and usually develops to be the most costly type of information in Wall Street. It generally leaves you long of stock while the insiders have sold their stock and are out of the market. Remember, the news and information you get is only what the insiders and sponsors wish you to know, and then only after they have profited therefrom.
- 33-
THE POINT AND FIGURE METHOD
HOW THE MOVE BEGINS In recent years, the market has more quickly responded to combined public sen-
timent. Millions of investors and speculators comprise that public. On occasions, their demands have taken the market completely out of the hands of the insiders. Their inactivity has, at times, upset many well laid plans of some of the best banking and financial brains in the country. When these millions begin to act or show tentative signs of activity, the alert major interests - the sponsors, bankers, pool operators, and insiders - endeavor to anticipate their demands. The insiders and operators can only anticipate and start the move by quickly completing their positions and temporarily taking stock out of the floating supply. This operation is often completed in secrecy during inactive markets, when all offerings are soon absorbed without indications of demand appearing on the tape. Then follows the demand or the beginning of the demand of the outside public. After this buying has commenced, sponsors continue to accelerate the advance in harmony with the trend, buying and selling on balance, so that the value of their position, completed at the lower level, increases, as prices are forced higher. As an illustration, a syndicate operation may own, let us say, 10,000 shares of a certain issue at an average price of $10 per share. As the price begins to advance, the manager of the syndicate buys and sells on balance, yet always holds at least the amount originally accumulated, until the market price of the stock is far above the average cost of his position. At the predetermined higher price level, he begins to sell more than he buys and only buys a sufficient quantity to hold the price of the stock at approximately the level at which he wishes to distribute his inventory, accumulated substantially lower down. These operations are always apparent from the patterns formed by the price changes and portrayed on our Point and Figure Charts. When you possess this information, remember, you, too, may be considered one of the insiders. Students who take this Method seriously and apply themselves to a better understanding of it are in a more advantageous position than the insiders, since, at the first signs of danger, their smaller positions can be quickly liquidated, enabling them to stand aside while the large scale interests are struggling to complete their campaign.
STOCK MARKET TRADING IS A BUSINESS Again, we wish to emphasize this important fact - stock market trading or investing is a serious business and requires careful study and application. No
- 34-
ADVANTAGES OF THIS METHOD OVER OTHERS
other business offers similar opportunities for gain as often or as quickly as does the stock market. No other business permits one to limit loss or to insure ultimate success as do your transactions in the market, when you thoroughly understand market technique. Remember, your stock market transactions may be closed out quickly or you may reverse your position or protect it by placing strategic stop loss orders. In business, it is the major interests who dominate, and the larger the unit, the more efficient can be its management; yet that is not applicable to the stock market. Here, a very large commitment may prevent quick action when speed is essential. It is well to remember when you hear of inside information that is unsupported by positive confirmation from your Point and Figure Charts that many insiders have, in the past, made serious errors. Testimony before governmental committees has revealed only a few of the grave mistakes made by many well grounded in the fields of finance, economics, and banking. Inside opinion, inside judgment or so-called inside information, may on occasion be very good, but if your transaction is not properly timed, you may be wiped out, notwithstanding the good intentions of your informant.
INSIDE INFORMATION UNNECESSARY It is best, at all times, to rely upon logical judgment, the result of conclusions arrived at through a careful analysis of actual facts. It is far more dependable than guesswork, tips, rumors, or so-called inside information. Your full figure changes, your knowledge of their implications, the direction of the trend, and your faith in your own self, is all you need when you employ the principles of the Point and Figure Method. Inasmuch as market knowledge, by and large, is not an exact science, errors of interpretation cause errors of judgment, and hence faulty conclusions may occur on occasions. The most positive indications may be reversed almost momentarily. Therefore, if in the beginning you err occasionally, do not be discouraged. Profit from your mistakes, note the error carefully and resolve never to commit it again. Bear in mind, as you proceed, that coming events are usually anticipated or discounted by major interests and the insiders. When, in the face of bad news on a particular issue, formations indicative of accumulation develop, despite such adverse news, it is wiser for you to follow the insiders than to pay attention to the news, which may have been deliberately released in order to cause the uninformed to dispose of their stocks at a low level.
- 35-
THE POINT AND FIGURE METHOD
ONE POINT CHARTS SHOW ALL The one point figure changes, as they register on your charts, reflect all of the buying and selling. When such price changes have completed the pattern, the picture thus formed is the best sort of inside information, since it may be indicative of an impending up move or down move, as the case may be. When your three point charts confirm the conclusions reached by a study of your one point charts, you will then have corroborative proof, and your judgment is thereupon confirmed. Should the implications of your one point charts be confirmed by the three point and also by the five point charts of the same stock, then you may consider your knowledge absolute and definite, and you must act accordingly. Be ever alert and study at all times. Remember, the patterns which are traced on your charts result from the action of individuals. Your chart discloses the balance of all influences. It tells you what is taking place and when to prepare for the move as well as how to take advantage of that information.
- 36-
4
THE VITAL POINTS
Vital point I - recording full figure changes Vital point II - only full figure changes Vital point III - suitable graph paper Vital point IV - use of horizontal and vertical columns Vital point V - trend reversals Vital point VI - only one symbol to a square Vital point VII - move over diagonally Vital point VIII - skip no squares Vital point IX - formation of congestion area Vital point X - the full fulcrum Vital point XI - first buying point Vital point XII - the catapult Vital point XIII - secondary buying point Vital point XIV - the semi-catapult Vital point XV - third buying point Vital point XVI - watch for distribution Vital point XVII - trend lines Vital point XVIII - forecasting the extent of the move
- 37-
THE VITAL POINTS
The one point price fluctuations are the starting base of this reliable and time tried Method of anticipating stock price movements. For the purpose of clarifying the basic principles, we reiterate and codify these principles so as to avoid any possibility of doubt or question. The Vital Points underlying the Point and Figure Method are as follows: I II III IV V VI VII
VIII IX X XI XII XIII XIV XV XVI XVII XVIII
Record all full figure fluctuations registered on the tape. Plot these changes on suitable graph paper through the use of symbols representing the full figure changes. Make no record of a transaction unless a flat full figure change has actually been registered. Use horizontal columns for specific price levels and vertical columns for price movements continuing in the same direction. When a reversal of the price movement develops, move over to the first right-hand column and plot the subsequent changes of prices. A square already occupied by a symbol cannot again be used to accommodate another. A move to the next right-hand vertical column must be in a diagonal direction, either one square higher or one square lower than the last recorded full figure. No square may be skipped; the pattern traced must be a continuous joining of squares. Be alert to recognize and observe the formations known as congestion areas. Analyze congestion areas in order to properly take advantage of a developing full fulcrum. Make commitment near base of a full fulcrum with a stop just below lowest point of support. Watch for the development of the full catapult point. Make commitment at the catapult point with a stop close below. Watch for the development of the semi-catapult. Make commitment at the semi-catapult point with a stop close below. After an extended advance, be on the alert for first signs of distribution. Learn the technique of the use of trend lines. Study and master the principle of the Count to gauge the extent of future moves.
- 39-
THE POINT AND FIGURE METHOD
VITAL POINT I - RECORDING FULL FIGURE CHANGES We have set forth as Vital Point I the fact that we must record all full figure fluctuations which have registered on the tape. Many persons, after a casual study of the Point and Figure Method, may reach the conclusion that Point and Figure Charts prepared from newspaper data, that is the opening, the high, the low, and the close which are published daily in financial sections of newspapers, are sufficient from which to gather the full figure changes necessary to prepare our one point charts. However, this is not the case. One is not able to obtain all of the full figure changes from newspaper quotations. All full figure changes are necessary because only by recording all of them are we able to develop the proper congestion areas, which, in turn, show full fulcrums and subsequent catapult and semicatapult formations. There is little advantage to the study and use of this Method unless you make records of all full figure fluctuations. Furthermore, it is absolutely essential to record all of the full figure changes if we are to depend upon the count method for the purpose of anticipating the extent and probable culminating point of the next move. The technical terms used herein are more fully explained in subsequent chapters of this work. While it may be truthfully stated that some of the low priced stocks do not fluctuate a full point during the day, and, therefore, the needed data could be obtained from the newspaper, it must be emphasized that even though we be interested in a low priced stock which does not fluctuate actively during a trading day, we must plot the movement of the active stocks in order to get the pulse of the market and thus be able to judge the trend and turning points. Even in low priced stocks, it is difficult to get an accurate analysis of all full figure changes unless one has access to the tape so as to know whether the high or low was first established and their exact relationship to the close.
VITAL POINT II - ONLY FULL FIGURE CHANGES No transaction is recorded on our charts unless it be a flat, full figure change to the flat full figure above or below the last recorded price. A stock may fluctuate seven-eighths points above its last recorded figure, and seven-eighths points below, giving it a total fluctuating band of one and seven-eighths points, before we enter a new change on our graphic records.
- 40-
THE VITAL POINTS
VITAL POINT III - SUITABLE GRAPH PAPER Graphs or charts, whichever you choose to call them, are absolutely essential to this Method. These condensed pictorial representations of the course of the price movement with its oscillations, its advances and declines, are absolutely essential to a scientific study of stock price movements. Charts may be made on any kind of paper which is suitably ruled for the purpose. We especially recommend Ideal Charting Sheets for Point and Figure Charts, because they have been carefully designed in order to facilitate the preparation of the charts and permit instantaneous analysis after the records have been completed.
VITAL POINT IV - USE OF HORIZONTAL AND VERTICAL COLUMNS The recommended graph paper for use with this Method is laid out in columns of squares vertically and horizontally arranged similar to a checker board. The lines dividing the vertical divisions are all of uniform thickness. These vertical columns are used for containing the price movement as they continue in the same direction. The horizontal columns of squares are used to represent specific price levels. The lines dividing the horizontal columns vary in their thickness, for we accentuate the columns for the 1/5' s" and heavily accentuate the columns for the I/I0's." The plan for accentuating the 1/5" and 1/10" squares is very helpful for swift recording and quick analysis. In addition, this especially designed paper has silhouetted figures representing the I/O's" and 1/5's/' which facilitate quick placement of these particular price levels on the page.
VITAL POINT V - TREND REVERSALS Vertical columns are used to include the price movements in one direction, up or down, until a reversal develops. When a reversal does develop and we require a symbol to be placed in a square that is already occupied, it is necessary for us to move over to the next immediate adjoining right-hand column. After the first figure is recorded in a new column, we may proceed either upward or downward from that point, but not both. We must be especially careful to note that in every case we must have more than one symbol in a vertical column.
VITAL POINT VI - ONLY ONE SYMBOL TO A SQUARE Since no square can be used twice, it is essential that upon reversal of the trend of the stock price movement we move over to the next right-hand column. Each - 41-
THE POINT AND FIGURE METHOD
Fig 4.1
XYZ: one point chart
0
5
0
I
FIGURE
I
FIGURE WITH TREND OUTLINE SUPERIMPOSED
4 5
X XX
4 0
3 5
X
xx xx o0 0 xx xxx xx xxx
~
I'M X'A XI>
;-;--~-~-;-; -~-; -;-; >;- ;-;- tN- -:-::,,2--;--:--:--;--~-~-~ -:: -; 1·1·1·I·rTrrrrrfrrnmr.rrTrrrrr~rrrm ! _ - , _ . . ! _ _, _ _ , _ _ ' _ _ L _ L _ L _ L _ ' ! . _ ' - _ L _ l . _ L . _ !
L_l_J_.J_.J_
..1 _ _
J _ _'_
_
_' _ _ L_'_ _ '-_L
_L
_1.._'- _ _ '-_!
-;-;;;M:i::;- -; -;--:.-:--:--;-; _'_
I~I~HI+I:+
F~ 4±(HrU-J:~.:~ -,-·-H-:-
'~--1'~--1'-..;--:-+-;.. 1-'-1-'-1--
I-~~-;~-;~-:
: ,....Il,....f
I~
-H-H-H-
-H-H-H-H+ ...
j±i:
1+I+HI~·I-:-l+I~
I-H-H-:-
-;-
-:--:--
:j:~
-:-
-:-~-
~
-
~- ~-
~- ~- -:- -:- "':-t-,-t-,-
-;-;-
;-
-+-
-:- -:-
:;:'"
1-:-
:+*,:+:t:-" ..• ,
~-I~-t~-H-I-~
'- ,- {- gf!1:- o>no>, EEEI
ti-~~-~;-
~-~-
~-I~-I~-I~-I~-I~lt~I-~n-~l~rn-T~-~~-l*:*:r-~:tT-n;t~tt:1~:I~:"-"+H-H-j+ Hf+:-
,I, •• , " " " , . " . "
H
H -+lH-H-,+;fii-i
~- ~- ~- "-"- "- ;- "- ~- ,- ;- ;- 0- "- "- -:,- i- i- i- {- C_ -:- -:-
- :
I-:-l-cl-:I-~
~
-:-I-:-H
I-:-j-H-:-
;-
~-
..,- .,- .,-
l+
:-
,
•
~
-d-f
,-,,-,.-,,-,;-,-,-,-,-,-,-,-;-j-:-
-:
:tl~l-i-f-i-
,
f~-H-
-; -; -;
-
,
1-:-1-:1-:-1-:1+
-"-'h.-"-'+'-~'-';-~;+~-/;-I{-I~-H;{~-I-:-I-~I-:-I-:-1-~l-fJ-fFFFi-+;+;i-;+;+;t;+;+T-~-~;-~-d-'-''-h-'-.-.-,-
:i:i:~-f i:j:;:~:Q
-
-:-I-:-I-;n-:-I-:-
:+fH-H !+H-i-H
'T'T,-... -Kr}{-
-~ -~
~-:-:::: ~-
,-,..,-,..g ~- ~-:- ~"':-I-:-I-:-I-:-J-;"I-:"1-:-~-:""- r 1- .. -;- .. -t-..-t-r
-'+'.-'.-'+'+'-h-h+'+'+'-"-'~i-H-H-I+I-:-j-:-j-~J-~j-71-d-.hh+d-,
I-~H·-
f~
tg!9Wft#W.@ll~:I:::l:::l:::I:::I:::I:~rl:~I:~I:~I:~1:~1:~1:~1:~1::t:1:~*:*:t::t:t::t::~;t;:t::t::t::t;:l:-l'-t"-1 . "",.,',.".,',.,",.,",.,"",.,",.,
-,-,-,-,-,-,-,-.-.-.-.-j-:-I-:-I-:-
~++-t-"i-t"i-ti-t-i-t;-ti-ti-t-i-
H
-:-I-:-f-:-f-:-f-:-f-:-J-:-f-fj-:-
ti-H-~i-
~J-:;-I-~h'-'-
I ~·I~· (-:- (-:- I-:- I~l·~ I~
I~l ~
;t ~
HALF POINT TECHNIQUE IN ATLAS TACK
in the month of February, 1933, around the price of 1)f:2. Later, a few thousand shares changed hands at 1%, to 2, and in the month of April, we find a few shares changing hands during the first week of that month at $3 per share. During the month of May, the price of the stock advanced from 3 to 3K Thus, you see, between the months of October 1932 and the end of April 1933, Atlas Tack had a very thin market while it was being accumulated by the insiders, when 7,500 shares comprised the total transactions. At 4, shown in column B, the stock was on the catapult. This was the first important buying signal. Things began to happen during the last week of May 1933. It was at this stage, in the zone marked C to D2, that the manipulators begin to take a real interest in the issue. The advance from the bear market low to 10)f:2 the top of the rally in column D2, is to be considered a normal one for a low priced stock of a company with fairly good prospects of future earnings. The zone from column B, to column C, represents the final stage of accumulation, C, being the June shake-out of the 1933, bull market run-up. In column D1, we find the first semi-catapult occurring at 8)f:2 in this issue. Another developed at 9, in column D2. These two semi-catapults were buying points. The action of Atlas Tack from the zone A to E represents a normal bull market action of a low priced issue. Low priced issues always have best percentage advances from a bear market low point.* Accumulation was effected in the zones A, to B, during the run-up in column B, and from B to Dl. At the point marked E, we consider that the manipulators had completed their line and the stock formed a new semi-catapult at 11, which was another important buying signal. This took place during the month of August while the rest of the market was recovering from the drastic effects of the July break.
IMPORTANT SIGNAL DURING JULY BREAK In the July break, while the rest of the market lost twenty-five percent of the average price, namely from 110.00 in the Dow Jones Industrial Index to 85.00, a net change of approximately 25 points, Atlas Tack had but a slight sell-off from 10)f:2 to 9)f:2, which constituted the technical reaction between columns D2, and E. That was an important and significant signal to the effect that big things were about to happen in Atlas Tack. The negligible drop in the price of Atlas Tack during the July break was much less than normally would be expected and showed extremely strong sponsorship.
* See Low Priced Stocks. When and How to Buy Them, by Owen Taylor.
-129 -
THE POINT AND FIGURE METHOD
To those who observed its action by half point technique of the Point and Figure Method, the next semi-catapult point would have suggested an immediate purchase. Certainly, the fourth buying place, the semi-catapult at 11, would have been the best point at which to go long of this issue. The mark up in the zone column E, to F, was what might be termed "strong arm work." While the averages were still below their July tops, Atlas Tack was in this mark up phase. The ability of this issue to continue its advance and to hold its reactions at less than normal correction levels was indicative of a continuing strong sponsorship, especially when one considers the fact that the price continued to advance persistently during reactionary periods of the market.
THE FIRST CAUTION SIGNAL The first cautionary signal carne at the zone G. There, when the stock reacted from 28);:; down to 25);:;, we had the first sign of a change in the technical structure. However, sponsorship was still apparent in the zone F, to G, and, in fact, it continued until around the columns J and K. Some distribution was going on in the zone G to K. Note, however, that the sponsors were buying the stock on minor reactions and distributing it at the upper levels, they were buying and selling on balance, meanwhile reducing the size of their long position established in the zone A, to D2. A new semi-catapult developed at 29, in column H. After the reaction at G, all stops should have been advanced to a point close below the low established on that sell-off. Subsequent to the semi-catapult at 29, one should have been on guard. Stops should have been advanced close beneath the market. Surely one should not have allowed such an issue to corne back more than 2);:; to 3 points from its last high. Positions established at 4, at 8);:;, at 9, at 11, at 18);:;, and at 20);:; all would now have shown substantial profits and should have been closely guarded by stops. Notice, here, that the main trend line "LT/' intercepted the work area in column I, when the stock backed and filled in the 30 level. That was the final warning. Stops should have been advanced to just below the price of 30, and, on subsequent strength, moved up close beneath the market. Compare the mark up trend pitch with the pitch of its predecessors. The final mark up trend line, "FM/' clearly showed that the insiders had distributed a great part of their stock to the public and were standing aside. The public then held the bulk of the floating supply.
-130 -
HALF POINT TECHNIQUE IN ATLAS TACK
BOARD ROOM OBSERVATIONS The mark up in column F, when the stock advanced from 18 to 26, occurred on increased volume, and it was there that many board room habitues, customers men, and others were attracted to the performance of Atlas Tack. The churning in the zone between F, and H, represented distribution on balance by the insiders and some short selling on the part of the more experienced board room traders. The mark up in column I, occurred on terrific volume. There was another sign for board room traders. Great turnover in the number of shares of this stock, many transactions in this issue which had theretofore been extremely scarce, and rarely printed on the ticker tape as it unrolled from day to day, were indications to the more informed tape readers and board room observers that the end was close at hand in Atlas Tack. Many began to sell the stock short from column H to column J. This condition is always apparent on Point and Figure Charts when many half point changes are recorded.
THE SHORTS BEGAN TO COVER In the zone K to L, some board room traders who shorted this issue began to take in their short lines, and the sell off in the stock met temporary support due to short covering. However, the less cautious ones stayed short, for they knew that even at $15 per share the common stock of the Atlas Tack Corporation was still high in price. After the temporary demand on the part of shorts who were covering around IS, was met, further supply carried the stock down to 10, and, in the zone L to M, this issue found a normal level consistent with its actual value and reasonable prospects.
POINT AND FIGURE ANALYSIS Notice that the zone H, to K, represented a large number of figure changes while little progress was made in the advance of Atlas Tack. This occurred during a period when the balance of the market had shown considerable strength. The opposite technical action occurred during the July break. That was the final signal for students of the Point and Figure Method to close out their positions. Increased volume with lessened progress, and sluggishness in the ad vance, were all definite signs that the sponsors had unloaded their stock on the uninformed public. It was time to get out of the issue, and, as a matter of fact, to look for the first opportunity where the price broke a previous support level at an inverse catapult or semi-catapult and there go short of this issue. The sell off in Atlas -131 -
THE POINT AND FIGURE METHOD
Tack from the actual high of 34% to 9)f:2, was indeed dramatic. On Saturday, December 16, Atlas Tack opened at 33)f:2 and soon sold down to 32)4. Trading in the issue was temporarily halted. The next sale recorded was 4,800 shares at 25. That day, the stock closed at 21%, and a few days later declined to the low of 10. Thus, you see that no matter where your stop would have been in Atlas Tack, the positions established at the catapult point or at any of the semi-catapult points before the advance would have netted you $25 per share, a handsome margin of profit from the first position established at 4, the second at 8)f:2, the third at 9;4, or the fourth at 11. Of course, there is a big difference between $34 per share near the high and $25 per share, the point at which the first block was sold after trading stopped. It is an indication of the danger involved using stop orders in a thin market stock. Nevertheless, it permitted the taking of mighty fine profits for those who took advantage of the signals as they were clearly developed by Point and Figure technique.
-132 -
13
THE MAIN TREND AND MAJOR CYCLE CULMINATIONS
Critical culmination points easily detected The one point chart - the basis for analysis Interpreting an intricate major culmination The first temporary top Semi-catapult point - unusually bullish pattern Strength carries through objective level The change over of technical action The top of the move clearly indicated Indications of a major culmination Bear trend technical action The investor or long term trader
-133 -
THE MAIN TREND AND MAJOR CYCLE CULMINATIONS
In order to illustrate how the Point and Figure Method will aid you to judge the capital movement trend and the major cycle crucial turning points, we have added Figures 13.1 and 13.2, one point charts of the New York Times Average from June 1929, to the now historical break which occurred in October of that year. Figure 13.3 is a three point condensation chart of the same move and Figure 13.4 is a five point condensation chart. The data used to prepare the three and five point charts was taken from the one point moves as plotted on Figures 13.1 and 13.2.
CRITICAL CULMINATION POINTS EASILY DETECTED The four illustrations, Chart Figures 13.1 to 13.4, represent the top zone of the biggest bull market ever witnessed in the entire history of finance. That top represents an important and critical zone in which an ideal test of this Method may be demonstrated. We have stated that the Point and Figure Method provides the means for judging the major as well as minor culminations of price movement trends. We add to this statement that this is the only Method which will always aid you to recognize the turn of the major cycle when the market changes from bull trend to bear trend.
THE ONE POINT CHART - THE BASIS FOR ANALYSIS Figures 13.1 and 13.2 depict all of the one point moves of the New York Times Index during the critical period from June 1929, to the break in October of that year. In those few weeks some of the issues on the big board fluctuated over a range of hundreds of points. The market from June, to September, offered exceptional opportunities for profit on the long side and the breaks of September and October duplicated those opportunities on the short side. Not only did this Method clearly show the top and the reversal from bull to bear trend at that time, but it will continue to do so again and again as the price path leaves its tracings for posterity.
INTERPRETING AN INTRICATE MAJOR CULMINATION The fifty stocks which comprise the index compiled by the New York Times, and which we use for the purpose of illustrating the reversal of the technical action in 1929, were a fair cross section of the market, when it was fluctuating around -135 -
Fig 13.1
N.Y. Times Average: one point chart (May - October 1929, page 1)
I+H 1111111111111111111111111111111111111111111111 H 1111111111111111111111111 U U 111111111111 U 1&111!111219
1;1:1:1 1 1 1 1 1 1 1 1 1 1 1 1 1 1 1 1 1 1 1 1*lj~ 1 ~lil:I,I!~lil~I I~ I ~lil~I~I ~r~lil l lti ~I~I I'~ I~1t ~
g L...J.....J.... -~
~ ~
1,1+11 11Jilsl111f.il I-
I-
Fig 13.2
N.Y. Times Average: one point chart (May - October 1929, page 2) INVERTED FULCRUM
5 5
555555
o
5
5 5
X 0
5
0
o
0 0
o
0
x
x 0
EINVERTED~
o
0
x 0
o
--
5 5
INVERTED RECOIL FULCR UM
5 5
xx x
X
o
00
0
x
0 0
0
o
0
0 0
X
5 5
5
FALS CATAPULT
TRUE INVERTED CATAPULT
5 5 5 5
~:
5 5 5 5 5
5
xx 0
0000
o
o
0 0 0
o
0 0
0 0
5
0
o
x 5
0
o
0 0
X 5
0
X 5 U)
0
0
5
5
~
f2 z
$: 0 0
0
G
H
J
I 5
K
L 5
t
~ ~ ~ ~ ~ ~ ~ I-
Fig 13.4
N.Y. Times Average: five point chart (May- October 1929)
l'I'lolllllllllllllllllllllllllllllll~nlllllllllll 5
5 51 V 5 5 5 IXV XXX
X~~X s~ X
~XXX
5
?
X
xx 285
5 5 5 XXXXXX
x 280
i X
5555 XXXXX
~~~~~~~XXXXX~
x
MT'
~
~55
X
~ INVERTED CATAPULT
55555
~555
XXX
X
IXIX
290
xxx
XXXX
FM
XX~XIXX x
xx
XXXXX
000000000
00000000000000
~iXXXX ~ x
5 5
XX~A
xx xx
5
285
x
xxx XXX
000
.!lIDO
280
~ ~
5
~ ~
75
~
x
1IIIIIIIIililillllllili
Jff 1IIIIIIIIIIIIIIIIIIIIIIIIIIIIIIIIilllllllllllllllllili111111111111111111111111111
1f-+-+ + -+-+-i6:1:I:I ~I I I ~lzl fl -+ + -+ + + -
0
X
o0
0
X
F
x
X 0 0
xx
5
x
1 0
x
0
x
5
5
x
0
~~ 5
~
0
Is X
X 5
5
X x xx xx ()
0
XI~
~~0
o ()
0
~i 0
XX 0
5 5
xxx
x
X
5 5 5
xx o ()
xx 0
COORDINATING ONE POINT WITH THREE POINT CHARTS
stock is thrown into the floating supply. It may also be for the purpose of acquiring a large block of stock, for a major capitalist, or the campaign may be with the view of gaining control of the corporation.
3. A campaign may be planned solely for the purpose of speculative profits on the part of one, or a group of market operators. In this case the operator or pool manager may be in possession of some news which is to be revealed in the future, such as an increase in the dividend rate, an announcement regarding increased sales, the discovery of new deposits in a mining corporation, or some similar news item, not as yet known to the general public, and which, more than likely will cause a demand for the stock of the corporation. The release of such a news item gives the pool manager a splendid opportunity to unload his holdings without regard to the number of points he may have pushed the stock up. On the other hand, if this news, which is to go out later, is to be of a bearish character, such as the reduction or passing of dividends, banking troubles, poor earnings or some other similar adverse factor, the campaign would be on the short side of the market. In such case, the extended short position established in the stock at high prices, would be used to support or stabilize it after the bad news was released, and for the purpose of again aiding a campaign on the long side after short positions were covered and re-accumulation had taken place.
4. Occasionally an operator may obtain a call on a block of stock around current market prices, or a little higher, with further calls to be operative when the market had advanced a number of points higher. These contracts sometimes call for a specific number of shares, perhaps five points up, until a definite price is reached when the final and largest block of stock is released to the operator upon his call.
THE MANIPULATOR'S METHODS There are many variations of the method by which an operator may accumulate, mark up and distribute his stock. Stocks must create their patterns on our Point and Figure Chart. None can escape this time tried Method.
- 249-
ADVANCED THEORY AND PRACTICE
THE FALSE START In recent years, since a greater number of traders and investors are interesting
themselves in scientific methods for anticipating stocks by movements, the careful operators, all of whom recognize this fact, must draw a smoke screen around their operations. Therefore, whether the campaign be on the up side or the down side, always be on the alert for a false start. Watch for periods of accumulation followed by a sharp shake-out. Get aboard on the shake-out if you are sure of the signal. Similarly, for a down side campaign if a period of distribution has formed a congestion area on your chart and a push-through falls dead after the stock has moved out onto the catapult or onto a semi-catapult, the failure of the push-up may be the indication of the false move to mislead you. These false moves, in addition to misleading those who are watching them, tend to dislodge unwelcome company and to invite contrary positions, which in the final analysis aid the operations of the pool. An operator conducting a bull campaign must be careful not to attract a public following, until the move has made its culmination. Therefore he aims to conceal carefully his operations, so that public interest, if any, may only build up slowly and as the move gains momentum. Tape action is created to invite public participation near the top of the move. Here near the top, the pool manager will cause his good news to be released, which will help him materially to create wide fluctuations at or near the top of his advance. This is what he needs. Good sharp run-ups with a big public following, and he will thereupon have completed his selling on balance.
POOL SWITCHES TO SHORT SIDE After he has completely unloaded his long stock, he then prepares operations for the short side. This short interest increases the floating supply and gets into the hands of weak holders, and subsequently causes a correction of the previous upmove. This short interest which the manager has outstanding, will be used lower down, after the reaction has taken place, to support the stock, and thus create more profits for the pool. The campaign above outlined may have taken many months to complete, and may have involved the purchase and sale of tens of thousands of shares, in order to accomplish its objective.
- 250-
COORDINATING ONE POINT WITH THREE POINT CHARTS
A NEW ANGLE ON NARROW FLUCTUATIONS We have written elsewhere in the book of the necessity of maintaining a professional attitude in your approach to stock speculation. Now, after we have explained to you a professional operation on the long side, you should begin to have a new outlook on the question of fluctuations, and the difficulty of catching the day-to-day short swings in order to consistently profit from them. The influence of group buying and selling, whether it be that of the manipulator for profit, or of the stock's sponsor trying to maintain a market for the stock, is the cause of the mysterious backing and filling, the sudden push-up, and the quick markdown in the shorter trading ranges. If you will always keep in mind the fact that every stock must have sponsorship and that many harbor group operations, you will obtain a better understanding and a clearer viewpoint from which to judge the fluctuations. This one principle should be worth hundreds of times the cost of this book to you. We cannot emphasize it too strongly. Study it. Reason it out in your mind. Realize the logic which lies behind this analysis of the cause of the narrow fluctuations, and profit thereby.
- 251-
11
THE COUNT - GAUGING THE EXTENT OF FUTURE MOVES
The theory underlying the count The count not an exact science Horizontal formation may disclose the extent of the move The principle of lithe count" The one point count The forecast Anticipating the next move Additional charts for study The count by three points A new point for a forecast Accuracy of the count A three point test for future market action Cumulative implications more reliable
- 253-
THE COUNT
We concede, that though this Method is time tested and has proven of inestimable value to those who understand and follow it, it may be subject to further scientific research, since in the opinion of the authors, its scientific basis must be a foundation for other and important valuable principles which such research will uncover. A scientific and dependable mechanical means of forecasting the future movements of the market has been the dream of many students and technicians, who have spent thousands of hours in search of their goal. Could we but evolve a method which would forecast both the direction and extent of the next probable move with accuracy, and could we rely with confidence on its implications, it would be considered the Aladdin's Lamp of modern finance. As a result of such experiment, Mr. Thomas L. Sexsmith, with whom we were associated from 1918, to 1921, worked on the principle now known as "the count." Mr. Sexsmith, now deceased, was a writer on economics and finance, whose books and articles have become recognized as authoritative throughout the financial world. While "the count" may be considered as a marvelous aid in many instances, and always valuable in connection with judging probable future moves, it cannot be absolutely relied upon in all cases. Its implications at times are marvelous. In some issues it will register time and time again, and can be depended upon for many moves in succession. However, for some unknown reason, it will occasionally mislead, if we rely too much upon its implications. We will do our best in this chapter to explain in full detail the theory and practice of this valuable aid to your judgment. We leave it to you to test it and decide for yourself whether or not you elect to depend upon its implications. Your authors use it and endorse it as one of the many technical aids upon which we rely for our conclusions.
THE THEORY UNDERLYING THE COUNT We have stated that the basis upon which the Point and Figure Method rests, is strictly scientific. In Volume 1, we have illustrated how the principle of the fulcrum and of the catapult can be applied to stock price movements. The principle of "the count" seems to have an excellent foundation in the science of ballistics. In a definition of ballistics, the Encyclopedia Britannica states: Exterior ballistics is that part of the science of ballistics in which the motion of the projectile is considered after it has received its initial impulse. The factors involved are the pressure of the powder or gas in the chamber of the gun from which the projectile secures its initial velocity, resistance of the bore before the projectile leaves
- 255-
ADVANCED THEORY AND PRACTICE
the barrel, the resistance of the air, and the influence of gravity, all must be calculated in order to determine the probable objective of the projectile.
Modern research has reduced the science of ballistics to almost an exact science. Given all the factors, our gunnery mathematicians, can calculate almost exactly, the degree of elevation, as well as other necessary factors in order for a given projectile to reach a certain objective.
THE COUNT NOT AN EXACT SCIENCE While the scientific basis upon which the count rests seems to check fairly well with the principles of ballistics, it cannot be said that it is nearly as reliable as the science of ballistics. Just as the gunnery mathematician needs all of the factors in order to determine the objective of the projectile, so, in "the count," we need an accurate registration of all of the full figure changes of the stock under consideration. This is true whether we judge the future probable move by our one point implications or by our three point implications. We cannot rely on newspaper quotations from which to obtain the data necessary for these calculations. It must come from the tape itself, and must show every full figure change in the congestion area. When we have all of these full figure changes from a dependable source and plot them on our one point charts, we may then proceed to determine the probable extent of the next move, whether it be in an upward or downward, direction.
HORIZONTAL FORMATION MAY DISCLOSE THE EXTENT OF THE MOVE "The count" is an attempt to estimate the probable move based upon the pressure generated in the congestion area. If the stock moves out of the congestion area on the up side, it is reasonable to presume that the implication of "the count" will give us the approximate point at which to expect the next congestion area, or the culmination of the move. Should the stock break out of the congestion area on the down side, we may then expect a trading range of support, at the level approximately the number of indicated squares below.
THE PRINCIPLE OF liTHE COUNT" The scientific basis of this principle depends upon the number of full figure squares which measure the extent of the congestion area and give us the count
- 256-
THE COUNT
either up or down from that particular point. For example, a congestion built up around a particular price level in which the stock rallies and declines five times across that area, would indicate a probable future move five points up or down from that particular price level. Take particular note here, that intervening blank squares are included in "the count" and are to be considered as though they were actually filled in.
THE ONE POINT COUNT For a clear example of the way "the count" works as a forecaster of the probable next move, turn to Figure 11.1 which represents an actual move in Baltimore & Ohio from January to August, 1933. Study carefully the following principle upon which "the count" is based. The number of times a figure is repeated at any horizontal point where a base or a resistance level is built up, is an indication of the probable extent of the advance or decline and is the number of points equivalent to:A - The number of times it registered at the average point of support or B - The number of times it registered at the average point of resistance.
In the chart of Baltimore & Ohio, Figure ILl, count the number of full figure
10 squares which are filled, including the blank. Count the number of 11 squares filled and the number of 13 squares filled. Notice here in this period of accumulation that full figure 10 was repeated nine times, full figure 11 was repeated nine times, and full figure 12 was repeated eleven times. This is a total of 29, an average of 10, for the three figures.
THE FORECAST The implication was that Baltimore & Ohio would move up or down 10 points from the full figure 11, the average price of the accumulation range between 10, and 12. By this we mean if Baltimore & Ohio broke out of the congestion area on the down side, it would go down to one, while if it broke out on the up side, it meant that it would go up at least 10, points from full figure 11, or to 21. Notice now on the Baltimore & Ohio advance that the next congestion area was built up between 21, and 23, and the first objective 10, points up from full figure 11, was reached during the months of May and June. A perfect record for "the count." No matter where you bought Baltimore & Ohio, after it left the first congestion area on the up side, you should have stayed long of this stock until it registered 21.
- 257-
THE COUNT
ANTICIPATING THE NEXT MOVE Now count the full figures registered at 21, and those at 22. This is the next congestion area. There are nine 21s, and ten 22s, indicating that the next move would be either 10, points up or 10, points down from 22. The stock broke out on the up side and rallied quickly to 35, scoring another mark for "the count" system. According to this method you would have held your long position at least until it registered 32, or 33, and when the stock made 35, you would have sold out. There was little further to gain by holding your position beyond this point, because the top registered four times was 37. Now on the upper congestion area, count the full figures 34, and 35. The average of these two is 12, and the indications were that the stock should rally 12 points from 34, or 35, or decline 12 points, therefrom. The move broke out on the down side and the implication of "the count" was that it would go down at least to 22, or 23. Here again is a one hundred per cent record for "the count" system because it did register 21, and there was ample opportunity to cover at 22. Another congestion area was built up between 23, and 25. Count now the full figures 23, 24, and 25, and you get an average of nine. This means nine points up from 24, or 25. The stock actually made a high of 36, and a fraction during August just beyond the limitations of the chart. Thus you have seen that "the count" worked perfectly four times in succession on Baltimore & Ohio during the year 1933, to date of publication. However, be careful when you rely on "the count." It does not always work, neither does it give the exact limits of the move. "The count" will guide you as to the approximate extent of the move, and the Point and Figure Method will indicate its direction.
ADDITIONAL CHARTS FOR STUDY The Charts Figures 11.2, 11.3, and 11.4 show the movement of Delaware & Hudson to further illustrate "the count" system. Notice that the reaction from A, was indicated. We have added these consecutive sheets to give further illustration of the theory and application of "the count." Trace the movements, count the congestion areas and see the great number of swings which were directly forecast by the method.
- 259-
Fig 11.3
Delaware & Hudson: one point chart (page 2)
5
5
5
0
0
0
5
5
5
8 0
0
5
6 5
5
XX XXX
xx
xx
0 o0 0 xx xx xx x x x xx xx xx xx xx 5 5 5 5 55 5 5 5 5 5 5 5 5 5 \?